SlideShare a Scribd company logo
1 of 1
Download to read offline
THERMAL SPRINGS IN THE LOWER ORANGE RIVER VALLEY
Danita Hohne1, Henno Gericke2
Department Water and Sanitation,
1Upington, Northern Cape, South Africa; email: HohneD@dws.gov.za
2Kimberley, Northern Cape, South Africa; email: GerickeH@dws.gov.za
Since June 2010 and still ongoing today, the Lower Orange River Valley has experienced over a 1168 tremors and earthquakes in the vicinity of Augrabies. Of these 1168 tremors, 71 quakes registered above 3 on the Richter scale and on 18
December 2011, the area was struck with an earthquake that registered 5 on the Richter scale. Four thermal springs are also located near this earthquake zone and the temperature of the water has a range of between 38°C -46.6°C, according to
Kent LE. (1949 /1969). 25°C is the division between thermal and non-thermal waters and the thermal gradient for the Riemvasmaak area is 24°C, clearly indicating that the four springs are thermal when looking at the temperature difference. The
Department of Water and Sanitation has been monitoring these springs monthly since 2011 and has been taking field measurements and chemical analyses.
The aim of this study is a) to see if the tremors and earthquakes have an effect on the chemistry of the thermal springs, b) to create a data set for the thermal springs, as these springs was recorded and mentioned in Kent LE. reports of 1949 and
1969 but no samples were collected and analysed, c) to see if the water source for the groundwater in the area and the thermal springs are connected and d) to see if the recent floods may have had an influence on the earthquake zone seeing as the
Orange River runs through the zone.
It should also be noted that during the time of the increased seismic activity in the Augrabies area, two floods occurred, one in 2010 and the other in 2011, this poster will also investigate the possibility that the increased flow of the river might have
had an impact on the seismic activity.
.
.
Abstract and Introduction
Location of Study Area, Geology and Data
Capturing
Data Representation and Interpretation
Results
Conclusion
References
Akromah, L. ‘Earthquake relocation using the double difference method in the Augrabies Area.” Report; Council for
Geoscience; April 2013
Boeleman, R.; Bowels, M.; Cloete, D. and Coetzee FJ. “1:250 000 Metallogenic Series 2820 Upington.” Council for
Geoscience, 1997.
Geology of South Africa; Geological Socitity of South Africa; 2006
Kent, L.E. (1949) “The Thermal Waters of the Union of South Africa and South West Africa” Transactions of the
Geological Society of South Africa, 52, 231 – 264.
Moen, HFG. “1:250 000 Geological Series 2818 Onseepkans.” Council for Geoscience, 2007.
National Groundwater Archive (NGA)
Saunders, I. Ottemoller, L. Brandt, M.B.C. and Fourie. C.J.S. “ Calibration of an ML scale for South Africa using tectonic
earthquake data recorded by the South African Seismograph Network: 2006-2009.” Journal of Seismology;
August 2012
Oliver. J. and Jonker. N. “ Optimal utilasation of thermal springs in South Africa.” WRC Report TT 577/13
Van Niekerk, H; Silberbauer, MJ. And Maluleke, M. “Geographical differences in the relationship between total dissolved
solids and electrical conductivity in South African rivers.” Water SA Vol. 40 No. 1 January 2014
VonBackstorm; J.W. (1957) “The Riemvasmaak Thermal Spring, Gordonia District, Cape Province.” GH Report Nr. 1025
Water Monitoring System (WMS)
The data of four springs were presented, one classified as thermal and three as hot. Water from the springs is highly
mineralized chloride-sulphate brines. The springs show similar chemical composition, with variances in hardness and
sodium chloride content. The water from the springs is not fit for human consumption. The groundwater and thermal
spring analyses do show a correlation and therefore it can be assumed that the resources for the thermal water could
be groundwater.
At this stage no age determination was done on the water and it would be done in future not just to determine the age of
the water but it would also be a good test to do especially when another earthquake swarm takes place in the study
area. It could then determine if there is an increase or decrease in flow of the thermal water. From the data collected it
would also seem as if there is a correlation between the Orange River when in flood and the increase in seismic activity.
It would be suggested that this must be looked at in future when other floods occur to establish a definitive link between
the increased activities and floods.
A plausible correlation between seismic activity, water temperature and chemical composition, specifically sodium and
chloride concentrations, are proposed; however, it should be noted that the current seismic activities are not scaled
according to distances from the springs. The Council of Geoscience could also determine which of the faults in the
study area have been activated and these faults can be monitored and if possible loggers can be installed to see if any
of the river water is infiltrating the thermal spring system.
.
Figure 1: The locations of the thermal springs are indicated by the starts in the map above.
Boreholes are shown as red dots, whilst river sampling points are given in blue. The
magnitudes of various seismic tremors are shown in greys.
GEOLOGY:
The study area is located in the Kakamas Terrane one of five major subdivisions of the
Namaqua-Natal Province. The age of the Kakamas Terrane is around ~2000Ma. The
eastern boundary of the Terrane is determined by the Boven Rugzeer Shear Zone and
in the west by the Hartbees River Thrust. The Kakamas Terrane stretches from
Onseepkans in the west to Keimoes in the east and around 200km south to Kenhardt
and Putsonderwater and north into Namibia. In the Kakamas Terrane the Neusberg
Shear Zone is trending NNW (Geology of South Africa, 2006).
Because of the geology the study area is highly deformed and there are numerous
faults and shear zones that can contribute to areas that might be weak in the crust
contributing to the seismic activities. The Orange River may also follow a weak zone
that contributes to the seismic activity. A concentration of the epicentres lie parallel to
the Orange River and this was found to be on both sides of the river. Structural maps
also show faults striking parallel to that all along the river. Because of the wide zone of
faults around the river, some of the faults are being activated by the strain in the crust
(Akromah, L. 2013).
Table 1: Thermal springs located in the study area and the geology
METHODS OF SAMPLING: WATER SAMPLES AND SEISMIC DATA :
Monthly groundwater samples were collected at the four thermal springs from February
2011. Samples from the two stations in the Orange River Upington (D7H005) and
Neusberg (D7H014) were also taken monthly.
The National Seismic Network of South Africa is run by the Council for Geoscience. To
collect seismic data there is about 29 stations around South Africa that register the
local magnitude, based on the Richter definition which is determined by local geology.
Three stations in the vicinity of the study area have recorded seismic data. The stations
are situated near Augrabies, Keimoes and Upington.
Since February 2010 there has been an increase in seismic activity in the study area.
The largest earthquake to date was on 25 January 2011 of 4.9 on the local magnitude
scale (Saunders, I. et al. 2012).
Since 1990 till present there have been more than 2500 tremors and earthquakes in
the study area, with most of the tremors occurring between 2010-2014.
The chemical compositions of the springs’ water were determined over a period
of time ranging from 2011 to 2013. The average value variations in quality over
time are indicated in the Piper diagrams in Figure 2. The pH values of the four
springs are all clustered around 8.3, with the exception of SF1, which is only
slightly lower. The springs are neither corrosive nor depositional – and are for
general purposes considered neutral. TDS values are high, ranging between
2200 and 3200 mg/l. The main ionic components are sodium, chloride and
sulphate ions; hence, using Bond et al.’s classification, all four springs can be
classified as highly mineralized chloride-sulphate waters.
The springs’ water is not suitable for consumption; specifically exceeding
recommended values for sodium, fluoride, sulphates and chlorides. Water quality
standards are given as specified by SANS241-2011.
Piper diagrams, given in Figure 2, were used to visualize the chemical
composition of the springs’ water. All four springs are sodium chloride brines.
Very low carbonate or hydrogen carbonate concentrations were observed. All
four springs have sulphate ion concentrations of above 500 mg/l. In terms of
cations Na+ is most prevalent. RP1 and RP3 are moderately hard, whilst SF1
and RVM1 can be considered hard in terms of Ca2+ concentrations.
The chemical compositions of the aforementioned springs were also compared
to that of the surrounding groundwater sources and two river monitoring stations
(Figure 4). Greater similarity between ground water sources (boreholes) and the
springs occur than with water from the Orange River. The springs show very
similar water compositions to each other, with SF1 and RVM1 being more
mineralized and having harder water. It should also be noted that only RP1 and
RP3 share the same quaternary drainage region (D81E) as indicated in Figure 1.
Figure 3 allows for the observation of the main chemical constituents that were
monitored over time. Variances in the temperature of the thermal springs as well
as the magnitudes of the tremors illustrated in Figure 1 are also plotted versus
time.
For RVM1 it is interesting to note that there is a spike in sodium chloride during
September 2011, this period was preceded with higher seismic activity. In August
2012 a large temperature drop was observed at RVM1, preceded by a slight
increase in Si, a drop in sodium chloride and a slight increase in sulphate
concentrations. Increased seismic activity preceded this change.
RP1 (Figure 3) shows variances in sodium, chloride and sulphate concentrations
after significant seismic activity. These variations are small. Decreased water
temperature was also observed following the periods of higher seismic activities.
A similar situation is observed for RP3 (Figure 3); however, the variations are
more pronounced. This pattern appears to hold for SF1 as well; where increased
seismic activity can lead to a spike in Na+ or Cl- or both, accompanied by a drop
in temperature.
Endothermic dissolution of particulates liberated by seismic activity may impact
the temperature of the springs; however, the increases in concentrations are not
substantial enough to justify the extent of the drops in temperature.
A comparison of tremor activity and Orange river flow rates (Figure 3) indicate a
possible link between the two.
Data Representation
Figure 2: Piper diagrams of the four springs. Dates for the values range from 2011
(lighter) to 2013 (darker).
Figure 3: Combined plot for RVM, RP1, RP3 and SF1 respectively. Top: Plot
showing how various ion concentrations vary with time. Temperature of the
spring’s water versus time. Flow rates of the Orange River at two monitoring
stations. Bottom: Seismic activity versus time.
Name Geology Estimated Depth
of circulation
Estimated
Temperature
Quaternary
Drainage
Region
Southern
Farms (SF1)
Naros Granite
and Warmbad
Suid Gneiss
1.124km 33.74°C D81D
Riemvasmaak
(RVM)
Naros Granite
and Warmbad
Suid Gneiss
1.517km 45.35°C D42E
Raap en
Skraap 1 (RP1)
Schuitdrift Gneiss
and it borders
with the Yas
Gneis
1.22km 37.28°C D81E
Raap en
Skraap 3 (RP3)
Riemvasmaak
Gneiss
1.242km 36.62°C D81E
The study area is located in the North-Western region of the Northern Cape next to the
border of Namibia. The locations of the four thermal springs are indicated in the Table
1. RP1 and RP3 are located about 60 m apart. The locations of the springs are
indicated in the map in Figure 1.
Figure 4: Piper diagram comparing the water chemistry of the springs
to that of surrounding groundwater sources and river monitoring data.
.
Conclusion

More Related Content

What's hot

Introduction hydrology
Introduction hydrologyIntroduction hydrology
Introduction hydrologyMuhammad Aleem
 
An Evaluation of Heavy Metals Concentration in the Choba Section of the New ...
An Evaluation of Heavy Metals Concentration in the Choba  Section of the New ...An Evaluation of Heavy Metals Concentration in the Choba  Section of the New ...
An Evaluation of Heavy Metals Concentration in the Choba Section of the New ...Scientific Review SR
 
Hydrology%20 Intro[1]
Hydrology%20 Intro[1]Hydrology%20 Intro[1]
Hydrology%20 Intro[1]mcirillo
 
In a warming climate, why do we see decreasing heat flux in the Arctic Ocean?
In a warming climate, why do we see decreasing heat flux in the Arctic Ocean?In a warming climate, why do we see decreasing heat flux in the Arctic Ocean?
In a warming climate, why do we see decreasing heat flux in the Arctic Ocean?Harsh Beria
 
Retrospective analysis of hydrologic impacts in the Chesapeake Bay watershed
Retrospective analysis of hydrologic impacts in the Chesapeake Bay watershedRetrospective analysis of hydrologic impacts in the Chesapeake Bay watershed
Retrospective analysis of hydrologic impacts in the Chesapeake Bay watershedHarsh Beria
 
Impact of contaminants on groundwater quality in patcham, south east england.
Impact of contaminants on groundwater quality in patcham, south east england.Impact of contaminants on groundwater quality in patcham, south east england.
Impact of contaminants on groundwater quality in patcham, south east england.Alexander Decker
 
Environmental Qualitative assessment of rivers sediments
Environmental Qualitative assessment of rivers sedimentsEnvironmental Qualitative assessment of rivers sediments
Environmental Qualitative assessment of rivers sedimentsGJESM Publication
 
Article Raoui, rjpbcs 9(2), 1100 1110, 2018
Article Raoui, rjpbcs 9(2), 1100 1110, 2018Article Raoui, rjpbcs 9(2), 1100 1110, 2018
Article Raoui, rjpbcs 9(2), 1100 1110, 2018sidi mohammed RAOUI
 
Integrated application of HEC-RAS and GIS and RS for flood risk assessment i...
	Integrated application of HEC-RAS and GIS and RS for flood risk assessment i...	Integrated application of HEC-RAS and GIS and RS for flood risk assessment i...
Integrated application of HEC-RAS and GIS and RS for flood risk assessment i...inventionjournals
 
JessicaJinAGU_POSTER (V4)
JessicaJinAGU_POSTER (V4)JessicaJinAGU_POSTER (V4)
JessicaJinAGU_POSTER (V4)Jessica Jin
 

What's hot (17)

Introduction hydrology
Introduction hydrologyIntroduction hydrology
Introduction hydrology
 
PhD Synopsis
PhD SynopsisPhD Synopsis
PhD Synopsis
 
An Evaluation of Heavy Metals Concentration in the Choba Section of the New ...
An Evaluation of Heavy Metals Concentration in the Choba  Section of the New ...An Evaluation of Heavy Metals Concentration in the Choba  Section of the New ...
An Evaluation of Heavy Metals Concentration in the Choba Section of the New ...
 
Hydrology%20 Intro[1]
Hydrology%20 Intro[1]Hydrology%20 Intro[1]
Hydrology%20 Intro[1]
 
Lilas_poster
Lilas_posterLilas_poster
Lilas_poster
 
In a warming climate, why do we see decreasing heat flux in the Arctic Ocean?
In a warming climate, why do we see decreasing heat flux in the Arctic Ocean?In a warming climate, why do we see decreasing heat flux in the Arctic Ocean?
In a warming climate, why do we see decreasing heat flux in the Arctic Ocean?
 
Retrospective analysis of hydrologic impacts in the Chesapeake Bay watershed
Retrospective analysis of hydrologic impacts in the Chesapeake Bay watershedRetrospective analysis of hydrologic impacts in the Chesapeake Bay watershed
Retrospective analysis of hydrologic impacts in the Chesapeake Bay watershed
 
Impact of contaminants on groundwater quality in patcham, south east england.
Impact of contaminants on groundwater quality in patcham, south east england.Impact of contaminants on groundwater quality in patcham, south east england.
Impact of contaminants on groundwater quality in patcham, south east england.
 
JWARP_paper
JWARP_paperJWARP_paper
JWARP_paper
 
Gl2511741181
Gl2511741181Gl2511741181
Gl2511741181
 
Yogyakarta coastal aquifer
Yogyakarta coastal aquiferYogyakarta coastal aquifer
Yogyakarta coastal aquifer
 
Technical Summary
Technical SummaryTechnical Summary
Technical Summary
 
Environmental Qualitative assessment of rivers sediments
Environmental Qualitative assessment of rivers sedimentsEnvironmental Qualitative assessment of rivers sediments
Environmental Qualitative assessment of rivers sediments
 
Article Raoui, rjpbcs 9(2), 1100 1110, 2018
Article Raoui, rjpbcs 9(2), 1100 1110, 2018Article Raoui, rjpbcs 9(2), 1100 1110, 2018
Article Raoui, rjpbcs 9(2), 1100 1110, 2018
 
Integrated application of HEC-RAS and GIS and RS for flood risk assessment i...
	Integrated application of HEC-RAS and GIS and RS for flood risk assessment i...	Integrated application of HEC-RAS and GIS and RS for flood risk assessment i...
Integrated application of HEC-RAS and GIS and RS for flood risk assessment i...
 
JessicaJinAGU_POSTER (V4)
JessicaJinAGU_POSTER (V4)JessicaJinAGU_POSTER (V4)
JessicaJinAGU_POSTER (V4)
 
Bathymetric Survey of Cross Lake
Bathymetric Survey of Cross LakeBathymetric Survey of Cross Lake
Bathymetric Survey of Cross Lake
 

Similar to Thermal Springs Chemistry in South Africa's Lower Orange River Valley

evaluation of water resources in wadi el natrun, western desert, egypt
evaluation of water resources in wadi el natrun, western desert, egyptevaluation of water resources in wadi el natrun, western desert, egypt
evaluation of water resources in wadi el natrun, western desert, egyptIJEAB
 
Update Pamphlet for Hui Aloha O Kiholo Community Group
Update Pamphlet for Hui Aloha O Kiholo Community GroupUpdate Pamphlet for Hui Aloha O Kiholo Community Group
Update Pamphlet for Hui Aloha O Kiholo Community GroupChristine A. Waters
 
Ground Water Conditions and Major-Ion Hydrogeochemistry of the Benin Formatio...
Ground Water Conditions and Major-Ion Hydrogeochemistry of the Benin Formatio...Ground Water Conditions and Major-Ion Hydrogeochemistry of the Benin Formatio...
Ground Water Conditions and Major-Ion Hydrogeochemistry of the Benin Formatio...iosrjce
 
Once A Super Continent Final Draft
Once A Super Continent Final DraftOnce A Super Continent Final Draft
Once A Super Continent Final DraftJesse Jones
 
H041203043058
H041203043058H041203043058
H041203043058IOSR-JEN
 
Deep Ocean Circulation (with presenter notes)
Deep Ocean Circulation (with presenter notes)Deep Ocean Circulation (with presenter notes)
Deep Ocean Circulation (with presenter notes)Andreas Schmittner
 
Saby et al., 2016
Saby et al., 2016Saby et al., 2016
Saby et al., 2016Marion Saby
 
Spatial variation in physico chemical parameters of eastern obolo estuary, ni...
Spatial variation in physico chemical parameters of eastern obolo estuary, ni...Spatial variation in physico chemical parameters of eastern obolo estuary, ni...
Spatial variation in physico chemical parameters of eastern obolo estuary, ni...Alexander Decker
 
Interrelationship between nutrients and chlorophyll-a in an urban stormwater ...
Interrelationship between nutrients and chlorophyll-a in an urban stormwater ...Interrelationship between nutrients and chlorophyll-a in an urban stormwater ...
Interrelationship between nutrients and chlorophyll-a in an urban stormwater ...Journal of Contemporary Urban Affairs
 
Clay mineralogy and sediment grain-size variations as climatic signals in sou...
Clay mineralogy and sediment grain-size variations as climatic signals in sou...Clay mineralogy and sediment grain-size variations as climatic signals in sou...
Clay mineralogy and sediment grain-size variations as climatic signals in sou...Journal of Research in Biology
 
Geoelectrical investigation
Geoelectrical investigationGeoelectrical investigation
Geoelectrical investigationoilandgas24
 
Wathen 2011 Climatic Changer_Past 2,000 years
Wathen 2011 Climatic Changer_Past 2,000 yearsWathen 2011 Climatic Changer_Past 2,000 years
Wathen 2011 Climatic Changer_Past 2,000 yearsStephen Wathen
 
Assessment of impact of climatic change on groundwater quality around igbokod...
Assessment of impact of climatic change on groundwater quality around igbokod...Assessment of impact of climatic change on groundwater quality around igbokod...
Assessment of impact of climatic change on groundwater quality around igbokod...Alexander Decker
 
Raoui s.m rjpbcs 9(2), 1100 1110, 2018
Raoui s.m rjpbcs 9(2), 1100 1110, 2018Raoui s.m rjpbcs 9(2), 1100 1110, 2018
Raoui s.m rjpbcs 9(2), 1100 1110, 2018sidi mohammed RAOUI
 
Article Raoui S.M., rjpbcs 9(2), 1100 1110, 2018
Article Raoui S.M., rjpbcs 9(2), 1100 1110, 2018Article Raoui S.M., rjpbcs 9(2), 1100 1110, 2018
Article Raoui S.M., rjpbcs 9(2), 1100 1110, 2018sidi mohammed RAOUI
 

Similar to Thermal Springs Chemistry in South Africa's Lower Orange River Valley (20)

evaluation of water resources in wadi el natrun, western desert, egypt
evaluation of water resources in wadi el natrun, western desert, egyptevaluation of water resources in wadi el natrun, western desert, egypt
evaluation of water resources in wadi el natrun, western desert, egypt
 
Update Pamphlet for Hui Aloha O Kiholo Community Group
Update Pamphlet for Hui Aloha O Kiholo Community GroupUpdate Pamphlet for Hui Aloha O Kiholo Community Group
Update Pamphlet for Hui Aloha O Kiholo Community Group
 
A330119
A330119A330119
A330119
 
Ground Water Conditions and Major-Ion Hydrogeochemistry of the Benin Formatio...
Ground Water Conditions and Major-Ion Hydrogeochemistry of the Benin Formatio...Ground Water Conditions and Major-Ion Hydrogeochemistry of the Benin Formatio...
Ground Water Conditions and Major-Ion Hydrogeochemistry of the Benin Formatio...
 
Dilles hqgr0164
Dilles hqgr0164Dilles hqgr0164
Dilles hqgr0164
 
Once A Super Continent Final Draft
Once A Super Continent Final DraftOnce A Super Continent Final Draft
Once A Super Continent Final Draft
 
H041203043058
H041203043058H041203043058
H041203043058
 
Deep Ocean Circulation (with presenter notes)
Deep Ocean Circulation (with presenter notes)Deep Ocean Circulation (with presenter notes)
Deep Ocean Circulation (with presenter notes)
 
Saby et al., 2016
Saby et al., 2016Saby et al., 2016
Saby et al., 2016
 
fmicb-05-00679
fmicb-05-00679fmicb-05-00679
fmicb-05-00679
 
PP
PPPP
PP
 
Spatial variation in physico chemical parameters of eastern obolo estuary, ni...
Spatial variation in physico chemical parameters of eastern obolo estuary, ni...Spatial variation in physico chemical parameters of eastern obolo estuary, ni...
Spatial variation in physico chemical parameters of eastern obolo estuary, ni...
 
Interrelationship between nutrients and chlorophyll-a in an urban stormwater ...
Interrelationship between nutrients and chlorophyll-a in an urban stormwater ...Interrelationship between nutrients and chlorophyll-a in an urban stormwater ...
Interrelationship between nutrients and chlorophyll-a in an urban stormwater ...
 
Global Journal of Ecology
Global Journal of EcologyGlobal Journal of Ecology
Global Journal of Ecology
 
Clay mineralogy and sediment grain-size variations as climatic signals in sou...
Clay mineralogy and sediment grain-size variations as climatic signals in sou...Clay mineralogy and sediment grain-size variations as climatic signals in sou...
Clay mineralogy and sediment grain-size variations as climatic signals in sou...
 
Geoelectrical investigation
Geoelectrical investigationGeoelectrical investigation
Geoelectrical investigation
 
Wathen 2011 Climatic Changer_Past 2,000 years
Wathen 2011 Climatic Changer_Past 2,000 yearsWathen 2011 Climatic Changer_Past 2,000 years
Wathen 2011 Climatic Changer_Past 2,000 years
 
Assessment of impact of climatic change on groundwater quality around igbokod...
Assessment of impact of climatic change on groundwater quality around igbokod...Assessment of impact of climatic change on groundwater quality around igbokod...
Assessment of impact of climatic change on groundwater quality around igbokod...
 
Raoui s.m rjpbcs 9(2), 1100 1110, 2018
Raoui s.m rjpbcs 9(2), 1100 1110, 2018Raoui s.m rjpbcs 9(2), 1100 1110, 2018
Raoui s.m rjpbcs 9(2), 1100 1110, 2018
 
Article Raoui S.M., rjpbcs 9(2), 1100 1110, 2018
Article Raoui S.M., rjpbcs 9(2), 1100 1110, 2018Article Raoui S.M., rjpbcs 9(2), 1100 1110, 2018
Article Raoui S.M., rjpbcs 9(2), 1100 1110, 2018
 

Thermal Springs Chemistry in South Africa's Lower Orange River Valley

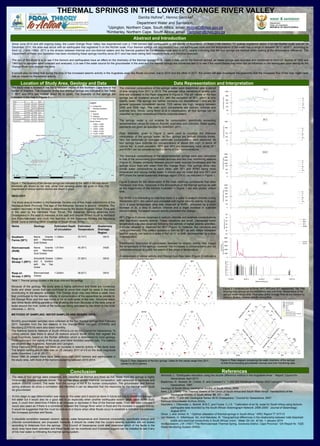
  • 1. THERMAL SPRINGS IN THE LOWER ORANGE RIVER VALLEY Danita Hohne1, Henno Gericke2 Department Water and Sanitation, 1Upington, Northern Cape, South Africa; email: HohneD@dws.gov.za 2Kimberley, Northern Cape, South Africa; email: GerickeH@dws.gov.za Since June 2010 and still ongoing today, the Lower Orange River Valley has experienced over a 1168 tremors and earthquakes in the vicinity of Augrabies. Of these 1168 tremors, 71 quakes registered above 3 on the Richter scale and on 18 December 2011, the area was struck with an earthquake that registered 5 on the Richter scale. Four thermal springs are also located near this earthquake zone and the temperature of the water has a range of between 38°C -46.6°C, according to Kent LE. (1949 /1969). 25°C is the division between thermal and non-thermal waters and the thermal gradient for the Riemvasmaak area is 24°C, clearly indicating that the four springs are thermal when looking at the temperature difference. The Department of Water and Sanitation has been monitoring these springs monthly since 2011 and has been taking field measurements and chemical analyses. The aim of this study is a) to see if the tremors and earthquakes have an effect on the chemistry of the thermal springs, b) to create a data set for the thermal springs, as these springs was recorded and mentioned in Kent LE. reports of 1949 and 1969 but no samples were collected and analysed, c) to see if the water source for the groundwater in the area and the thermal springs are connected and d) to see if the recent floods may have had an influence on the earthquake zone seeing as the Orange River runs through the zone. It should also be noted that during the time of the increased seismic activity in the Augrabies area, two floods occurred, one in 2010 and the other in 2011, this poster will also investigate the possibility that the increased flow of the river might have had an impact on the seismic activity. . . Abstract and Introduction Location of Study Area, Geology and Data Capturing Data Representation and Interpretation Results Conclusion References Akromah, L. ‘Earthquake relocation using the double difference method in the Augrabies Area.” Report; Council for Geoscience; April 2013 Boeleman, R.; Bowels, M.; Cloete, D. and Coetzee FJ. “1:250 000 Metallogenic Series 2820 Upington.” Council for Geoscience, 1997. Geology of South Africa; Geological Socitity of South Africa; 2006 Kent, L.E. (1949) “The Thermal Waters of the Union of South Africa and South West Africa” Transactions of the Geological Society of South Africa, 52, 231 – 264. Moen, HFG. “1:250 000 Geological Series 2818 Onseepkans.” Council for Geoscience, 2007. National Groundwater Archive (NGA) Saunders, I. Ottemoller, L. Brandt, M.B.C. and Fourie. C.J.S. “ Calibration of an ML scale for South Africa using tectonic earthquake data recorded by the South African Seismograph Network: 2006-2009.” Journal of Seismology; August 2012 Oliver. J. and Jonker. N. “ Optimal utilasation of thermal springs in South Africa.” WRC Report TT 577/13 Van Niekerk, H; Silberbauer, MJ. And Maluleke, M. “Geographical differences in the relationship between total dissolved solids and electrical conductivity in South African rivers.” Water SA Vol. 40 No. 1 January 2014 VonBackstorm; J.W. (1957) “The Riemvasmaak Thermal Spring, Gordonia District, Cape Province.” GH Report Nr. 1025 Water Monitoring System (WMS) The data of four springs were presented, one classified as thermal and three as hot. Water from the springs is highly mineralized chloride-sulphate brines. The springs show similar chemical composition, with variances in hardness and sodium chloride content. The water from the springs is not fit for human consumption. The groundwater and thermal spring analyses do show a correlation and therefore it can be assumed that the resources for the thermal water could be groundwater. At this stage no age determination was done on the water and it would be done in future not just to determine the age of the water but it would also be a good test to do especially when another earthquake swarm takes place in the study area. It could then determine if there is an increase or decrease in flow of the thermal water. From the data collected it would also seem as if there is a correlation between the Orange River when in flood and the increase in seismic activity. It would be suggested that this must be looked at in future when other floods occur to establish a definitive link between the increased activities and floods. A plausible correlation between seismic activity, water temperature and chemical composition, specifically sodium and chloride concentrations, are proposed; however, it should be noted that the current seismic activities are not scaled according to distances from the springs. The Council of Geoscience could also determine which of the faults in the study area have been activated and these faults can be monitored and if possible loggers can be installed to see if any of the river water is infiltrating the thermal spring system. . Figure 1: The locations of the thermal springs are indicated by the starts in the map above. Boreholes are shown as red dots, whilst river sampling points are given in blue. The magnitudes of various seismic tremors are shown in greys. GEOLOGY: The study area is located in the Kakamas Terrane one of five major subdivisions of the Namaqua-Natal Province. The age of the Kakamas Terrane is around ~2000Ma. The eastern boundary of the Terrane is determined by the Boven Rugzeer Shear Zone and in the west by the Hartbees River Thrust. The Kakamas Terrane stretches from Onseepkans in the west to Keimoes in the east and around 200km south to Kenhardt and Putsonderwater and north into Namibia. In the Kakamas Terrane the Neusberg Shear Zone is trending NNW (Geology of South Africa, 2006). Because of the geology the study area is highly deformed and there are numerous faults and shear zones that can contribute to areas that might be weak in the crust contributing to the seismic activities. The Orange River may also follow a weak zone that contributes to the seismic activity. A concentration of the epicentres lie parallel to the Orange River and this was found to be on both sides of the river. Structural maps also show faults striking parallel to that all along the river. Because of the wide zone of faults around the river, some of the faults are being activated by the strain in the crust (Akromah, L. 2013). Table 1: Thermal springs located in the study area and the geology METHODS OF SAMPLING: WATER SAMPLES AND SEISMIC DATA : Monthly groundwater samples were collected at the four thermal springs from February 2011. Samples from the two stations in the Orange River Upington (D7H005) and Neusberg (D7H014) were also taken monthly. The National Seismic Network of South Africa is run by the Council for Geoscience. To collect seismic data there is about 29 stations around South Africa that register the local magnitude, based on the Richter definition which is determined by local geology. Three stations in the vicinity of the study area have recorded seismic data. The stations are situated near Augrabies, Keimoes and Upington. Since February 2010 there has been an increase in seismic activity in the study area. The largest earthquake to date was on 25 January 2011 of 4.9 on the local magnitude scale (Saunders, I. et al. 2012). Since 1990 till present there have been more than 2500 tremors and earthquakes in the study area, with most of the tremors occurring between 2010-2014. The chemical compositions of the springs’ water were determined over a period of time ranging from 2011 to 2013. The average value variations in quality over time are indicated in the Piper diagrams in Figure 2. The pH values of the four springs are all clustered around 8.3, with the exception of SF1, which is only slightly lower. The springs are neither corrosive nor depositional – and are for general purposes considered neutral. TDS values are high, ranging between 2200 and 3200 mg/l. The main ionic components are sodium, chloride and sulphate ions; hence, using Bond et al.’s classification, all four springs can be classified as highly mineralized chloride-sulphate waters. The springs’ water is not suitable for consumption; specifically exceeding recommended values for sodium, fluoride, sulphates and chlorides. Water quality standards are given as specified by SANS241-2011. Piper diagrams, given in Figure 2, were used to visualize the chemical composition of the springs’ water. All four springs are sodium chloride brines. Very low carbonate or hydrogen carbonate concentrations were observed. All four springs have sulphate ion concentrations of above 500 mg/l. In terms of cations Na+ is most prevalent. RP1 and RP3 are moderately hard, whilst SF1 and RVM1 can be considered hard in terms of Ca2+ concentrations. The chemical compositions of the aforementioned springs were also compared to that of the surrounding groundwater sources and two river monitoring stations (Figure 4). Greater similarity between ground water sources (boreholes) and the springs occur than with water from the Orange River. The springs show very similar water compositions to each other, with SF1 and RVM1 being more mineralized and having harder water. It should also be noted that only RP1 and RP3 share the same quaternary drainage region (D81E) as indicated in Figure 1. Figure 3 allows for the observation of the main chemical constituents that were monitored over time. Variances in the temperature of the thermal springs as well as the magnitudes of the tremors illustrated in Figure 1 are also plotted versus time. For RVM1 it is interesting to note that there is a spike in sodium chloride during September 2011, this period was preceded with higher seismic activity. In August 2012 a large temperature drop was observed at RVM1, preceded by a slight increase in Si, a drop in sodium chloride and a slight increase in sulphate concentrations. Increased seismic activity preceded this change. RP1 (Figure 3) shows variances in sodium, chloride and sulphate concentrations after significant seismic activity. These variations are small. Decreased water temperature was also observed following the periods of higher seismic activities. A similar situation is observed for RP3 (Figure 3); however, the variations are more pronounced. This pattern appears to hold for SF1 as well; where increased seismic activity can lead to a spike in Na+ or Cl- or both, accompanied by a drop in temperature. Endothermic dissolution of particulates liberated by seismic activity may impact the temperature of the springs; however, the increases in concentrations are not substantial enough to justify the extent of the drops in temperature. A comparison of tremor activity and Orange river flow rates (Figure 3) indicate a possible link between the two. Data Representation Figure 2: Piper diagrams of the four springs. Dates for the values range from 2011 (lighter) to 2013 (darker). Figure 3: Combined plot for RVM, RP1, RP3 and SF1 respectively. Top: Plot showing how various ion concentrations vary with time. Temperature of the spring’s water versus time. Flow rates of the Orange River at two monitoring stations. Bottom: Seismic activity versus time. Name Geology Estimated Depth of circulation Estimated Temperature Quaternary Drainage Region Southern Farms (SF1) Naros Granite and Warmbad Suid Gneiss 1.124km 33.74°C D81D Riemvasmaak (RVM) Naros Granite and Warmbad Suid Gneiss 1.517km 45.35°C D42E Raap en Skraap 1 (RP1) Schuitdrift Gneiss and it borders with the Yas Gneis 1.22km 37.28°C D81E Raap en Skraap 3 (RP3) Riemvasmaak Gneiss 1.242km 36.62°C D81E The study area is located in the North-Western region of the Northern Cape next to the border of Namibia. The locations of the four thermal springs are indicated in the Table 1. RP1 and RP3 are located about 60 m apart. The locations of the springs are indicated in the map in Figure 1. Figure 4: Piper diagram comparing the water chemistry of the springs to that of surrounding groundwater sources and river monitoring data. . Conclusion