1. Kevin Daly, Five Corners Partners, L.P. 385 Woodland Road, Kentfield, CA 94904 415.464.1301
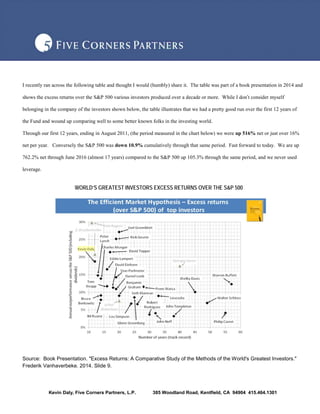
I recently ran across the following table and thought I would (humbly) share it. The table was part of a book presentation in 2014 and
shows the excess returns over the S&P 500 various investors produced over a decade or more. While I don’t consider myself
belonging in the company of the investors shown below, the table illustrates that we had a pretty good run over the first 12 years of
the Fund and wound up comparing well to some better known folks in the investing world.
Through our first 12 years, ending in August 2011, (the period measured in the chart below) we were up 516% net or just over 16%
net per year. Conversely the S&P 500 was down 10.9% cumulatively through that same period. Fast forward to today. We are up
762.2% net through June 2016 (almost 17 years) compared to the S&P 500 up 105.3% through the same period, and we never used
leverage.
WORLD’S GREATEST INVESTORS EXCESS RETURNS OVER THE S&P 500
Source: Book Presentation. "Excess Returns: A Comparative Study of the Methods of the World's Greatest Investors."
Frederik Vanhaverbeke. 2014. Slide 9.
2. Kevin Daly, Five Corners Partners, L.P. 385 Woodland Road, Kentfield, CA 94904 415.464.1301
This presentation is not intended as an offer or solicitation to purchase or sell any commodity or security. Any such offer or solicitation may only be
made to qualified investors through delivery of the Fund’s Private Placement Memorandum and related offering documents which, among other things,
explain the risks of making an investment.
Performance results of the Fund are presented for information purposes only and reflect the impact that material economic and market factors had on
the General Partner’s decision-making process. The Fund makes no implications, warranties, promises, suggestions or guarantees whatsoever, in
whole or in part, that by participating in any investment of or with the Fund you will experience similar investment results and earn any money
whatsoever. The Fund’s un-audited monthly returns include the reinvestment of dividends and other earnings, but are net of accrued management and
performance fees, brokerage commissions and other expenses; however performance of individual investors may vary based upon differing
management fee and incentive allocation arrangements, and the timing of contributions and withdrawals.
References to market or composite indices, benchmarks, or other measures of relative market performance over a specified period of time are provided
for information only. The Fund’s investment program does not mirror any index and the Fund’s returns, volatility, and other results may be materially
different than the returns, volatility, and other results of any index.
Monthly performance numbers were prepared by the General Partner, and have not been compiled, reviewed or audited by an independent
accountant. The information provided is historical and is not a guide to future performance. The performance numbers from 1999 - the Fund’s year of
inception - reflect the General Partner’s estimates of performance for such months. Audited financials are available for every year except 1999.
Investors should be aware that a loss of investment is possible.