Processing & Properties of Floor and Wall Tiles.pptx
Micro-Simulation-Intro-by-Example.ppt
1. Slide - 1
Dr Terry Hinton 6/9/05 UniS - Based on Slides by Micro
Analysis & Design
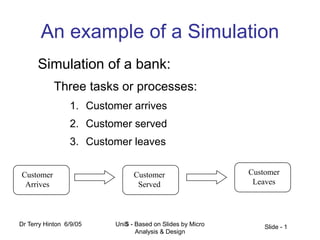
An example of a Simulation
Simulation of a bank:
Three tasks or processes:
1. Customer arrives
2. Customer served
3. Customer leaves
Customer
Arrives
Customer
Served
Customer
Leaves
2. Slide - 2
Dr Terry Hinton 6/9/05 UniS - Based on Slides by Micro
Analysis & Design
An example of a Simulation
Let’s describe task 1
Customer Arrives
• Arrival rate – rate that customers arrive at bank
1 customer every 3 minutes or so
i.e. Inter-arrival rate IAT = 3
• Time period customers can arrive
Bank Hours: 9 to 5
Customer
Arrives
3. Slide - 3
Dr Terry Hinton 6/9/05 UniS - Based on Slides by Micro
Analysis & Design
An example of a Simulation
Task 2
Customer Served
• Time to serve a customer
Approx 6 minutes per customer
Select sample from for example a normal distribution
mean = 6 and standard deviation = 2
Choice of distribution ?
Customer
Served
4. Slide - 4
Dr Terry Hinton 6/9/05 UniS - Based on Slides by Micro
Analysis & Design
An example of a Simulation
Task 3
Customer Leaves
• Record the time customer leaves
• No further interest in customer
Customer
Leaves
5. Slide - 5
Dr Terry Hinton 6/9/05 UniS - Based on Slides by Micro
Analysis & Design
An example of a Simulation
What else affects this flow of customers?
Number of bank staff on duty
Lunchtime crowd
Customer
Arrives
Customer
Served
Customer
Leaves
6. Slide - 6
Dr Terry Hinton 6/9/05 UniS - Based on Slides by Micro
Analysis & Design
An example of a Simulation
What information would be useful to collect?
– Employee utilisation
– Waiting times
– Length of queue
Is there a way to get this information?
Customer
Arrives
Customer
Served
Customer
Leaves
7. Slide - 7
Dr Terry Hinton 6/9/05 UniS - Based on Slides by Micro
Analysis & Design
An example of a Simulation
To performing this analysis without micro-
simulation:
– Only use mean times or averages rates or
– Run the experiment in real life.
– Using micro-simulation every individual is
computed taking account of stochastic behaviour
– hence more realistic analysis possible - e.g
maximum delay not obtained from an average
Customer
Arrives
Customer
Served
Customer
Leaves
8. Slide - 8
Dr Terry Hinton 6/9/05 UniS - Based on Slides by Micro
Analysis & Design
Essentials of
Discrete-Event Micro-Simulation
• Tasks
• Events – start and end of tasks
• Entities
• Entity flow
• Resources
• Queues
• Clock
• Scenario events
9. Slide - 9
Dr Terry Hinton 6/9/05 UniS - Based on Slides by Micro
Analysis & Design
Tasks or processes
• The building block of any discrete-event
simulation
• A task represents a single step in the process
that makes up the discrete event simulation
• A task may require a certain amount of time in
order to execute
• Tasks & Events have three main parts:
– Pre-condition or Release condition
– Start condition or Beginning effect
– End condition or Ending effect
• Events trigger subsequent actions
10. Slide - 10
Dr Terry Hinton 6/9/05 UniS - Based on Slides by Micro
Analysis & Design
Conditions
• Release condition
– The conditions that need to be satisfied so this
task may begin
• Beginning effect
– Things that take place when this task begins
execution
• Ending effect
– Things that take place this task completes
execution
• You are responsible for writing code to
achieve these logical conditions
11. Slide - 11
Dr Terry Hinton 6/9/05 UniS - Based on Slides by Micro
Analysis & Design
Task Flow
• For every discrete-event simulation, there is a
basic entity flow
• Here is an example of the flow of a bank:
• When one task completes the following can
happen to the entity at same simulation time:
– Nothing
– Join a queue
– Another activity starts
– Several activities start simultaneously
Customer
Arrives
Customer
Served
Customer
Leaves
12. Slide - 12
Dr Terry Hinton 6/9/05 UniS - Based on Slides by Micro
Analysis & Design
Resources
• In any process some tasks require a resource to
be available in order to begin execution
– Example: A task may require the availability of a
trained operator in order for that task to begin
• Many processes are constrained by limited
resources
– Without resources, steps in the process may be held
up until those resources are available
– Without resources, the flow of the entities might
change
13. Slide - 13
Dr Terry Hinton 6/9/05 UniS - Based on Slides by Micro
Analysis & Design
Entities
• Entities flow through a simulation and are involved in
the execution of any task
– Examples of entities:
• Customers in a bank
• Cars going through a toll both
• Parts being manufactured
• When an entity arrives at a task the system:
– Checks the release condition and if accepted
– Executes the beginning effect
– Waits the appropriate amount of time (simulation
time or clock time)
– Executes the ending effect
14. Slide - 14
Dr Terry Hinton 6/9/05 UniS - Based on Slides by Micro
Analysis & Design
Queues
• What happens when the release condition of
a task is not met (such as when all bank staff
are busy)?
– The entity must wait in a queue until the release
condition is met
• Sometimes, the behavior of the queue is
important
– FIFO (e.g. queue for bank staff)
– LIFO (e.g. stocked shelves)
– Sorted based on priority (e.g. A&E Department)
Queue
Customer
Served
15. Slide - 15
Dr Terry Hinton 6/9/05 UniS - Based on Slides by Micro
Analysis & Design
The Simulation Clock
• Since we are interested in time based behaviour,
a clock is needed to keep the system in
synchronism
• As events in your simulation occur, the
simulation clock will advance based upon how
long each task or process takes – not fixed small
steps as in continuous dynamic systems
16. Slide - 16
Dr Terry Hinton 6/9/05 UniS - Based on Slides by Micro
Analysis & Design
How a Simulation is Executed
• As a simulation executes, all scheduled
events are kept in an event queue or time line
• The simulation begins by taking the first event
that is scheduled to occur from the event
queue (e.g. start the first task)
• That event may place other events later in the
event queue, ordered of time
• When that event is completed, the simulation
takes the next event from the queue, updates
the clock, and processes that event
17. Slide - 17
Dr Terry Hinton 6/9/05 UniS - Based on Slides by Micro
Analysis & Design
Running a Simulation
Let’s step through a simulation of a bank. Using the
task rules we defined for customer served
• Here are other rules to follow
– Bank is open for 8 hours (480 minutes)
– Customers arrive about every 3 minutes
– It takes around 6 minutes to serve a customer
– We have 2 bank staff on duty
18. Slide - 18
Dr Terry Hinton 6/9/05 UniS - Based on Slides by Micro
Analysis & Design
Running a Simulation
Using this diagram below let’s step through
this simulation
Time Task Staff People Waiting
0 Customer Arrives 2 0
Customer
Arrives
Customer
Leaves
Queue
Customer
Served
19. Slide - 19
Dr Terry Hinton 6/9/05 UniS - Based on Slides by Micro
Analysis & Design
Simulation
What else affects this flow of customers?
– Number of bank staff on duty
– Lunchtime crowd
Customer
Arrives
Customer
Served
Customer
Leaves
20. Slide - 20
Dr Terry Hinton 6/9/05 UniS - Based on Slides by Micro
Analysis & Design
Scenario Events
• What happens if we want to:
– Model customers arriving faster at lunchtime?
– Put another bank teller on duty at lunchtime?
• Events that don’t necessarily fall into any one
task can be defined as a scenario events
• Scenario events are defined by
– The time when the scenario event occurs
– What happens