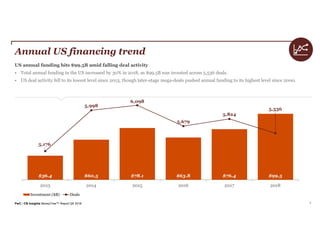
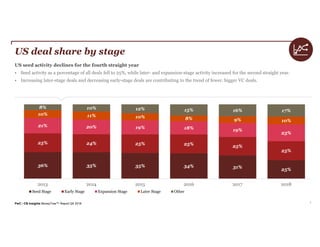
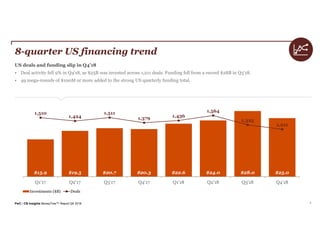
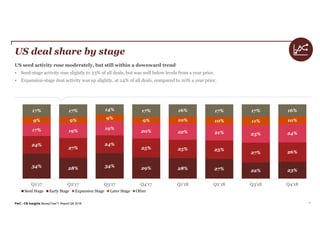
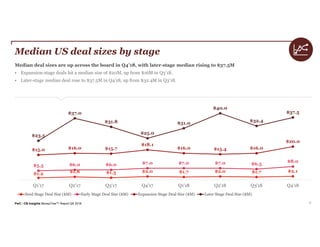
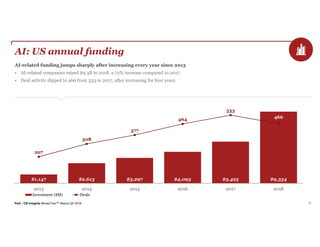
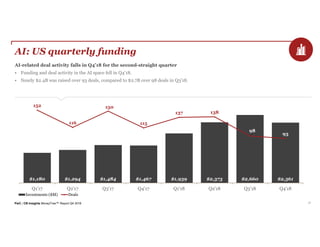
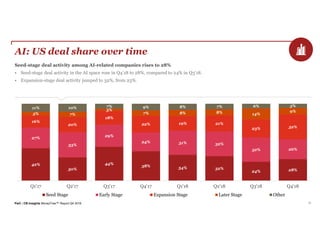
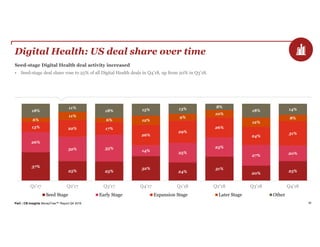
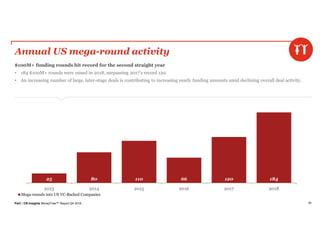
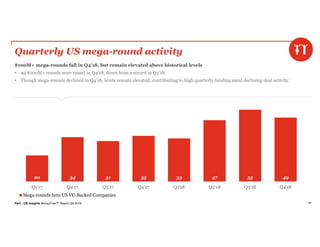
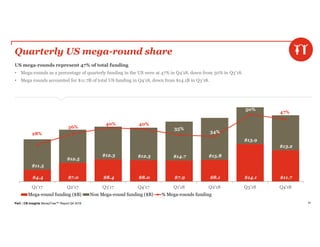
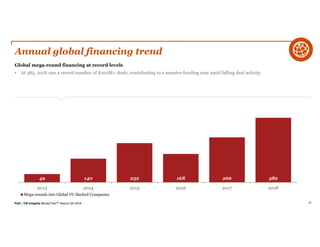
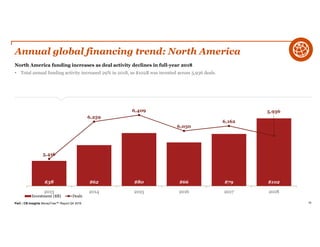
PwC / CB Insights
MoneyTree™ Report
Q4 2018
PwC | CB Insights MoneyTree™ Report Q4 2018 2
Executive summary
$100M+ deals drive 2018 global funding to highest levels
since 2000, with US startups raising $99.5B over 5,536
deals.
Annual US funding nears record amid falling deal activity:
US VC funding jumped to $99.5B, the highest yearly funding level
since 2000, over 5,536 transactions, the lowest level of deal activity
since 2013.
$100M mega-rounds drive funding higher: Driving the trend
toward fewer, bigger deals, US companies raised a record number of
mega-rounds in 2018, with 184 $100M+ funding rounds.
Seed-stage deal share continues to fall in 2018: Seed-stage
deal share fell to 25%, the third consecutive yearly decline, as larger,
later-stage deals take up more US funding.
US sees a record number of new unicorns: 53 US VC-backed
companies saw their valuation rise to over $1B in 2018 — a record
number of new unicorns.
Artificial Intelligence funding peaks in Q3’18: AI-related
funding declined in Q4’18 to $2.4B, from $2.7B in Q3’18, after
increasing in the first three quarters of 2018.
2018 Global funding surges 21% compared to 2017,
approaching 2000 record.
Global funding hits $207B: Total annual global VC funding
increased by 21% to $207B. Deal activity rose 10%, to 14,247
transactions.
Asia funding increases moderately amid surging deal
activity: Asia was an exception to falling global deal activity, with
5,066 transactions in 2018, a 42% increase compared to 2017.
Funding in the region increased by 11%, to $80.9B.
San Francisco funding hits historical record in 2018: VC
funding in San Francisco jumped by 55% in 2018 to $28B, from $18B
in 2017. Quarter-over-quarter, however, Q4’18 saw a decline in
funding (-17%) and deal activity (-5%).
New York Metro funding sets historical record in 2018: VC
funding in the New York Metro area reached $13B in 2018, up from
$12B in 2017 which also set the record. Quarter-over-quarter,
however, funding fell significantly in Q4’18, falling 65% to $2.1B,
from a massive $5.8B in Q3’18. Deal activity fell slightly, to 160
transactions in Q4’18, from 163 in Q3’18.
Note: Report includes all rounds to VC-backed companies. For a detailed brief on
methodology, please reference page 98 of this report.
PwC | CB Insights MoneyTree™ Report Q4 2018
Table of contents
3
4 US Overall Trends
73 Global Trends
56 US Movers and Shakers
37 US Places
16 US Sectors
US Overall Trends
01
4
5
In 2018
UNITED
STATES
VC-backed companies raised
$99.5B
PwC | CB Insights MoneyTree™ Report Q4 2018 6
Annual US financing trend
US annual funding hits $99.5B amid falling deal activity
• Total annual funding in the US increased by 30% in 2018, as $99.5B was invested across 5,536 deals.
• US deal activity fell to its lowest level since 2013, though later-stage mega-deals pushed annual funding to its highest level since 2000.
$36.4 $60.5 $78.1 $63.8 $76.4 $99.5
5,176
5,998
6,098
5,679
5,824
5,536
2013 2014 2015 2016 2017 2018
Investment ($B) Deals
PwC | CB Insights MoneyTree™ Report Q4 2018 7
US deal share by stage
US seed activity declines for the fourth straight year
• Seed activity as a percentage of all deals fell to 25%, while later- and expansion-stage activity increased for the second straight year.
• Increasing later-stage deals and decreasing early-stage deals are contributing to the trend of fewer, bigger VC deals.
36% 35% 35% 34% 31% 25%
25% 24% 25% 25% 25%
25%
21% 20% 19% 18% 19%
23%
10% 11% 10% 8% 9% 10%
8% 10% 12% 15% 16% 17%
2013 2014 2015 2016 2017 2018
Seed Stage Early Stage Expansion Stage Later Stage Other
8
In Q4 2018
UNITED
STATES
VC-backed companies raised
$25.0B
PwC | CB Insights MoneyTree™ Report Q4 2018 9
8-quarter US financing trend
US deals and funding slip in Q4’18
• Deal activity fell 9% in Q4’18, as $25B was invested across 1,211 deals. Funding fell from a record $28B in Q3’18.
• 49 mega-rounds of $100M or more added to the strong US quarterly funding total.
$15.9 $19.5 $20.7 $20.3 $22.6 $24.0 $28.0 $25.0
1,510
1,424
1,511
1,379 1,436
1,564
1,325
1,211
Q1'17 Q2'17 Q3'17 Q4'17 Q1'18 Q2'18 Q3'18 Q4'18
Investments ($B) Deals
PwC | CB Insights MoneyTree™ Report Q4 2018 10
US financing trends
”
2018 was a phenomenal year for US venture capital, with $99.5B
invested --- a record-breaking 55 unicorn births, 184 mega-rounds,
and funding levels at their highest since 2000 ($119.6B).
“
— Tom Ciccolella, Partner, US Ventures Leader
at PwC
PwC | CB Insights MoneyTree™ Report Q4 2018 11
US deal share by stage
US seed activity rose moderately, but still within a downward trend
• Seed-stage activity rose slightly to 23% of all deals, but was well below levels from a year prior.
• Expansion-stage deal activity was up slightly, at 24% of all deals, compared to 20% a year prior.
34% 28% 34% 29% 28% 27% 22% 23%
24%
27%
24%
25% 25% 25%
27% 26%
17% 19%
19%
20% 22% 21% 23% 24%
9% 9% 9%
9% 10% 10% 11% 10%
17% 17% 14% 17% 16% 17% 17% 16%
Q1'17 Q2'17 Q3'17 Q4'17 Q1'18 Q2'18 Q3'18 Q4'18
Seed Stage Early Stage Expansion Stage Later Stage Other
PwC | CB Insights MoneyTree™ Report Q4 2018 12
Median US deal sizes by stage
Median deal sizes are up across the board in Q4’18, with later-stage median rising to $37.5M
• Expansion-stage deals hit a median size of $20M, up from $16M in Q3’18.
• Later-stage median deal rose to $37.5M in Q4’18, up from $32.4M in Q3’18.
$1.2 $1.8 $1.3 $2.0 $1.7 $2.0 $1.7 $2.1
$5.5 $6.0 $6.0 $7.0 $7.0 $7.0 $6.5
$8.0
$15.0 $16.0 $15.7
$18.1
$16.0 $15.4 $16.0
$20.0
$23.5
$37.0
$31.8
$25.0
$31.0
$40.0
$32.4
$37.5
Q1'17 Q2'17 Q3'17 Q4'17 Q1'18 Q2'18 Q3'18 Q4'18
Seed Stage Deal Size ($M) Early Stage Deal Size ($M) Expansion Stage Deal Size ($M) Later Stage Deal Size ($M)
PwC | CB Insights MoneyTree™ Report Q4 2018 13
US corporate deal participation
Corporate deal participation steady at 28% of all VC deals
• Corporate participation in US VC deals was at 28% in Q4’18, down 1% compared to Q3’18.
• Compared to a year prior, corporate participation was up 5% at year-end 2018.
77% 75% 77% 77% 76% 75% 71% 72%
23% 25% 23% 23% 24% 25% 29% 28%
Q1'17 Q2'17 Q3'17 Q4'17 Q1'18 Q2'18 Q3'18 Q4'18
Other Investors Corp / CVC Deal Participation
PwC | CB Insights MoneyTree™ Report Q4 2018 14
US first venture financing share (Quarterly)
First venture rounds as a percentage of all deal activity flat in Q4’18
• In Q4’18, 34% of all US deals were first venture financings.
• Throughout 2018, first venture rounds stayed in the 33-36% range of all deal activity.
68% 64% 67% 65% 67% 64% 66% 66%
32%
36% 33% 35% 33%
36% 34% 34%
Q1'17 Q2'17 Q3'17 Q4'17 Q1'18 Q2'18 Q3'18 Q4'18
Other % of Total First VC-Backed Deals
PwC | CB Insights MoneyTree™ Report Q4 2018 15
US first venture financing share (Annual)
Annual proportion of first venture rounds flat in 2018
• In 2018, first venture rounds accounted for 34% of all deals, flat compared to 2017.
68% 66% 66% 67% 66% 66%
32% 34% 34% 33% 34% 34%
2013 2014 2015 2016 2017 2018
Other % of Total First VC-Backed Deals
US Sectors
02
PwC | CB Insights MoneyTree™ Report Q4 2018
51 Deals
111 Deals
150 Deals
162 Deals
540 Deals
17
US deals and funding by Top 5 sectors, Q4’18
$9.1B
Invested
$4.0B
Invested
$3.5B
Invested
$3.0B
Invested
$382M
Invested
Internet
Mobile & Telecommunications
Software (Non-Internet / Mobile)
Consumer Products & Services
Healthcare
PwC | CB Insights MoneyTree™ Report Q4 2018 18
US deal share by sector
Internet deal share up slightly at 45%; Healthcare falls to 13% of all US VC deals
• Internet deal share was up slightly at 45% of all deals, compared to 44% in Q3’18.
• Healthcare deal share fell to 13%, down from 15% in Q3’18.
43% 44% 47% 42% 46% 43% 44% 45%
15% 13%
14%
15%
13% 15% 15% 13%
14% 15%
13%
11%
12% 12% 12% 12%
6% 8% 8%
8%
8% 9% 8% 9%
3% 5% 4%
6%
4% 5% 3% 4%
18% 15% 15% 18% 16% 16% 18% 16%
Q1'17 Q2'17 Q3'17 Q4'17 Q1'18 Q2'18 Q3'18 Q4'18
Internet Healthcare Mobile & Telecommunications Software (non-internet/mobile) Consumer Products & Services Other
PwC | CB Insights MoneyTree™ Report Q4 2018 19
Artificial Intelligence
PwC | CB Insights MoneyTree™ Report Q4 2018 20
AI: US annual funding
$1,147 $2,613 $3,297 $4,093 $5,425 $9,334
207
308
377
464
533
466
2013 2014 2015 2016 2017 2018
Investment ($M) Deals
AI-related funding jumps sharply after increasing every year since 2013
• AI-related companies raised $9.3B in 2018, a 72% increase compared to 2017.
• Deal activity dipped to 466 from 533 in 2017, after increasing for four years.
PwC | CB Insights MoneyTree™ Report Q4 2018 21
AI: US quarterly funding
AI-related deal activity falls in Q4’18 for the second-straight quarter
• Funding and deal activity in the AI space fell in Q4’18.
• Nearly $2.4B was raised over 93 deals, compared to $2.7B over 98 deals in Q3’18.
$1,180 $1,294 $1,484 $1,467 $1,939 $2,373 $2,660 $2,361
152
116
150
115
137 138
98
93
Q1'17 Q2'17 Q3'17 Q4'17 Q1'18 Q2'18 Q3'18 Q4'18
Investments ($M) Deals
PwC | CB Insights MoneyTree™ Report Q4 2018 22
AI: US deal share over time
Seed-stage deal activity among AI-related companies rises to 28%
• Seed-stage deal activity in the AI space rose in Q4’18 to 28%, compared to 24% in Q3’18.
• Expansion-stage deal activity jumped to 32%, from 23%.
42%
30%
44%
38% 34% 32%
24% 28%
27%
33%
29%
24% 31% 32%
32% 26%
16%
20%
18%
22% 19% 21%
23% 32%
5% 7%
3%
7% 8% 8% 14%
9%
11% 10% 7% 9% 8% 7% 6% 5%
Q1'17 Q2'17 Q3'17 Q4'17 Q1'18 Q2'18 Q3'18 Q4'18
Seed Stage Early Stage Expansion Stage Later Stage Other
PwC | CB Insights MoneyTree™ Report Q4 2018 23
AI: Top states by deals
53 deals
$1,917M Invested
1. CA
13 deals
$247M Invested
10 deals
$110M Invested
3 deals
$10M Invested
3 deals
$9M Invested
2. MA
3. NY
4. TX
4. WA
PwC | CB Insights MoneyTree™ Report Q4 2018 24
AI: Largest US deals of Q4’18
Company Location Sector Industry
Stage of
Funding
$ Value
of Deal
Select Investors
Zymergen Emeryville, CA
Software (non-
internet /
mobile)
Healthcare $400M
Data Collective, SoftBank Group, True
Ventures, Two Sigma Ventures
Automation Anywhere San Jose, CA
Software (non-
internet /
mobile)
Scientific,
Engineering
Software
$300M SoftBank Group
Tanium Emeryville, CA
Software (non-
internet /
mobile)
Security Software $200M
Adage Capital Management, Baillie Gifford
& Co., Wellington Management
ZipRecruiter Santa Monica, CA Internet Internet Software $156M
Institutional Venture Partners, Wellington
Management
DataRobot Boston, MA Internet Internet Software $100M
DFJ Growth Fund, Intel Capital, New
Enterprise Associates
Expansion
Stage
Early
Stage
Later
Stage
Seed
Stage
PwC | CB Insights MoneyTree™ Report Q4 2018 25
Digital Health
PwC | CB Insights MoneyTree™ Report Q4 2018 26
Digital Health: US annual funding
Digital Health funding jumps by 21% in 2018
• Digital Health companies raised $8.6B in 2018, a 21% jump compared to 2017.
• Deal activity was up slightly, at 477 deals in 2018.
$2,015 $4,672 $4,556 $5,482 $7,100 $8,603
375
476
542 511
476
477
2013 2014 2015 2016 2017 2018
Investment ($M) Deals
PwC | CB Insights MoneyTree™ Report Q4 2018 27
Digital Health: US quarterly funding
Digital Health-related companies see funding drop by 41%
• US Digital Health companies raised $1.9B in Q4’18, a 41% drop compared to Q3’18.
• Deal activity also declined, falling to 83 deals from 123 in Q3’18.
$1,800 $2,886 $1,170 $1,243 $1,858 $1,742 $3,151 $1,852
122
142
121
91
114
157
123
83
Q1'17 Q2'17 Q3'17 Q4'17 Q1'18 Q2'18 Q3'18 Q4'18
Investments ($M) Deals
PwC | CB Insights MoneyTree™ Report Q4 2018 28
Digital Health: US deal share over time
Seed-stage Digital Health deal activity increased
• Seed-stage deal share rose to 25% of all Digital Health deals in Q4’18, up from 20% in Q3’18.
37%
25% 25%
32%
24%
31%
20%
25%
26%
32% 35%
14%
25%
25%
27% 20%
13% 22% 17%
26%
29%
26%
24%
31%
6%
11%
6% 12%
9%
10%
12%
8%
18%
11%
18% 15% 13% 8%
18% 14%
Q1'17 Q2'17 Q3'17 Q4'17 Q1'18 Q2'18 Q3'18 Q4'18
Seed Stage Early Stage Expansion Stage Later Stage Other
PwC | CB Insights MoneyTree™ Report Q4 2018 29
Digital Health: Top states by deals
27 deals
$277 Invested
1. CA
12 deals
$106M Invested
11 deals
$224M Invested
5 deals
$81M Invested
3. NY
2. MA
4. TX
PwC | CB Insights MoneyTree™ Report Q4 2018 30
Digital Health: Largest US deals of Q4’18
Company Location Sector Industry
Stage of
Funding
$ Value
of Deal
Select Investors
Zymergen Emeryville, CA
Software (non-
internet/mobile)
Healthcare
Software
$400M
Data Collective, SoftBank Group, True
Ventures, Two Sigma Ventures
SmileDirectClub Nashville, TN Internet
Internet
Software &
Services
$380M
Clayton Dubilier & Rice, Kleiner Perkins
Caufield & Byers, Spark Capital
Bright Health Minneapolis, MN Financial Insurance $200M
Bessemer Venture Partners, Cross Creek
Advisors, Declaration Partners
Schrodinger New York, NY
Software (non-
internet/mobile)
Healthcare
Software
$100M Qiming Venture Partners; Undisclosed
Investors
HNI Healthcare Austin, TX
Software (non-
internet/mobile)
Healthcare
Software $65M CRG
Expansion
Stage
Early
Stage
Later
Stage
Seed
Stage
PwC | CB Insights MoneyTree™ Report Q4 2018 31
Fintech
PwC | CB Insights MoneyTree™ Report Q4 2018 32
Fintech: US annual funding
Fintech-related funding jumps 38% in 2018 amid rising deal activity
• Total annual funding to US Fintech companies jumped 38% in 2018 to over $11B, the second straight yearly increase.
• Deal activity rose to 627 transactions, up from 571 in 2017.
$2,441 $5,689 $8,802 $5,769 $7,983 $10,988
406
506
578 558 571
627
2013 2014 2015 2016 2017 2018
Investment ($B) Deals
PwC | CB Insights MoneyTree™ Report Q4 2018 33
Fintech: US quarterly funding
Fintech funding and deal activity fall for the second straight quarter
• Fintech-related funding fell 13% in Q4’18 to $2.5B, down from $2.9B in Q3’18.
• Deal activity fell for the second straight quarter, to 123 transactions in Q4’18.
$1,473 $2,070 $2,037 $2,404 $2,278 $3,250 $2,920 $2,539
146 140 145 140
185
167
152
123
Q1'17 Q2'17 Q3'17 Q4'17 Q1'18 Q2'18 Q3'18 Q4'18
Investments ($M) Deals
PwC | CB Insights MoneyTree™ Report Q4 2018 34
Fintech: US deal share over time
Seed-stage deal share increases slightly in Q4’18
• Seed-stage Fintech companies accounted for 25% of all deals in the space in Q4’18, up from 22% in Q3’18.
38% 34% 36% 34% 35%
24% 22% 25%
18% 29% 19% 26% 25%
30% 32% 28%
18%
18%
22%
21% 20%
20% 24% 25%
11%
9% 13% 9% 10%
11%
11% 9%
14% 11% 10% 9% 11% 15% 12% 13%
Q1'17 Q2'17 Q3'17 Q4'17 Q1'18 Q2'18 Q3'18 Q4'18
Seed Stage Early Stage Expansion Stage Later Stage Other
PwC | CB Insights MoneyTree™ Report Q4 2018 35
Fintech: Top states by deals
53 deals
$1,518M Invested
1. CA
25 deals
$189M Invested
10 deals
$400M Invested
2. NY
3. MA
PwC | CB Insights MoneyTree™ Report Q4 2018 36
Fintech: Largest US deals of Q4’18
Company Location Sector Industry
Stage of
Funding
$ Value
of Deal
Select Investors
Coinbase San Francisco, CA Internet
Internet
Software &
Services
$300M
Andreessen Horowitz, Polychain Capital,
Tiger Global Management, Wellington
Management, Y Combinator
Devoted Health Waltham, MA Healthcare
Medical
Facilities &
Services
$300M Andreessen Horowitz, F-Prime Capital,
Premji Invest, Uprising, Venrock
Plaid Technologies San Francisco, CA Internet
Internet
Software &
Services
$250M
Andreessen Horowitz, Goldman Sachs
Investment Partners, Index Ventures, Mary
Meeker, New Enterprise Associates, Spark
Capital
Bright Health Minneapolis, MN Financial Insurance $200M
Bessemer Venture Partners, Cross Creek
Advisors, Declaration Partners
Earnin Palo Alto, CA
Mobile &
Telecommunicat
ions
Mobile
Software &
Services
$125M
Andreessen Horowitz, Coatue Management,
DST Global, March Capital Partners, Matrix
Partners, Ribbit Capital, Spark Capital
Expansion
Stage
Early
Stage
Later
Stage
Seed
Stage
US Places
03
PwC | CB Insights MoneyTree™ Report Q4 2018
$6,754M
38
US top five regions of Q4’18 by deals
104
123
139
160
241San Francisco (N. Bay Area)
New York Metro
Silicon Valley (S. Bay Area)
New England
Midwest
$2,057M
$5,271M
$2,372M
$794M
PwC | CB Insights MoneyTree™ Report Q4 2018 39
US: Q4’18 funding by region
Total US:
$25.0B
SF (N. Bay Area)
$6,754M
Northwest
$348M
AK/HI/PR
$1M
North
Central
$324M
Southeast
$2,210M
CO
$244M
Texas
$429M
New England
$2,372M
Midwest
$794M
NewYorkMetro
$2,057M
Upstate
NY
$151M
DC/Metroplex
$692MLA/Orange County
$1,976M
PhiladelphiaMetro
$122M
SiliconValley(S. Bay Area)
$5,271M
San Diego
$713M
Sacramento/N. Cal
$19M
Southwest
$406M
South Central
$38M
PwC | CB Insights MoneyTree™ Report Q4 2018 40
US: Q4’18 deals by region
SF (N. Bay Area)
241 Deals
Northwest
48 Deals
AK/HI/PR
1 Deal
North
Central
20 Deals
Southeast
69 Deals
CO
37 Deals
Texas
50 Deals
New England
123 Deals
Midwest
104 Deals
NewYorkMetro
160 Deals
Upstate
NY
4 Deals
DC/Metroplex
22 DealsLA/Orange County
94 Deals
Philadelphia
Metro
16 Deals
SiliconValley(S. Bay Area)
139 Deals
San Diego
30 Deals
Sacramento/N. Cal
3 Deals
Southwest
28 Deals
South Central
14 Deals
Total US:
1,211 Deals
PwC | CB Insights MoneyTree™ Report Q4 2018 41
Annual financing trend: San Francisco (North Bay Area)
San Francisco funding jumped by 55% in 2018
• Funding activity in San Francisco jumped by 55% in 2018, rising to a historical record of $28B.
• Deal activity declined to 1,088 transactions, compared to 1,120 in 2017; the last six years being the most active years ever
$7 $16 $26 $19 $18 $28
1,018
1,255 1,287
1,180
1,120
1,088
2013 2014 2015 2016 2017 2018
Investment ($B) Deals
PwC | CB Insights MoneyTree™ Report Q4 2018 42
8-quarter financing trend: San Francisco (North Bay Area)
Q4’18 funding, deal activity decline in San Francisco
• San Francisco companies saw VC funding decline sharply in Q4’18, falling 17% to $6.8B.
• Deal activity also fell in Q4’18, to 241, from 254 in Q3’18.
$3,904 $4,279 $3,918 $5,623 $6,663 $5,973 $8,142 $6,754
307
274
290
249
293 300
254
241
Q1'17 Q2'17 Q3'17 Q4'17 Q1'18 Q2'18 Q3'18 Q4'18
Investments ($M) Deals
PwC | CB Insights MoneyTree™ Report Q4 2018 43
Annual financing trend: New York Metro
New York funding ticks up, deal activity declines
• Funding to New York-based VC-backed companies increased slightly to $13B, the biggest funding year ever.
• Deals declined to 735, from 841 in 2017 which set the all-time record.
$4 $6 $9 $9 $12 $13
672
795 823 795
841 735
2013 2014 2015 2016 2017 2018
Investment ($B) Deals
PwC | CB Insights MoneyTree™ Report Q4 2018 44
8-quarter financing trend: New York Metro
Q4’18 funding declines sharply in New York
• New York Metro-based companies saw funding fall by 65% in Q4’18 to $2.1B, following a massive Q3’18.
• Deal activity fell to 160 transactions over the same time period.
$1,823 $2,937 $4,526 $2,978 $2,653 $2,812 $5,807 $2,057
208
196
220 217
203 209 163
160
Q1'17 Q2'17 Q3'17 Q4'17 Q1'18 Q2'18 Q3'18 Q4'18
Investments ($M) Deals
PwC | CB Insights MoneyTree™ Report Q4 2018 45
Annual financing trend: Silicon Valley (South Bay Area)
Funding to Silicon Valley companies ticks up in 2018
• Funding to Silicon Valley-based VC-backed companies increased in 2018, as $18B the biggest year since 2000.
• Deals declined by 5% to 645 in 2018, from 682 in 2017.
$7 $12 $10 $8 $13 $18
702
798 775
681 682
645
2013 2014 2015 2016 2017 2018
Investment ($B) Deals
PwC | CB Insights MoneyTree™ Report Q4 2018 46
8-quarter financing trend: Silicon Valley (South Bay Area)
Silicon Valley funding increases by 7% in Q4’18, as deal activity falls slightly
• Deals activity fell to 139 in Q4’18, down from 144 in Q3’18.
• Total quarterly funding increased to $5.3B in Q4’18, up from $4.9B in Q3’18.
$3,090 $4,216 $2,448 $2,965 $3,901 $3,939 $4,922 $5,271
174
158
175 175 179 183
144
139
Q1'17 Q2'17 Q3'17 Q4'17 Q1'18 Q2'18 Q3'18 Q4'18
Investments ($M) Deals
PwC | CB Insights MoneyTree™ Report Q4 2018 47
Annual financing trend: New England
New England funding activity increases for the second straight year
• Funding to New England-based VC-backed companies hit $11B in 2018, as deals increased to 536 transactions.
• 2018 was the biggest year of investments for New England since 2000.
$4 $6 $7 $7 $8 $11
526
571
587
519
526
536
2013 2014 2015 2016 2017 2018
Investment ($B) Deals
PwC | CB Insights MoneyTree™ Report Q4 2018 48
8-quarter financing trend: New England
New England deal activity, funding decline for the second straight quarter
• New England deal activity sunk to 123 transactions, while total funding decreased to $2.4B.
$2,084 $1,548 $1,965 $2,170 $2,748 $3,111 $2,457 $2,372
145
127
132
122
133
147
133
123
Q1'17 Q2'17 Q3'17 Q4'17 Q1'18 Q2'18 Q3'18 Q4'18
Investments ($M) Deals
PwC | CB Insights MoneyTree™ Report Q4 2018 49
Annual financing trend: LA/Orange County
Full year funding in LA/Orange County increases, deal activity down
• Deal activity decreased to 419 transactions in LA/Orange County from 2017’s level (432) which was the most active year since 2000.
• 2018 was the biggest year of investment funding ($6B) for LA/Orange County since 2000.
$2 $4 $6 $5 $5 $6
325
360
414
367
432
419
2013 2014 2015 2016 2017 2018
Investment ($B) Deals
PwC | CB Insights MoneyTree™ Report Q4 2018 50
8-quarter financing trend: LA/Orange County
LA/Orange County funding jumps in Q4’18
• LA/Orange County funding jumped by 130% in Q4’18 to $2B.
• Deal activity fell slightly from 97 transactions in Q3’18 to 94 in Q4’18.
$1,065 $1,065 $1,615 $959 $1,789 $1,775 $858 $1,976
98
111
120
103
118
110
97
94
Q1'17 Q2'17 Q3'17 Q4'17 Q1'18 Q2'18 Q3'18 Q4'18
Investments ($M) Deals
PwC | CB Insights MoneyTree™ Report Q4 2018 51
Annual financing trend: DC/Metroplex
Deal and dollar activity down in 2018 in DC/Metroplex
• Total annual funding to DC/Metroplex-based VC-backed companies declined to $2B in 2018, from $3B in 2017.
• Deal activity declined to 178, from 209 in 2017.
$1 $1 $3 $3 $3 $2
189
249
225
221
209
178
2013 2014 2015 2016 2017 2018
Investment ($B) Deals
PwC | CB Insights MoneyTree™ Report Q4 2018 52
8-quarter financing trend: DC/Metroplex
Funding in DC/Metroplex jumps amid falling deal activity
• $692M was raised in the DC/Metroplex in Q4’18, up from $571M in Q3’18.
• Deal activity fell for the second straight quarter to 22 transactions.
$486 $420 $311 $1,290 $525 $557 $571 $692
63
45 45
56
49
62
45
22
Q1'17 Q2'17 Q3'17 Q4'17 Q1'18 Q2'18 Q3'18 Q4'18
Investments ($M) Deals
PwC | CB Insights MoneyTree™ Report Q4 2018 53
US: Top 10 states of Q4’18 by deals
509 deals
$14,756M
155 deals
$2,054M
111 deals
$2,313M
50 deals
$429M
37 deals
$244MM
1. CA
2. NY
3. MA
4. TX
5. CO
6. WA 36 deals
$252M
33 deals
$427M
25 deals
$193M
23 deals
$155M
20 deals
$58M
7. IL
8. PA
9. FL
9. OH
PwC | CB Insights MoneyTree™ Report Q4 2018 54
Q4’18 Regional comparison: Deals CA vs. NY vs. MA
Deal activity down across the board in CA, NY, and MA
• Deal activity declined in all three regions in Q4’18.
• California and New York saw deal activity below levels a year ago in Q4’17.
623
582
626
567
617 646
531
509
205 185
209 206 202 204
156 155
127 113 116 110 118 125 117 111
Q1'17 Q2'17 Q3'17 Q4'17 Q1'18 Q2'18 Q3'18 Q4'18
California New York Massachusetts
PwC | CB Insights MoneyTree™ Report Q4 2018 55
Q4’18 Regional comparison: Financing CA vs. NY vs. MA
Q4’18 funding down across the board in CA, NY, and MA
• Funding fell in Q4’18 in CA, NY, and MA.
• Compared to Q4’17, only California saw a year-over-year increase in funding, at $14.8B in Q4’18, compared to $9.9B in Q4’17.
$8.3
$10.0
$8.6
$9.9
$12.8 $12.5
$14.9 $14.8
$1.8
$2.6
$4.4
$2.9 $2.4 $2.8
$5.7
$2.1$2.0
$1.5 $1.5
$2.1
$2.7 $3.0
$2.4 $2.3
Q1'17 Q2'17 Q3'17 Q4'17 Q1'18 Q2'18 Q3'18 Q4'18
California New York Massachusetts
US Movers & Shakers
04
PwC | CB Insights MoneyTree™ Report Q4 2018 57
Mega-rounds
”
There certainly continues to be a healthy availability of funds and
appetite for investment, while the trend of fewer, bigger deals
persists.
“
— Tom Ciccolella, Partner, US Ventures Leader
at PwC
PwC | CB Insights MoneyTree™ Report Q4 2018 58
Annual US mega-round activity
$100M+ funding rounds hit record for the second straight year
• 184 $100M+ rounds were raised in 2018, surpassing 2017’s record 120.
• An increasing number of large, later-stage deals is contributing to increasing yearly funding amounts amid declining overall deal activity.
25 80 110 66 120 184
2013 2014 2015 2016 2017 2018
Mega-rounds into US VC-Backed Companies
PwC | CB Insights MoneyTree™ Report Q4 2018 59
Largest US deals of Q4’18
Company Location Sector Industry
Stage of
Funding
$ Value
of Deal
Select Investors
Epic Games Cary, NC
Software (non-
internet/mobile)
Gaming $1,250M
aXiomatic, ICONIQ Capital, Kleiner Perkins
Caufield & Byers, Kohlberg Kravis Roberts &
Co., Lightspeed Venture Partners
View Milpitas, CA Industrial Construction $1,100M Softbank Group
Instacart San Francisco, CA
Mobile &
Telecommunications
Mobile Commerce $600M D1 Capital Partners
Snowflake
Computing
San Mateo, CA Internet
Internet Software &
Services
$450M
Altimeter Capital, Capital One Growth
Ventures, Madrona Venture Group,
Meritech Capital Partners
Relay Therapeutics Cambridge, MA Healthcare Drug Discovery $400M
Alexandria Venture Investments, BVF
Partners, Casdin Capital, D.E. Shaw
Research
Zymergen Emeryville, CA
Software (non-
internet/mobile)
Healthcare
Software
$400M
Data Collective, SoftBank Group, True
Ventures, Two Sigma Ventures
Expansion
Stage
Early
Stage
Later
Stage
Seed
Stage
PwC | CB Insights MoneyTree™ Report Q4 2018 60
Quarterly US mega-round activity
$100M+ mega-rounds fall in Q4’18, but remain elevated above historical levels
• 49 $100M+ rounds were raised in Q4’18, down from a record in Q3’18.
• Though mega-rounds declined in Q4’18, levels remain elevated, contributing to high quarterly funding amid declining deal activity.
20 34 31 35 33 47 55 49
0.0
10.0
20.0
30.0
40.0
50.0
60.0
Q1'17 Q2'17 Q3'17 Q4'17 Q1'18 Q2'18 Q3'18 Q4'18
Mega-rounds Into US VC-Backed Companies
PwC | CB Insights MoneyTree™ Report Q4 2018 61
Quarterly US mega-round share
US mega-rounds represent 47% of total funding
• Mega-rounds as a percentage of quarterly funding in the US were at 47% in Q4’18, down from 50% in Q3’18.
• Mega rounds accounted for $11.7B of total US funding in Q4’18, down from $14.1B in Q3’18.
$4.4 $7.0 $8.4 $8.0 $7.9 $8.1 $14.1 $11.7
$11.5
$12.5
$12.3 $12.3 $14.7 $15.8
$13.9
$13.2
28%
36%
40% 40%
35%
34%
50%
47%
Q1'17 Q2'17 Q3'17 Q4'17 Q1'18 Q2'18 Q3'18 Q4'18
Mega-round funding ($B) Non Mega-round funding ($B) % Mega-rounds funding
PwC | CB Insights MoneyTree™ Report Q4 2018 62
US annual new unicorn births
A record number of companies reached unicorn status in 2018
• 53 companies attained unicorn status in 2018, a yearly record.
9
12
36
42
13
29
53
2012 2013 2014 2015 2016 2017 2018
US VC-backed Unicorn Births
PwC | CB Insights MoneyTree™ Report Q4 2018 63
US quarterly new unicorn births
Q4’18 sets quarterly record for new unicorns
• 21 private companies reached $1B valuations, a quarterly record.
4
3
5
10
7
5
6
8
17
21
Q3'16 Q4'16 Q1'17 Q2'17 Q3'17 Q4'17 Q1'18 Q2'18 Q3'18 Q4'18
US new VC-backed Unicorns
PwC | CB Insights MoneyTree™ Report Q4 2018 64
Unicorn population counts
US private VC-backed companies valued at $1B+ hit 140 in 2018
• As of EOY 2018, there are 140 VC-backed companies valued at $1B+.
26
53
91 94
110
140
2013 2014 2015 2016 2017 2018
Unicorn Population Count
PwC | CB Insights MoneyTree™ Report Q4 2018 65
Aggregate Unicorn Valuation by Period
Q4’18 sets a new record for aggregate unicorn valuation
• Private companies with $1B+ valuations accounted for $526.1B as of Q4’18, the highest aggregate valuation on record.
$63.1 $190.1 $324.6 $348.4 $367.9 $526.1
2013 2014 2015 2016 2017 2018
Unicorn Valuations ($B)
PwC | CB Insights MoneyTree™ Report Q4 2018 66
Top 5 Valued US unicorn companies as of Q4’18
Company Location Industry
Valuation
(as of 1/02/19)
Select Investors
1. Uber San Francisco, CA On-demand $72B
Lowercase Capital, Benchmark Capital,
Google Ventures
2. WeWork New York, NY Facilities $32B
T. Rowe Price, Benchmark Capital,
Softbank Group
3. Airbnb San Francisco, CA E-Commerce/Marketplace $29B General Catalyst Partners, Andreessen
Horowitz, ENIAC Ventures
4. SpaceX Hawthorne, CA Other Transportation $22B
Founders Fund, Draper Fisher
Jurvetson, Rothenberg Ventures
5. Stripe San Francisco, CA Fin Tech $20B Khosla Ventures, Lowercase Capital,
capitalG
5. Palantir Palo Alto, CA Big Data $20B RRE Ventures, Founders Fund, In-Q-
Tel
PwC | CB Insights MoneyTree™ Report Q4 2018 67
M&A and Median Years to Exit
M&A activity jumped to 663 in 2018
• M&A activity jumped by 79 deals in 2018, rising to 663.
• Median years to exit was steady at 5.5.
493 632 594 586 584 663
4.6
4.6
4.8 4.7
5.4 5.5
2013 2014 2015 2016 2017 2018
M&A Median Years
PwC | CB Insights MoneyTree™ Report Q4 2018 68
IPO and Median Years to Exit
IPO activity increased to 87 offerings in 2018
• IPOs jumped to 87 offerings in 2018, their highest level since 2014.
• Median years to exit declined to 5.2.
78 106 78 49 64 87
7.0
7.1
6.5
7.4
7.8
5.2
2013 2014 2015 2016 2017 2018
IPO Median Years
PwC | CB Insights MoneyTree™ Report Q4 2018 69
Largest US IPOs of Q4’18
Company Location Sector Industry Date of IPO $ Valuation at IPO
Moderna Therapeutics Cambridge, MA Healthcare Drug Development 12/7/2018 $7.5B
Anaplan San Francisco, CA Internet
Internet Software
& Services
10/12/2018 $2.0B
Allogene Therapeutics
South San
Francisco, CA
Healthcare Biotechnology 10/11/2018 $2.0B
Guardant Health Redwood City, CA Healthcare Biotechnology 10/4/2018 $1.6B
Upwork Global Redwood City, CA Internet E-Commerce 10/3/2018 $1.6B
PwC | CB Insights MoneyTree™ Report Q4 2018 70
Most active VC firms of Q4’18 in the US
Investor Location
No. of US
Companies
Select Q4’18 Investments
1. New Enterprise Associates Menlo Park, CA 21
Plaid Technologies, Bright Health, Mirum
Pharmaceuticals
2. Plug and Play Ventures Sunnyvale, CA 19 Zesty.ai, Albert, Zeguro
3. Lightspeed Venture Partners Menlo Park, CA 18 Epic Games, Netskope, TripActions
3. Andreessen Horowitz Menlo Park, CA 18
Devoted Health, Coinbase, Plaid
Technologies
5. Sequoia Capital San Francisco, CA 17
Snowflake Computing, Amplitude, The
Wing
PwC | CB Insights MoneyTree™ Report Q4 2018
Stage of
funding
Location of investors
Seed Total number of seed stage deals: 250
Early Total number of early stage deals: 279
Expansion Total number of expansion stage deals: 403
Later Total number of later stage deals: 154
71
Q4’18 Investor locations
California investor presence continues to be strong at every stage
• California-based investors were represented in approximately a third of all deals at all stages to US-based companies.
• Non-US investors participated in 30% of seed and early-stage deals and 24% of expansion deals.
32%
29%
38%
39%
10%
10%
10%
13%
3%
1%
1%
2%
25%
30%
27%
26%
30%
30%
24%
21%
California New York Texas Other US International
PwC | CB Insights MoneyTree™ Report Q4 2018 72
Top VC firms in the US by funds raised
Investor Location
Year
Founded
$ Value of Funds Raised
(2015 – Q4’2018)
Select Recent Investments
1. Sequoia Capital* Menlo Park, CA 1972 $17.6B
Snowflake Computing, Amplitude, The
Wing
2. Insight Venture Partners New York, NY 1995 $11.1B Jfrog, Project44, Tigera
3. New Enterprise Associates Menlo Park, CA 1977 $6.5B
Plaid Technologies, Bright Health,
Mirum Pharmaceuticals
4. GGV Capital Menlo Park, CA 2000 $5.1B Dirty Lemon, Immotor, Bowery Farming
5. Lightspeed Venture Partners Menlo Park, CA 2000 $4.3B Epic Games, Netskope, TripActions
*Includes all of the investment funds under the Sequoia Capital umbrella, including Sequoia Capital
China and Sequoia Capital India
Global Trends
05
PwC | CB Insights MoneyTree™ Report Q4 2018 74
2018 Global regional comparison
Deals
Deals
5,936
$102B 5,066
$81B
2,745
$21B
14,247 Deals
$207B Invested
Globally
PwC | CB Insights MoneyTree™ Report Q4 2018 75
Annual global financing trend
Global mega-round financing at record levels
• At 382, 2018 saw a record number of $100M+ deals, contributing to a massive funding year amid falling deal activity.
49 140 232 168 266 382
2013 2014 2015 2016 2017 2018
Mega-rounds into Global VC-Backed Companies
PwC | CB Insights MoneyTree™ Report Q4 2018 76
Q4’18 Global regional comparison
Deals
Deals
1,288
$25.7B 1,127
$19.8B
691
$5.0B
3,220 Deals
$51.B Invested
Globally
PwC | CB Insights MoneyTree™ Report Q4 2018 77
8-quarter global financing trend
Global funding, deal activity decline
• Total global quarterly funding declined to $51.7B in Q4’18, down from $54.1B in Q3’18.
• Deal activity declined to 3,220 in Q4’18, from 3,675 in Q3’18.
$30.9 $44.9 $47.4 $48.2 $48.7 $52.6 $54.1 $51.7
3,144 3,172
3,361 3,332 3,386
3,966
3,675
3,220
Q1'17 Q2'17 Q3'17 Q4'17 Q1'18 Q2'18 Q3'18 Q4'18
Investments ($B) Deals
PwC | CB Insights MoneyTree™ Report Q4 2018 78
Global corporate deal participation
Corporate participation increases to 32% globally in the fourth quarter
• Corporate investors participated in 32% of all deals to VC-backed companies in Q4’18.
75% 74% 75% 73% 73% 71% 69% 68%
25% 26% 25% 27% 27% 29% 31% 32%
Q1'17 Q2'17 Q3'17 Q4'17 Q1'18 Q2'18 Q3'18 Q4'18
Other Investors Corp / CVC Deal Participation
PwC | CB Insights MoneyTree™ Report Q4 2018 79
Annual global financing trend: North America
North America funding increases as deal activity declines in full-year 2018
• Total annual funding activity increased 29% in 2018, as $102B was invested across 5,936 deals.
$38 $62 $80 $66 $79 $102
5,416
6,259
6,409
6,050
6,162
5,936
2013 2014 2015 2016 2017 2018
Investment ($B) Deals
PwC | CB Insights MoneyTree™ Report Q4 2018 80
8-quarter financing trend: North America
North American funding, deal activity decline in Q4’18
• VC-backed companies in North America raised $25.7B across 1,288 deals, a 10% decline in funding.
$16.4 $20.1 $21.5 $20.8 $23.3 $24.8 $28.4 $25.7
1,595
1,507
1,606
1,454
1,549
1,674 1,425
1,288
Q1'17 Q2'17 Q3'17 Q4'17 Q1'18 Q2'18 Q3'18 Q4'18
Investments ($B) Deals
PwC | CB Insights MoneyTree™ Report Q4 2018 81
North America corporate deal participation
Q4’18 corporate participation flat in North America
• Corporate investors participated in 28% of US deals in Q4’18, flat compared to Q3’18.
77% 75% 77% 77% 76% 75% 72% 72%
23% 25% 23% 23% 24% 25%
28% 28%
Q1'17 Q2'17 Q3'17 Q4'17 Q1'18 Q2'18 Q3'18 Q4'18
Other Investors Corp / CVC Deal Participation
PwC | CB Insights MoneyTree™ Report Q4 2018 82
Annual global financing trend: Europe
European funding increases in full-year 2018
• Total annual Europe funding activity increased to $21B in 2018 across 2,745 deals.
$7 $10 $14 $13 $18 $21
1,550 1,633
2,035
2,403
2,871 2,745
2013 2014 2015 2016 2017 2018
Investment ($B) Deals
PwC | CB Insights MoneyTree™ Report Q4 2018 83
8-quarter financing trend: Europe
Europe funding flat as deal activity increases
• Quarterly funding increased slightly to $5.0B in Q4’18, from $4.9B in Q3’18.
• Deal activity increased to 691 transactions, up from 666 in Q3’18.
$3.5 $4.7 $5.5 $4.5 $5.1 $5.7 $4.9 $5.0
787
686
702 696
669
719
666
691
Q1'17 Q2'17 Q3'17 Q4'17 Q1'18 Q2'18 Q3'18 Q4'18
Investments ($B) Deals
PwC | CB Insights MoneyTree™ Report Q4 2018 84
Europe corporate deal participation
European corporate participation declines slightly
• European corporate investors participated in 27% of VC deals in Q4’18, a slight decline compared to Q3’18.
78% 76% 79% 77% 76% 75% 72% 73%
22% 24% 21% 23% 24% 25% 28% 27%
Q1'17 Q2'17 Q3'17 Q4'17 Q1'18 Q2'18 Q3'18 Q4'18
Other Investors Corp / CVC Deal Participation
PwC | CB Insights MoneyTree™ Report Q4 2018 85
Annual global financing trend: Asia
Asia funding increases for the second straight year; deal activity increases for the fifth straight year
• Annual funding for Asian companies increased to $81B in 2018, up from $73B in 2017.
• Deal activity jumped to 5,066 transactions, a 42% increase compared to 2017 and the fifth straight year of increasing deals.
$7 $22 $45 $37 $73 $81
1,071
1,675
2,425
2,609
3,569
5,066
2013 2014 2015 2016 2017 2018
Investment ($B) Deals
PwC | CB Insights MoneyTree™ Report Q4 2018 86
8-quarter financing trend: Asia
Asia funding falls for the second straight quarter
• Asian funding fell slightly in Q4’18, to $19.8B.
• Deal activity also fell to 1,127, from 1,446 transactions.
$10.7 $19.7 $20.1 $22.4 $19.5 $21.7 $19.9 $19.8
680
855
968
1,066 1,066
1,427 1,446
1,127
Q1'17 Q2'17 Q3'17 Q4'17 Q1'18 Q2'18 Q3'18 Q4'18
Investments ($B) Deals
PwC | CB Insights MoneyTree™ Report Q4 2018 87
Asia corporate deal participation
Corporate participation in Asia increases in Q4’18
• Corporate investors increased their participation in Asian VC deals to 39% in Q4’18.
65% 68% 69% 65% 67% 65% 66% 61%
35%
32% 31%
35% 33% 35% 34%
39%
Q1'17 Q2'17 Q3'17 Q4'17 Q1'18 Q2'18 Q3'18 Q4'18
Other Investors Corp / CVC Deal Participation
PwC | CB Insights MoneyTree™ Report Q4 2018 88
Largest global deals of Q4’18
Company Location Sector Industry
Stage of
Funding
$ Value
of Deal
Select Investors
Coupang
Seoul, South
Korea
Mobile &
Telecommunications
Mobile Commerce $2,000M SoftBank Group
Lu.com Shanghai, China Internet
Accounting &
Finance
$1,330M
All-Stars Investment, Goldman Sachs,
LionRock Capital
Epic Games
Cary, United
States
Software (non-
internet/mobile)
Gaming $1,250M ICONIQ Capital, KPCB, KKR & Co.
View
Milpitas, United
States
Industrial
General Building
Materials
$1,100M SoftBank Group
Tokopedia Jakarta, Indonesia Internet E-commerce $1,100M
SoftBank Group, Alibaba Group, Sequoia
Capital India
Swiggy Bengaluru, India
Mobile &
Telecommunications
Food & Grocery $1,000M
Coatue Management, Tencent Holdings,
Naspers
Expansion
Stage
Early
Stage
Later
Stage
Seed
Stage
PwC | CB Insights MoneyTree™ Report Q4 2018 89
Most active VC firms of Q4’18 globally
Investor Location
No. of Global
Companies
Select Q4’18 Investments
1. 500 Startups California, US 51 Goldbelly, Chewse, AppOnboard
2. Plug and Play Ventures California, US 34 Kepler Communications, Zesty.ai,
Albert
3. Sequoia Capital China Beijing, China 28 Leap Motor, Keking, 4Paradigm
4. Sequoia Capital California, US 22 Snowflake Computing, Woowa
Brothers, Graphcore
4. New Enterprise Associates California, US 22
Plaid Technologies, Bright Health,
Mirum Pharmaceuticals
PwC | CB Insights MoneyTree™ Report Q4 2018 90
Global mega-round activity
North America maintains its position with most quarterly $100M+ rounds
• North America saw 51 mega-rounds in Q4’18, down from 55 in Q3’18.
• Mega-rounds were down in North America and Asia, and flat in Europe.
20
35
33
36
34
48
55
51
22
30
37
31 30
40
48
44
5
7
5
3
7 7 6 6
0.0
10.0
20.0
30.0
40.0
50.0
60.0
Q1'17 Q2'17 Q3'17 Q4'17 Q1'18 Q2'18 Q3'18 Q4'18
North America Asia Europe
PwC | CB Insights MoneyTree™ Report Q4 2018 91
Global new unicorn births
North America surpasses Asia for most new unicorns for the second straight quarter
• North America saw a record number of private companies hit $1B valuations in Q4’18, at 21 companies.
• Asia surpassed North America in Q2’18 with the most new unicorns, but has since fallen behind in Q3’18 and Q4’18.
5
3
5
6
7
7
6
11
15
8
0 0
0
1
2
0
3
5
2
3
4
4 5
10
8
6
7
8
17
21
Q3'16 Q4'16 Q1'17 Q2'17 Q3'17 Q4'17 Q1'18 Q2'18 Q3'18 Q4'18
Asia Europe North America
PwC | CB Insights MoneyTree™ Report Q4 2018 92
Global seed-stage median deal size
Median seed-stage deal size jumps in North America
• Median North America seed-stage deal size jumped to $2.0M in Q4’18, from $1.5M in Q3’18.
• Asia and European seed-stage medians were mostly flat during this period.
$1.1
$1.7
$1.3
$2.0
$1.6
$2.0
$1.5
$2.0
$0.8
$1.2
$1.0
$1.5
$1.1
$1.3
$1.0
$1.2
$0.8
$1.1
$1.0
$1.2
$1.0
$1.2
$1.2
$1.2
Q1'17 Q2'17 Q3'17 Q4'17 Q1'18 Q2'18 Q3'18 Q4'18
North America ($M) Asia ($M) Europe ($M)
PwC | CB Insights MoneyTree™ Report Q4 2018 93
Global early-stage median deal size
North America median early-stage deal size jumped to $8M in Q4’18
• Median early-stage deal size in North America increased to $8M in Q4’18.
• Asian and European medians declined.
$5.5
$6.0 $6.0
$6.8 $7.0
$7.4
$6.5
$8.0
$5.6 $5.8
$7.1
$5.3
$7.0
$6.3
$6.0 $5.0
$4.8 $5.0
$4.7
$5.2
$4.2
$5.4
$4.6 $4.5
Q1'17 Q2'17 Q3'17 Q4'17 Q1'18 Q2'18 Q3'18 Q4'18
North America ($M) Asia ($M) Europe ($M)
PwC | CB Insights MoneyTree™ Report Q4 2018 94
Global expansion-stage median deal size
Expansion-stage median deal size jumps in North America
• Median expansion-stage deal size jumped to $20M in North America, while Europe was up slightly.
• Median expansion-stage deal size declined to $14.5M in Asia, down from $20M in Q3’18.
$15.0
$15.4 $15.0
$18.3
$16.0
$15.4
$16.0
$20.0
$15.0
$14.7
$17.7
$15.1
$19.0
$17.9
$20.0
$14.5
$10.7 $10.0
$11.3 $11.8
$14.5
$17.4
$12.7
$14.0
Q1'17 Q2'17 Q3'17 Q4'17 Q1'18 Q2'18 Q3'18 Q4'18
North America ($M) Asia ($M) Europe ($M)
PwC | CB Insights MoneyTree™ Report Q4 2018 95
Global later-stage median deal size
Asian median later-stage deal size plummets, North America down slightly
• Median later-stage deal size declined by 39% in Asia, dropping from $100M to $61.5M in Q4’18.
$24.3
$36.2
$31.8 $25.8 $30.0
$41.0
$32.0
$36.3
$40.0
$71.3
$90.0
$73.1
$65.6
$100.0 $100.0
$61.5
$16.3 $13.8 $12.0
$24.3
$18.6
$14.1 $14.1
$20.5
Q1'17 Q2'17 Q3'17 Q4'17 Q1'18 Q2'18 Q3'18 Q4'18
North America ($M) Asia ($M) Europe ($M)
AppendixAppendix
PwC | CB Insights MoneyTree™ Report Q4 2018 97
US States: Full listing
State $M
No. of
Deals
Alabama 3.5 3
Arizona 158.7 16
Arkansas 2.3 4
California 14,755.8 509
Colorado 243.7 37
Connecticut 51.0 10
DC 403.7 3
Delaware 2
Florida 155.3 23
Georgia 190.1 16
No disclosed quarterly activity: AK, HW, ID, MS, NB, NV, NM, RI, SD, WV, WY
State $M
No. of
Deals
Illinois 427.4 33
Indiana 94.8 12
Iowa 5.2 1
Kansas 29.3 6
Kentucky 4.2 2
Louisiana 5.4 2
Maine 1
Maryland 218.8 11
Massachusetts 2,313.0 111
Michigan 70.4 17
State $M
No. of
Deals
Minnesota 285.3 10
Missouri 69.4 9
Montana 3.2 1
New Hampshire 20.3 3
New Jersey 136.5 6
New York 2,054.4 155
North Carolina 1,425.4 16
North Dakota 1
Ohio 57.6 20
Oklahoma 1.0 2
State $M
No. of
Deals
Oregon 92.5 11
Pennsylvania 192.8 25
PR 1.0 1
South Carolina 0.3 1
Tennessee 435.8 10
Texas 428.8 50
Utah 246.9 12
Vermont 13.3 4
Virginia 69.1 8
Washington 252.4 36
PwC | CB Insights MoneyTree™ Report Q4 2018 98
Notes on methodology
PwC (pwc.com/moneytree) and CB Insights (cbinsights.com) encourage you to review the methodology and definitions employed to better understand the
numbers presented in this report. If you have any questions about the definitions or methodological principles used, we encourage you to reach out to CB
Insights directly. Additionally, if you feel your firm has been underrepresented, please send an email to info@cbinsights.com and we can work together to ensure
your firm’s investment data is up-to-date.
Rankings, e.g., top states and top sectors, are done by quarterly deal activity (that is, deal count for the given quarter).
What is included:
- Equity financings into emerging companies. Fundings must be to VC-backed
companies, which are defined as companies that have received funding at any
point from either: venture capital firms, corporate venture arms, or super
angel investors.
- Fundings of private companies only. Funding rounds raised by public companies
of any kind on any exchange (including Pink Sheets) are excluded from our
numbers, even if they received investment by a venture firm(s).
- Only includes the investment made in the quarter for tranched investments. If a
company does a second closing of its Series B round for $5M and previously had
closed $2M in a prior quarter, only the $5M is reflected in our results.
- Round numbers reflect what has closed – not what is intended. If a company
indicates the closing of $5M out of a desired raise of $15M, our numbers reflect
only the amount which has closed.
- Only verifiable fundings are included. Fundings are verified via (1) various federal
and state regulatory filings; (2) direct confirmation with firm or investor; (3)
press release; or (4) credible media sources.
- Equity fundings to joint ventures and spinoffs/spinouts are included, given that
they meet the VC-backed criteria.
- Geography note: Israel funding figures are classified in Asia.
What is excluded:
- No contingent funding. If a company receives a commitment for $20M subject to
hitting certain milestones but first gets $8M, only the $8M is included in our data.
- No business development / R&D arrangements whether transferable into equity now,
later or never. If a company signs a $300M R&D partnership with a larger
corporation, this is not equity financing nor is it from venture capital firms.
As a result, it is not included.
- No buyouts, consolidations or recapitalizations. All three of these transaction types are
commonly employed by private equity firms and are tracked by CB Insights. However,
they are excluded for the purposes of this report.
- No private placements. These investments, also known as PIPEs (Private Investment
in Public Equities), are not included even if made by a venture capital firm(s).
- No debt/loans of any kind (except convertible notes). Venture debt or any kind of
debt/loan issued to emerging, startup companies, even if included as an additional
part of an equity financing, is not included. If a company receives $3M with $2M from
venture investors and $1M in debt, only the $2M is included in these statistics.
- No non-equity government funding. Grants or loans by the federal government,
state agencies, or public-private partnerships to emerging, startup companies are
not included.
- No fundings to subsidiaries of a larger parent corporation.
This content is for general information purposes only, and should not be used as a substitute for consultation with professional advisors.
Data is current as of January 2, 2019. PricewaterhouseCoopers and CB Insights have taken responsible steps to ensure that the information
contained in the MoneyTree™ Report has been obtained from reliable sources. However, neither PwC nor CB Insights can warrant the
ultimate validity of the data obtained in this manner. Results are updated periodically. Therefore, all data is subject to change at any time.
© 2019 PwC. All rights reserved. PwC refers to the US member firm or one of its subsidiaries or affiliates, and may sometimes refer to the
PwC network. Each member firm is a separate legal entity. Please see www.pwc.com/structure for further details.

Moneytree Report 4th Quarter

  • 1.
    PwC / CBInsights MoneyTree™ Report Q4 2018
  • 2.
    PwC | CBInsights MoneyTree™ Report Q4 2018 2 Executive summary $100M+ deals drive 2018 global funding to highest levels since 2000, with US startups raising $99.5B over 5,536 deals. Annual US funding nears record amid falling deal activity: US VC funding jumped to $99.5B, the highest yearly funding level since 2000, over 5,536 transactions, the lowest level of deal activity since 2013. $100M mega-rounds drive funding higher: Driving the trend toward fewer, bigger deals, US companies raised a record number of mega-rounds in 2018, with 184 $100M+ funding rounds. Seed-stage deal share continues to fall in 2018: Seed-stage deal share fell to 25%, the third consecutive yearly decline, as larger, later-stage deals take up more US funding. US sees a record number of new unicorns: 53 US VC-backed companies saw their valuation rise to over $1B in 2018 — a record number of new unicorns. Artificial Intelligence funding peaks in Q3’18: AI-related funding declined in Q4’18 to $2.4B, from $2.7B in Q3’18, after increasing in the first three quarters of 2018. 2018 Global funding surges 21% compared to 2017, approaching 2000 record. Global funding hits $207B: Total annual global VC funding increased by 21% to $207B. Deal activity rose 10%, to 14,247 transactions. Asia funding increases moderately amid surging deal activity: Asia was an exception to falling global deal activity, with 5,066 transactions in 2018, a 42% increase compared to 2017. Funding in the region increased by 11%, to $80.9B. San Francisco funding hits historical record in 2018: VC funding in San Francisco jumped by 55% in 2018 to $28B, from $18B in 2017. Quarter-over-quarter, however, Q4’18 saw a decline in funding (-17%) and deal activity (-5%). New York Metro funding sets historical record in 2018: VC funding in the New York Metro area reached $13B in 2018, up from $12B in 2017 which also set the record. Quarter-over-quarter, however, funding fell significantly in Q4’18, falling 65% to $2.1B, from a massive $5.8B in Q3’18. Deal activity fell slightly, to 160 transactions in Q4’18, from 163 in Q3’18. Note: Report includes all rounds to VC-backed companies. For a detailed brief on methodology, please reference page 98 of this report.
  • 3.
    PwC | CBInsights MoneyTree™ Report Q4 2018 Table of contents 3 4 US Overall Trends 73 Global Trends 56 US Movers and Shakers 37 US Places 16 US Sectors
  • 4.
  • 5.
  • 6.
    PwC | CBInsights MoneyTree™ Report Q4 2018 6 Annual US financing trend US annual funding hits $99.5B amid falling deal activity • Total annual funding in the US increased by 30% in 2018, as $99.5B was invested across 5,536 deals. • US deal activity fell to its lowest level since 2013, though later-stage mega-deals pushed annual funding to its highest level since 2000. $36.4 $60.5 $78.1 $63.8 $76.4 $99.5 5,176 5,998 6,098 5,679 5,824 5,536 2013 2014 2015 2016 2017 2018 Investment ($B) Deals
  • 7.
    PwC | CBInsights MoneyTree™ Report Q4 2018 7 US deal share by stage US seed activity declines for the fourth straight year • Seed activity as a percentage of all deals fell to 25%, while later- and expansion-stage activity increased for the second straight year. • Increasing later-stage deals and decreasing early-stage deals are contributing to the trend of fewer, bigger VC deals. 36% 35% 35% 34% 31% 25% 25% 24% 25% 25% 25% 25% 21% 20% 19% 18% 19% 23% 10% 11% 10% 8% 9% 10% 8% 10% 12% 15% 16% 17% 2013 2014 2015 2016 2017 2018 Seed Stage Early Stage Expansion Stage Later Stage Other
  • 8.
    8 In Q4 2018 UNITED STATES VC-backedcompanies raised $25.0B
  • 9.
    PwC | CBInsights MoneyTree™ Report Q4 2018 9 8-quarter US financing trend US deals and funding slip in Q4’18 • Deal activity fell 9% in Q4’18, as $25B was invested across 1,211 deals. Funding fell from a record $28B in Q3’18. • 49 mega-rounds of $100M or more added to the strong US quarterly funding total. $15.9 $19.5 $20.7 $20.3 $22.6 $24.0 $28.0 $25.0 1,510 1,424 1,511 1,379 1,436 1,564 1,325 1,211 Q1'17 Q2'17 Q3'17 Q4'17 Q1'18 Q2'18 Q3'18 Q4'18 Investments ($B) Deals
  • 10.
    PwC | CBInsights MoneyTree™ Report Q4 2018 10 US financing trends ” 2018 was a phenomenal year for US venture capital, with $99.5B invested --- a record-breaking 55 unicorn births, 184 mega-rounds, and funding levels at their highest since 2000 ($119.6B). “ — Tom Ciccolella, Partner, US Ventures Leader at PwC
  • 11.
    PwC | CBInsights MoneyTree™ Report Q4 2018 11 US deal share by stage US seed activity rose moderately, but still within a downward trend • Seed-stage activity rose slightly to 23% of all deals, but was well below levels from a year prior. • Expansion-stage deal activity was up slightly, at 24% of all deals, compared to 20% a year prior. 34% 28% 34% 29% 28% 27% 22% 23% 24% 27% 24% 25% 25% 25% 27% 26% 17% 19% 19% 20% 22% 21% 23% 24% 9% 9% 9% 9% 10% 10% 11% 10% 17% 17% 14% 17% 16% 17% 17% 16% Q1'17 Q2'17 Q3'17 Q4'17 Q1'18 Q2'18 Q3'18 Q4'18 Seed Stage Early Stage Expansion Stage Later Stage Other
  • 12.
    PwC | CBInsights MoneyTree™ Report Q4 2018 12 Median US deal sizes by stage Median deal sizes are up across the board in Q4’18, with later-stage median rising to $37.5M • Expansion-stage deals hit a median size of $20M, up from $16M in Q3’18. • Later-stage median deal rose to $37.5M in Q4’18, up from $32.4M in Q3’18. $1.2 $1.8 $1.3 $2.0 $1.7 $2.0 $1.7 $2.1 $5.5 $6.0 $6.0 $7.0 $7.0 $7.0 $6.5 $8.0 $15.0 $16.0 $15.7 $18.1 $16.0 $15.4 $16.0 $20.0 $23.5 $37.0 $31.8 $25.0 $31.0 $40.0 $32.4 $37.5 Q1'17 Q2'17 Q3'17 Q4'17 Q1'18 Q2'18 Q3'18 Q4'18 Seed Stage Deal Size ($M) Early Stage Deal Size ($M) Expansion Stage Deal Size ($M) Later Stage Deal Size ($M)
  • 13.
    PwC | CBInsights MoneyTree™ Report Q4 2018 13 US corporate deal participation Corporate deal participation steady at 28% of all VC deals • Corporate participation in US VC deals was at 28% in Q4’18, down 1% compared to Q3’18. • Compared to a year prior, corporate participation was up 5% at year-end 2018. 77% 75% 77% 77% 76% 75% 71% 72% 23% 25% 23% 23% 24% 25% 29% 28% Q1'17 Q2'17 Q3'17 Q4'17 Q1'18 Q2'18 Q3'18 Q4'18 Other Investors Corp / CVC Deal Participation
  • 14.
    PwC | CBInsights MoneyTree™ Report Q4 2018 14 US first venture financing share (Quarterly) First venture rounds as a percentage of all deal activity flat in Q4’18 • In Q4’18, 34% of all US deals were first venture financings. • Throughout 2018, first venture rounds stayed in the 33-36% range of all deal activity. 68% 64% 67% 65% 67% 64% 66% 66% 32% 36% 33% 35% 33% 36% 34% 34% Q1'17 Q2'17 Q3'17 Q4'17 Q1'18 Q2'18 Q3'18 Q4'18 Other % of Total First VC-Backed Deals
  • 15.
    PwC | CBInsights MoneyTree™ Report Q4 2018 15 US first venture financing share (Annual) Annual proportion of first venture rounds flat in 2018 • In 2018, first venture rounds accounted for 34% of all deals, flat compared to 2017. 68% 66% 66% 67% 66% 66% 32% 34% 34% 33% 34% 34% 2013 2014 2015 2016 2017 2018 Other % of Total First VC-Backed Deals
  • 16.
  • 17.
    PwC | CBInsights MoneyTree™ Report Q4 2018 51 Deals 111 Deals 150 Deals 162 Deals 540 Deals 17 US deals and funding by Top 5 sectors, Q4’18 $9.1B Invested $4.0B Invested $3.5B Invested $3.0B Invested $382M Invested Internet Mobile & Telecommunications Software (Non-Internet / Mobile) Consumer Products & Services Healthcare
  • 18.
    PwC | CBInsights MoneyTree™ Report Q4 2018 18 US deal share by sector Internet deal share up slightly at 45%; Healthcare falls to 13% of all US VC deals • Internet deal share was up slightly at 45% of all deals, compared to 44% in Q3’18. • Healthcare deal share fell to 13%, down from 15% in Q3’18. 43% 44% 47% 42% 46% 43% 44% 45% 15% 13% 14% 15% 13% 15% 15% 13% 14% 15% 13% 11% 12% 12% 12% 12% 6% 8% 8% 8% 8% 9% 8% 9% 3% 5% 4% 6% 4% 5% 3% 4% 18% 15% 15% 18% 16% 16% 18% 16% Q1'17 Q2'17 Q3'17 Q4'17 Q1'18 Q2'18 Q3'18 Q4'18 Internet Healthcare Mobile & Telecommunications Software (non-internet/mobile) Consumer Products & Services Other
  • 19.
    PwC | CBInsights MoneyTree™ Report Q4 2018 19 Artificial Intelligence
  • 20.
    PwC | CBInsights MoneyTree™ Report Q4 2018 20 AI: US annual funding $1,147 $2,613 $3,297 $4,093 $5,425 $9,334 207 308 377 464 533 466 2013 2014 2015 2016 2017 2018 Investment ($M) Deals AI-related funding jumps sharply after increasing every year since 2013 • AI-related companies raised $9.3B in 2018, a 72% increase compared to 2017. • Deal activity dipped to 466 from 533 in 2017, after increasing for four years.
  • 21.
    PwC | CBInsights MoneyTree™ Report Q4 2018 21 AI: US quarterly funding AI-related deal activity falls in Q4’18 for the second-straight quarter • Funding and deal activity in the AI space fell in Q4’18. • Nearly $2.4B was raised over 93 deals, compared to $2.7B over 98 deals in Q3’18. $1,180 $1,294 $1,484 $1,467 $1,939 $2,373 $2,660 $2,361 152 116 150 115 137 138 98 93 Q1'17 Q2'17 Q3'17 Q4'17 Q1'18 Q2'18 Q3'18 Q4'18 Investments ($M) Deals
  • 22.
    PwC | CBInsights MoneyTree™ Report Q4 2018 22 AI: US deal share over time Seed-stage deal activity among AI-related companies rises to 28% • Seed-stage deal activity in the AI space rose in Q4’18 to 28%, compared to 24% in Q3’18. • Expansion-stage deal activity jumped to 32%, from 23%. 42% 30% 44% 38% 34% 32% 24% 28% 27% 33% 29% 24% 31% 32% 32% 26% 16% 20% 18% 22% 19% 21% 23% 32% 5% 7% 3% 7% 8% 8% 14% 9% 11% 10% 7% 9% 8% 7% 6% 5% Q1'17 Q2'17 Q3'17 Q4'17 Q1'18 Q2'18 Q3'18 Q4'18 Seed Stage Early Stage Expansion Stage Later Stage Other
  • 23.
    PwC | CBInsights MoneyTree™ Report Q4 2018 23 AI: Top states by deals 53 deals $1,917M Invested 1. CA 13 deals $247M Invested 10 deals $110M Invested 3 deals $10M Invested 3 deals $9M Invested 2. MA 3. NY 4. TX 4. WA
  • 24.
    PwC | CBInsights MoneyTree™ Report Q4 2018 24 AI: Largest US deals of Q4’18 Company Location Sector Industry Stage of Funding $ Value of Deal Select Investors Zymergen Emeryville, CA Software (non- internet / mobile) Healthcare $400M Data Collective, SoftBank Group, True Ventures, Two Sigma Ventures Automation Anywhere San Jose, CA Software (non- internet / mobile) Scientific, Engineering Software $300M SoftBank Group Tanium Emeryville, CA Software (non- internet / mobile) Security Software $200M Adage Capital Management, Baillie Gifford & Co., Wellington Management ZipRecruiter Santa Monica, CA Internet Internet Software $156M Institutional Venture Partners, Wellington Management DataRobot Boston, MA Internet Internet Software $100M DFJ Growth Fund, Intel Capital, New Enterprise Associates Expansion Stage Early Stage Later Stage Seed Stage
  • 25.
    PwC | CBInsights MoneyTree™ Report Q4 2018 25 Digital Health
  • 26.
    PwC | CBInsights MoneyTree™ Report Q4 2018 26 Digital Health: US annual funding Digital Health funding jumps by 21% in 2018 • Digital Health companies raised $8.6B in 2018, a 21% jump compared to 2017. • Deal activity was up slightly, at 477 deals in 2018. $2,015 $4,672 $4,556 $5,482 $7,100 $8,603 375 476 542 511 476 477 2013 2014 2015 2016 2017 2018 Investment ($M) Deals
  • 27.
    PwC | CBInsights MoneyTree™ Report Q4 2018 27 Digital Health: US quarterly funding Digital Health-related companies see funding drop by 41% • US Digital Health companies raised $1.9B in Q4’18, a 41% drop compared to Q3’18. • Deal activity also declined, falling to 83 deals from 123 in Q3’18. $1,800 $2,886 $1,170 $1,243 $1,858 $1,742 $3,151 $1,852 122 142 121 91 114 157 123 83 Q1'17 Q2'17 Q3'17 Q4'17 Q1'18 Q2'18 Q3'18 Q4'18 Investments ($M) Deals
  • 28.
    PwC | CBInsights MoneyTree™ Report Q4 2018 28 Digital Health: US deal share over time Seed-stage Digital Health deal activity increased • Seed-stage deal share rose to 25% of all Digital Health deals in Q4’18, up from 20% in Q3’18. 37% 25% 25% 32% 24% 31% 20% 25% 26% 32% 35% 14% 25% 25% 27% 20% 13% 22% 17% 26% 29% 26% 24% 31% 6% 11% 6% 12% 9% 10% 12% 8% 18% 11% 18% 15% 13% 8% 18% 14% Q1'17 Q2'17 Q3'17 Q4'17 Q1'18 Q2'18 Q3'18 Q4'18 Seed Stage Early Stage Expansion Stage Later Stage Other
  • 29.
    PwC | CBInsights MoneyTree™ Report Q4 2018 29 Digital Health: Top states by deals 27 deals $277 Invested 1. CA 12 deals $106M Invested 11 deals $224M Invested 5 deals $81M Invested 3. NY 2. MA 4. TX
  • 30.
    PwC | CBInsights MoneyTree™ Report Q4 2018 30 Digital Health: Largest US deals of Q4’18 Company Location Sector Industry Stage of Funding $ Value of Deal Select Investors Zymergen Emeryville, CA Software (non- internet/mobile) Healthcare Software $400M Data Collective, SoftBank Group, True Ventures, Two Sigma Ventures SmileDirectClub Nashville, TN Internet Internet Software & Services $380M Clayton Dubilier & Rice, Kleiner Perkins Caufield & Byers, Spark Capital Bright Health Minneapolis, MN Financial Insurance $200M Bessemer Venture Partners, Cross Creek Advisors, Declaration Partners Schrodinger New York, NY Software (non- internet/mobile) Healthcare Software $100M Qiming Venture Partners; Undisclosed Investors HNI Healthcare Austin, TX Software (non- internet/mobile) Healthcare Software $65M CRG Expansion Stage Early Stage Later Stage Seed Stage
  • 31.
    PwC | CBInsights MoneyTree™ Report Q4 2018 31 Fintech
  • 32.
    PwC | CBInsights MoneyTree™ Report Q4 2018 32 Fintech: US annual funding Fintech-related funding jumps 38% in 2018 amid rising deal activity • Total annual funding to US Fintech companies jumped 38% in 2018 to over $11B, the second straight yearly increase. • Deal activity rose to 627 transactions, up from 571 in 2017. $2,441 $5,689 $8,802 $5,769 $7,983 $10,988 406 506 578 558 571 627 2013 2014 2015 2016 2017 2018 Investment ($B) Deals
  • 33.
    PwC | CBInsights MoneyTree™ Report Q4 2018 33 Fintech: US quarterly funding Fintech funding and deal activity fall for the second straight quarter • Fintech-related funding fell 13% in Q4’18 to $2.5B, down from $2.9B in Q3’18. • Deal activity fell for the second straight quarter, to 123 transactions in Q4’18. $1,473 $2,070 $2,037 $2,404 $2,278 $3,250 $2,920 $2,539 146 140 145 140 185 167 152 123 Q1'17 Q2'17 Q3'17 Q4'17 Q1'18 Q2'18 Q3'18 Q4'18 Investments ($M) Deals
  • 34.
    PwC | CBInsights MoneyTree™ Report Q4 2018 34 Fintech: US deal share over time Seed-stage deal share increases slightly in Q4’18 • Seed-stage Fintech companies accounted for 25% of all deals in the space in Q4’18, up from 22% in Q3’18. 38% 34% 36% 34% 35% 24% 22% 25% 18% 29% 19% 26% 25% 30% 32% 28% 18% 18% 22% 21% 20% 20% 24% 25% 11% 9% 13% 9% 10% 11% 11% 9% 14% 11% 10% 9% 11% 15% 12% 13% Q1'17 Q2'17 Q3'17 Q4'17 Q1'18 Q2'18 Q3'18 Q4'18 Seed Stage Early Stage Expansion Stage Later Stage Other
  • 35.
    PwC | CBInsights MoneyTree™ Report Q4 2018 35 Fintech: Top states by deals 53 deals $1,518M Invested 1. CA 25 deals $189M Invested 10 deals $400M Invested 2. NY 3. MA
  • 36.
    PwC | CBInsights MoneyTree™ Report Q4 2018 36 Fintech: Largest US deals of Q4’18 Company Location Sector Industry Stage of Funding $ Value of Deal Select Investors Coinbase San Francisco, CA Internet Internet Software & Services $300M Andreessen Horowitz, Polychain Capital, Tiger Global Management, Wellington Management, Y Combinator Devoted Health Waltham, MA Healthcare Medical Facilities & Services $300M Andreessen Horowitz, F-Prime Capital, Premji Invest, Uprising, Venrock Plaid Technologies San Francisco, CA Internet Internet Software & Services $250M Andreessen Horowitz, Goldman Sachs Investment Partners, Index Ventures, Mary Meeker, New Enterprise Associates, Spark Capital Bright Health Minneapolis, MN Financial Insurance $200M Bessemer Venture Partners, Cross Creek Advisors, Declaration Partners Earnin Palo Alto, CA Mobile & Telecommunicat ions Mobile Software & Services $125M Andreessen Horowitz, Coatue Management, DST Global, March Capital Partners, Matrix Partners, Ribbit Capital, Spark Capital Expansion Stage Early Stage Later Stage Seed Stage
  • 37.
  • 38.
    PwC | CBInsights MoneyTree™ Report Q4 2018 $6,754M 38 US top five regions of Q4’18 by deals 104 123 139 160 241San Francisco (N. Bay Area) New York Metro Silicon Valley (S. Bay Area) New England Midwest $2,057M $5,271M $2,372M $794M
  • 39.
    PwC | CBInsights MoneyTree™ Report Q4 2018 39 US: Q4’18 funding by region Total US: $25.0B SF (N. Bay Area) $6,754M Northwest $348M AK/HI/PR $1M North Central $324M Southeast $2,210M CO $244M Texas $429M New England $2,372M Midwest $794M NewYorkMetro $2,057M Upstate NY $151M DC/Metroplex $692MLA/Orange County $1,976M PhiladelphiaMetro $122M SiliconValley(S. Bay Area) $5,271M San Diego $713M Sacramento/N. Cal $19M Southwest $406M South Central $38M
  • 40.
    PwC | CBInsights MoneyTree™ Report Q4 2018 40 US: Q4’18 deals by region SF (N. Bay Area) 241 Deals Northwest 48 Deals AK/HI/PR 1 Deal North Central 20 Deals Southeast 69 Deals CO 37 Deals Texas 50 Deals New England 123 Deals Midwest 104 Deals NewYorkMetro 160 Deals Upstate NY 4 Deals DC/Metroplex 22 DealsLA/Orange County 94 Deals Philadelphia Metro 16 Deals SiliconValley(S. Bay Area) 139 Deals San Diego 30 Deals Sacramento/N. Cal 3 Deals Southwest 28 Deals South Central 14 Deals Total US: 1,211 Deals
  • 41.
    PwC | CBInsights MoneyTree™ Report Q4 2018 41 Annual financing trend: San Francisco (North Bay Area) San Francisco funding jumped by 55% in 2018 • Funding activity in San Francisco jumped by 55% in 2018, rising to a historical record of $28B. • Deal activity declined to 1,088 transactions, compared to 1,120 in 2017; the last six years being the most active years ever $7 $16 $26 $19 $18 $28 1,018 1,255 1,287 1,180 1,120 1,088 2013 2014 2015 2016 2017 2018 Investment ($B) Deals
  • 42.
    PwC | CBInsights MoneyTree™ Report Q4 2018 42 8-quarter financing trend: San Francisco (North Bay Area) Q4’18 funding, deal activity decline in San Francisco • San Francisco companies saw VC funding decline sharply in Q4’18, falling 17% to $6.8B. • Deal activity also fell in Q4’18, to 241, from 254 in Q3’18. $3,904 $4,279 $3,918 $5,623 $6,663 $5,973 $8,142 $6,754 307 274 290 249 293 300 254 241 Q1'17 Q2'17 Q3'17 Q4'17 Q1'18 Q2'18 Q3'18 Q4'18 Investments ($M) Deals
  • 43.
    PwC | CBInsights MoneyTree™ Report Q4 2018 43 Annual financing trend: New York Metro New York funding ticks up, deal activity declines • Funding to New York-based VC-backed companies increased slightly to $13B, the biggest funding year ever. • Deals declined to 735, from 841 in 2017 which set the all-time record. $4 $6 $9 $9 $12 $13 672 795 823 795 841 735 2013 2014 2015 2016 2017 2018 Investment ($B) Deals
  • 44.
    PwC | CBInsights MoneyTree™ Report Q4 2018 44 8-quarter financing trend: New York Metro Q4’18 funding declines sharply in New York • New York Metro-based companies saw funding fall by 65% in Q4’18 to $2.1B, following a massive Q3’18. • Deal activity fell to 160 transactions over the same time period. $1,823 $2,937 $4,526 $2,978 $2,653 $2,812 $5,807 $2,057 208 196 220 217 203 209 163 160 Q1'17 Q2'17 Q3'17 Q4'17 Q1'18 Q2'18 Q3'18 Q4'18 Investments ($M) Deals
  • 45.
    PwC | CBInsights MoneyTree™ Report Q4 2018 45 Annual financing trend: Silicon Valley (South Bay Area) Funding to Silicon Valley companies ticks up in 2018 • Funding to Silicon Valley-based VC-backed companies increased in 2018, as $18B the biggest year since 2000. • Deals declined by 5% to 645 in 2018, from 682 in 2017. $7 $12 $10 $8 $13 $18 702 798 775 681 682 645 2013 2014 2015 2016 2017 2018 Investment ($B) Deals
  • 46.
    PwC | CBInsights MoneyTree™ Report Q4 2018 46 8-quarter financing trend: Silicon Valley (South Bay Area) Silicon Valley funding increases by 7% in Q4’18, as deal activity falls slightly • Deals activity fell to 139 in Q4’18, down from 144 in Q3’18. • Total quarterly funding increased to $5.3B in Q4’18, up from $4.9B in Q3’18. $3,090 $4,216 $2,448 $2,965 $3,901 $3,939 $4,922 $5,271 174 158 175 175 179 183 144 139 Q1'17 Q2'17 Q3'17 Q4'17 Q1'18 Q2'18 Q3'18 Q4'18 Investments ($M) Deals
  • 47.
    PwC | CBInsights MoneyTree™ Report Q4 2018 47 Annual financing trend: New England New England funding activity increases for the second straight year • Funding to New England-based VC-backed companies hit $11B in 2018, as deals increased to 536 transactions. • 2018 was the biggest year of investments for New England since 2000. $4 $6 $7 $7 $8 $11 526 571 587 519 526 536 2013 2014 2015 2016 2017 2018 Investment ($B) Deals
  • 48.
    PwC | CBInsights MoneyTree™ Report Q4 2018 48 8-quarter financing trend: New England New England deal activity, funding decline for the second straight quarter • New England deal activity sunk to 123 transactions, while total funding decreased to $2.4B. $2,084 $1,548 $1,965 $2,170 $2,748 $3,111 $2,457 $2,372 145 127 132 122 133 147 133 123 Q1'17 Q2'17 Q3'17 Q4'17 Q1'18 Q2'18 Q3'18 Q4'18 Investments ($M) Deals
  • 49.
    PwC | CBInsights MoneyTree™ Report Q4 2018 49 Annual financing trend: LA/Orange County Full year funding in LA/Orange County increases, deal activity down • Deal activity decreased to 419 transactions in LA/Orange County from 2017’s level (432) which was the most active year since 2000. • 2018 was the biggest year of investment funding ($6B) for LA/Orange County since 2000. $2 $4 $6 $5 $5 $6 325 360 414 367 432 419 2013 2014 2015 2016 2017 2018 Investment ($B) Deals
  • 50.
    PwC | CBInsights MoneyTree™ Report Q4 2018 50 8-quarter financing trend: LA/Orange County LA/Orange County funding jumps in Q4’18 • LA/Orange County funding jumped by 130% in Q4’18 to $2B. • Deal activity fell slightly from 97 transactions in Q3’18 to 94 in Q4’18. $1,065 $1,065 $1,615 $959 $1,789 $1,775 $858 $1,976 98 111 120 103 118 110 97 94 Q1'17 Q2'17 Q3'17 Q4'17 Q1'18 Q2'18 Q3'18 Q4'18 Investments ($M) Deals
  • 51.
    PwC | CBInsights MoneyTree™ Report Q4 2018 51 Annual financing trend: DC/Metroplex Deal and dollar activity down in 2018 in DC/Metroplex • Total annual funding to DC/Metroplex-based VC-backed companies declined to $2B in 2018, from $3B in 2017. • Deal activity declined to 178, from 209 in 2017. $1 $1 $3 $3 $3 $2 189 249 225 221 209 178 2013 2014 2015 2016 2017 2018 Investment ($B) Deals
  • 52.
    PwC | CBInsights MoneyTree™ Report Q4 2018 52 8-quarter financing trend: DC/Metroplex Funding in DC/Metroplex jumps amid falling deal activity • $692M was raised in the DC/Metroplex in Q4’18, up from $571M in Q3’18. • Deal activity fell for the second straight quarter to 22 transactions. $486 $420 $311 $1,290 $525 $557 $571 $692 63 45 45 56 49 62 45 22 Q1'17 Q2'17 Q3'17 Q4'17 Q1'18 Q2'18 Q3'18 Q4'18 Investments ($M) Deals
  • 53.
    PwC | CBInsights MoneyTree™ Report Q4 2018 53 US: Top 10 states of Q4’18 by deals 509 deals $14,756M 155 deals $2,054M 111 deals $2,313M 50 deals $429M 37 deals $244MM 1. CA 2. NY 3. MA 4. TX 5. CO 6. WA 36 deals $252M 33 deals $427M 25 deals $193M 23 deals $155M 20 deals $58M 7. IL 8. PA 9. FL 9. OH
  • 54.
    PwC | CBInsights MoneyTree™ Report Q4 2018 54 Q4’18 Regional comparison: Deals CA vs. NY vs. MA Deal activity down across the board in CA, NY, and MA • Deal activity declined in all three regions in Q4’18. • California and New York saw deal activity below levels a year ago in Q4’17. 623 582 626 567 617 646 531 509 205 185 209 206 202 204 156 155 127 113 116 110 118 125 117 111 Q1'17 Q2'17 Q3'17 Q4'17 Q1'18 Q2'18 Q3'18 Q4'18 California New York Massachusetts
  • 55.
    PwC | CBInsights MoneyTree™ Report Q4 2018 55 Q4’18 Regional comparison: Financing CA vs. NY vs. MA Q4’18 funding down across the board in CA, NY, and MA • Funding fell in Q4’18 in CA, NY, and MA. • Compared to Q4’17, only California saw a year-over-year increase in funding, at $14.8B in Q4’18, compared to $9.9B in Q4’17. $8.3 $10.0 $8.6 $9.9 $12.8 $12.5 $14.9 $14.8 $1.8 $2.6 $4.4 $2.9 $2.4 $2.8 $5.7 $2.1$2.0 $1.5 $1.5 $2.1 $2.7 $3.0 $2.4 $2.3 Q1'17 Q2'17 Q3'17 Q4'17 Q1'18 Q2'18 Q3'18 Q4'18 California New York Massachusetts
  • 56.
    US Movers &Shakers 04
  • 57.
    PwC | CBInsights MoneyTree™ Report Q4 2018 57 Mega-rounds ” There certainly continues to be a healthy availability of funds and appetite for investment, while the trend of fewer, bigger deals persists. “ — Tom Ciccolella, Partner, US Ventures Leader at PwC
  • 58.
    PwC | CBInsights MoneyTree™ Report Q4 2018 58 Annual US mega-round activity $100M+ funding rounds hit record for the second straight year • 184 $100M+ rounds were raised in 2018, surpassing 2017’s record 120. • An increasing number of large, later-stage deals is contributing to increasing yearly funding amounts amid declining overall deal activity. 25 80 110 66 120 184 2013 2014 2015 2016 2017 2018 Mega-rounds into US VC-Backed Companies
  • 59.
    PwC | CBInsights MoneyTree™ Report Q4 2018 59 Largest US deals of Q4’18 Company Location Sector Industry Stage of Funding $ Value of Deal Select Investors Epic Games Cary, NC Software (non- internet/mobile) Gaming $1,250M aXiomatic, ICONIQ Capital, Kleiner Perkins Caufield & Byers, Kohlberg Kravis Roberts & Co., Lightspeed Venture Partners View Milpitas, CA Industrial Construction $1,100M Softbank Group Instacart San Francisco, CA Mobile & Telecommunications Mobile Commerce $600M D1 Capital Partners Snowflake Computing San Mateo, CA Internet Internet Software & Services $450M Altimeter Capital, Capital One Growth Ventures, Madrona Venture Group, Meritech Capital Partners Relay Therapeutics Cambridge, MA Healthcare Drug Discovery $400M Alexandria Venture Investments, BVF Partners, Casdin Capital, D.E. Shaw Research Zymergen Emeryville, CA Software (non- internet/mobile) Healthcare Software $400M Data Collective, SoftBank Group, True Ventures, Two Sigma Ventures Expansion Stage Early Stage Later Stage Seed Stage
  • 60.
    PwC | CBInsights MoneyTree™ Report Q4 2018 60 Quarterly US mega-round activity $100M+ mega-rounds fall in Q4’18, but remain elevated above historical levels • 49 $100M+ rounds were raised in Q4’18, down from a record in Q3’18. • Though mega-rounds declined in Q4’18, levels remain elevated, contributing to high quarterly funding amid declining deal activity. 20 34 31 35 33 47 55 49 0.0 10.0 20.0 30.0 40.0 50.0 60.0 Q1'17 Q2'17 Q3'17 Q4'17 Q1'18 Q2'18 Q3'18 Q4'18 Mega-rounds Into US VC-Backed Companies
  • 61.
    PwC | CBInsights MoneyTree™ Report Q4 2018 61 Quarterly US mega-round share US mega-rounds represent 47% of total funding • Mega-rounds as a percentage of quarterly funding in the US were at 47% in Q4’18, down from 50% in Q3’18. • Mega rounds accounted for $11.7B of total US funding in Q4’18, down from $14.1B in Q3’18. $4.4 $7.0 $8.4 $8.0 $7.9 $8.1 $14.1 $11.7 $11.5 $12.5 $12.3 $12.3 $14.7 $15.8 $13.9 $13.2 28% 36% 40% 40% 35% 34% 50% 47% Q1'17 Q2'17 Q3'17 Q4'17 Q1'18 Q2'18 Q3'18 Q4'18 Mega-round funding ($B) Non Mega-round funding ($B) % Mega-rounds funding
  • 62.
    PwC | CBInsights MoneyTree™ Report Q4 2018 62 US annual new unicorn births A record number of companies reached unicorn status in 2018 • 53 companies attained unicorn status in 2018, a yearly record. 9 12 36 42 13 29 53 2012 2013 2014 2015 2016 2017 2018 US VC-backed Unicorn Births
  • 63.
    PwC | CBInsights MoneyTree™ Report Q4 2018 63 US quarterly new unicorn births Q4’18 sets quarterly record for new unicorns • 21 private companies reached $1B valuations, a quarterly record. 4 3 5 10 7 5 6 8 17 21 Q3'16 Q4'16 Q1'17 Q2'17 Q3'17 Q4'17 Q1'18 Q2'18 Q3'18 Q4'18 US new VC-backed Unicorns
  • 64.
    PwC | CBInsights MoneyTree™ Report Q4 2018 64 Unicorn population counts US private VC-backed companies valued at $1B+ hit 140 in 2018 • As of EOY 2018, there are 140 VC-backed companies valued at $1B+. 26 53 91 94 110 140 2013 2014 2015 2016 2017 2018 Unicorn Population Count
  • 65.
    PwC | CBInsights MoneyTree™ Report Q4 2018 65 Aggregate Unicorn Valuation by Period Q4’18 sets a new record for aggregate unicorn valuation • Private companies with $1B+ valuations accounted for $526.1B as of Q4’18, the highest aggregate valuation on record. $63.1 $190.1 $324.6 $348.4 $367.9 $526.1 2013 2014 2015 2016 2017 2018 Unicorn Valuations ($B)
  • 66.
    PwC | CBInsights MoneyTree™ Report Q4 2018 66 Top 5 Valued US unicorn companies as of Q4’18 Company Location Industry Valuation (as of 1/02/19) Select Investors 1. Uber San Francisco, CA On-demand $72B Lowercase Capital, Benchmark Capital, Google Ventures 2. WeWork New York, NY Facilities $32B T. Rowe Price, Benchmark Capital, Softbank Group 3. Airbnb San Francisco, CA E-Commerce/Marketplace $29B General Catalyst Partners, Andreessen Horowitz, ENIAC Ventures 4. SpaceX Hawthorne, CA Other Transportation $22B Founders Fund, Draper Fisher Jurvetson, Rothenberg Ventures 5. Stripe San Francisco, CA Fin Tech $20B Khosla Ventures, Lowercase Capital, capitalG 5. Palantir Palo Alto, CA Big Data $20B RRE Ventures, Founders Fund, In-Q- Tel
  • 67.
    PwC | CBInsights MoneyTree™ Report Q4 2018 67 M&A and Median Years to Exit M&A activity jumped to 663 in 2018 • M&A activity jumped by 79 deals in 2018, rising to 663. • Median years to exit was steady at 5.5. 493 632 594 586 584 663 4.6 4.6 4.8 4.7 5.4 5.5 2013 2014 2015 2016 2017 2018 M&A Median Years
  • 68.
    PwC | CBInsights MoneyTree™ Report Q4 2018 68 IPO and Median Years to Exit IPO activity increased to 87 offerings in 2018 • IPOs jumped to 87 offerings in 2018, their highest level since 2014. • Median years to exit declined to 5.2. 78 106 78 49 64 87 7.0 7.1 6.5 7.4 7.8 5.2 2013 2014 2015 2016 2017 2018 IPO Median Years
  • 69.
    PwC | CBInsights MoneyTree™ Report Q4 2018 69 Largest US IPOs of Q4’18 Company Location Sector Industry Date of IPO $ Valuation at IPO Moderna Therapeutics Cambridge, MA Healthcare Drug Development 12/7/2018 $7.5B Anaplan San Francisco, CA Internet Internet Software & Services 10/12/2018 $2.0B Allogene Therapeutics South San Francisco, CA Healthcare Biotechnology 10/11/2018 $2.0B Guardant Health Redwood City, CA Healthcare Biotechnology 10/4/2018 $1.6B Upwork Global Redwood City, CA Internet E-Commerce 10/3/2018 $1.6B
  • 70.
    PwC | CBInsights MoneyTree™ Report Q4 2018 70 Most active VC firms of Q4’18 in the US Investor Location No. of US Companies Select Q4’18 Investments 1. New Enterprise Associates Menlo Park, CA 21 Plaid Technologies, Bright Health, Mirum Pharmaceuticals 2. Plug and Play Ventures Sunnyvale, CA 19 Zesty.ai, Albert, Zeguro 3. Lightspeed Venture Partners Menlo Park, CA 18 Epic Games, Netskope, TripActions 3. Andreessen Horowitz Menlo Park, CA 18 Devoted Health, Coinbase, Plaid Technologies 5. Sequoia Capital San Francisco, CA 17 Snowflake Computing, Amplitude, The Wing
  • 71.
    PwC | CBInsights MoneyTree™ Report Q4 2018 Stage of funding Location of investors Seed Total number of seed stage deals: 250 Early Total number of early stage deals: 279 Expansion Total number of expansion stage deals: 403 Later Total number of later stage deals: 154 71 Q4’18 Investor locations California investor presence continues to be strong at every stage • California-based investors were represented in approximately a third of all deals at all stages to US-based companies. • Non-US investors participated in 30% of seed and early-stage deals and 24% of expansion deals. 32% 29% 38% 39% 10% 10% 10% 13% 3% 1% 1% 2% 25% 30% 27% 26% 30% 30% 24% 21% California New York Texas Other US International
  • 72.
    PwC | CBInsights MoneyTree™ Report Q4 2018 72 Top VC firms in the US by funds raised Investor Location Year Founded $ Value of Funds Raised (2015 – Q4’2018) Select Recent Investments 1. Sequoia Capital* Menlo Park, CA 1972 $17.6B Snowflake Computing, Amplitude, The Wing 2. Insight Venture Partners New York, NY 1995 $11.1B Jfrog, Project44, Tigera 3. New Enterprise Associates Menlo Park, CA 1977 $6.5B Plaid Technologies, Bright Health, Mirum Pharmaceuticals 4. GGV Capital Menlo Park, CA 2000 $5.1B Dirty Lemon, Immotor, Bowery Farming 5. Lightspeed Venture Partners Menlo Park, CA 2000 $4.3B Epic Games, Netskope, TripActions *Includes all of the investment funds under the Sequoia Capital umbrella, including Sequoia Capital China and Sequoia Capital India
  • 73.
  • 74.
    PwC | CBInsights MoneyTree™ Report Q4 2018 74 2018 Global regional comparison Deals Deals 5,936 $102B 5,066 $81B 2,745 $21B 14,247 Deals $207B Invested Globally
  • 75.
    PwC | CBInsights MoneyTree™ Report Q4 2018 75 Annual global financing trend Global mega-round financing at record levels • At 382, 2018 saw a record number of $100M+ deals, contributing to a massive funding year amid falling deal activity. 49 140 232 168 266 382 2013 2014 2015 2016 2017 2018 Mega-rounds into Global VC-Backed Companies
  • 76.
    PwC | CBInsights MoneyTree™ Report Q4 2018 76 Q4’18 Global regional comparison Deals Deals 1,288 $25.7B 1,127 $19.8B 691 $5.0B 3,220 Deals $51.B Invested Globally
  • 77.
    PwC | CBInsights MoneyTree™ Report Q4 2018 77 8-quarter global financing trend Global funding, deal activity decline • Total global quarterly funding declined to $51.7B in Q4’18, down from $54.1B in Q3’18. • Deal activity declined to 3,220 in Q4’18, from 3,675 in Q3’18. $30.9 $44.9 $47.4 $48.2 $48.7 $52.6 $54.1 $51.7 3,144 3,172 3,361 3,332 3,386 3,966 3,675 3,220 Q1'17 Q2'17 Q3'17 Q4'17 Q1'18 Q2'18 Q3'18 Q4'18 Investments ($B) Deals
  • 78.
    PwC | CBInsights MoneyTree™ Report Q4 2018 78 Global corporate deal participation Corporate participation increases to 32% globally in the fourth quarter • Corporate investors participated in 32% of all deals to VC-backed companies in Q4’18. 75% 74% 75% 73% 73% 71% 69% 68% 25% 26% 25% 27% 27% 29% 31% 32% Q1'17 Q2'17 Q3'17 Q4'17 Q1'18 Q2'18 Q3'18 Q4'18 Other Investors Corp / CVC Deal Participation
  • 79.
    PwC | CBInsights MoneyTree™ Report Q4 2018 79 Annual global financing trend: North America North America funding increases as deal activity declines in full-year 2018 • Total annual funding activity increased 29% in 2018, as $102B was invested across 5,936 deals. $38 $62 $80 $66 $79 $102 5,416 6,259 6,409 6,050 6,162 5,936 2013 2014 2015 2016 2017 2018 Investment ($B) Deals
  • 80.
    PwC | CBInsights MoneyTree™ Report Q4 2018 80 8-quarter financing trend: North America North American funding, deal activity decline in Q4’18 • VC-backed companies in North America raised $25.7B across 1,288 deals, a 10% decline in funding. $16.4 $20.1 $21.5 $20.8 $23.3 $24.8 $28.4 $25.7 1,595 1,507 1,606 1,454 1,549 1,674 1,425 1,288 Q1'17 Q2'17 Q3'17 Q4'17 Q1'18 Q2'18 Q3'18 Q4'18 Investments ($B) Deals
  • 81.
    PwC | CBInsights MoneyTree™ Report Q4 2018 81 North America corporate deal participation Q4’18 corporate participation flat in North America • Corporate investors participated in 28% of US deals in Q4’18, flat compared to Q3’18. 77% 75% 77% 77% 76% 75% 72% 72% 23% 25% 23% 23% 24% 25% 28% 28% Q1'17 Q2'17 Q3'17 Q4'17 Q1'18 Q2'18 Q3'18 Q4'18 Other Investors Corp / CVC Deal Participation
  • 82.
    PwC | CBInsights MoneyTree™ Report Q4 2018 82 Annual global financing trend: Europe European funding increases in full-year 2018 • Total annual Europe funding activity increased to $21B in 2018 across 2,745 deals. $7 $10 $14 $13 $18 $21 1,550 1,633 2,035 2,403 2,871 2,745 2013 2014 2015 2016 2017 2018 Investment ($B) Deals
  • 83.
    PwC | CBInsights MoneyTree™ Report Q4 2018 83 8-quarter financing trend: Europe Europe funding flat as deal activity increases • Quarterly funding increased slightly to $5.0B in Q4’18, from $4.9B in Q3’18. • Deal activity increased to 691 transactions, up from 666 in Q3’18. $3.5 $4.7 $5.5 $4.5 $5.1 $5.7 $4.9 $5.0 787 686 702 696 669 719 666 691 Q1'17 Q2'17 Q3'17 Q4'17 Q1'18 Q2'18 Q3'18 Q4'18 Investments ($B) Deals
  • 84.
    PwC | CBInsights MoneyTree™ Report Q4 2018 84 Europe corporate deal participation European corporate participation declines slightly • European corporate investors participated in 27% of VC deals in Q4’18, a slight decline compared to Q3’18. 78% 76% 79% 77% 76% 75% 72% 73% 22% 24% 21% 23% 24% 25% 28% 27% Q1'17 Q2'17 Q3'17 Q4'17 Q1'18 Q2'18 Q3'18 Q4'18 Other Investors Corp / CVC Deal Participation
  • 85.
    PwC | CBInsights MoneyTree™ Report Q4 2018 85 Annual global financing trend: Asia Asia funding increases for the second straight year; deal activity increases for the fifth straight year • Annual funding for Asian companies increased to $81B in 2018, up from $73B in 2017. • Deal activity jumped to 5,066 transactions, a 42% increase compared to 2017 and the fifth straight year of increasing deals. $7 $22 $45 $37 $73 $81 1,071 1,675 2,425 2,609 3,569 5,066 2013 2014 2015 2016 2017 2018 Investment ($B) Deals
  • 86.
    PwC | CBInsights MoneyTree™ Report Q4 2018 86 8-quarter financing trend: Asia Asia funding falls for the second straight quarter • Asian funding fell slightly in Q4’18, to $19.8B. • Deal activity also fell to 1,127, from 1,446 transactions. $10.7 $19.7 $20.1 $22.4 $19.5 $21.7 $19.9 $19.8 680 855 968 1,066 1,066 1,427 1,446 1,127 Q1'17 Q2'17 Q3'17 Q4'17 Q1'18 Q2'18 Q3'18 Q4'18 Investments ($B) Deals
  • 87.
    PwC | CBInsights MoneyTree™ Report Q4 2018 87 Asia corporate deal participation Corporate participation in Asia increases in Q4’18 • Corporate investors increased their participation in Asian VC deals to 39% in Q4’18. 65% 68% 69% 65% 67% 65% 66% 61% 35% 32% 31% 35% 33% 35% 34% 39% Q1'17 Q2'17 Q3'17 Q4'17 Q1'18 Q2'18 Q3'18 Q4'18 Other Investors Corp / CVC Deal Participation
  • 88.
    PwC | CBInsights MoneyTree™ Report Q4 2018 88 Largest global deals of Q4’18 Company Location Sector Industry Stage of Funding $ Value of Deal Select Investors Coupang Seoul, South Korea Mobile & Telecommunications Mobile Commerce $2,000M SoftBank Group Lu.com Shanghai, China Internet Accounting & Finance $1,330M All-Stars Investment, Goldman Sachs, LionRock Capital Epic Games Cary, United States Software (non- internet/mobile) Gaming $1,250M ICONIQ Capital, KPCB, KKR & Co. View Milpitas, United States Industrial General Building Materials $1,100M SoftBank Group Tokopedia Jakarta, Indonesia Internet E-commerce $1,100M SoftBank Group, Alibaba Group, Sequoia Capital India Swiggy Bengaluru, India Mobile & Telecommunications Food & Grocery $1,000M Coatue Management, Tencent Holdings, Naspers Expansion Stage Early Stage Later Stage Seed Stage
  • 89.
    PwC | CBInsights MoneyTree™ Report Q4 2018 89 Most active VC firms of Q4’18 globally Investor Location No. of Global Companies Select Q4’18 Investments 1. 500 Startups California, US 51 Goldbelly, Chewse, AppOnboard 2. Plug and Play Ventures California, US 34 Kepler Communications, Zesty.ai, Albert 3. Sequoia Capital China Beijing, China 28 Leap Motor, Keking, 4Paradigm 4. Sequoia Capital California, US 22 Snowflake Computing, Woowa Brothers, Graphcore 4. New Enterprise Associates California, US 22 Plaid Technologies, Bright Health, Mirum Pharmaceuticals
  • 90.
    PwC | CBInsights MoneyTree™ Report Q4 2018 90 Global mega-round activity North America maintains its position with most quarterly $100M+ rounds • North America saw 51 mega-rounds in Q4’18, down from 55 in Q3’18. • Mega-rounds were down in North America and Asia, and flat in Europe. 20 35 33 36 34 48 55 51 22 30 37 31 30 40 48 44 5 7 5 3 7 7 6 6 0.0 10.0 20.0 30.0 40.0 50.0 60.0 Q1'17 Q2'17 Q3'17 Q4'17 Q1'18 Q2'18 Q3'18 Q4'18 North America Asia Europe
  • 91.
    PwC | CBInsights MoneyTree™ Report Q4 2018 91 Global new unicorn births North America surpasses Asia for most new unicorns for the second straight quarter • North America saw a record number of private companies hit $1B valuations in Q4’18, at 21 companies. • Asia surpassed North America in Q2’18 with the most new unicorns, but has since fallen behind in Q3’18 and Q4’18. 5 3 5 6 7 7 6 11 15 8 0 0 0 1 2 0 3 5 2 3 4 4 5 10 8 6 7 8 17 21 Q3'16 Q4'16 Q1'17 Q2'17 Q3'17 Q4'17 Q1'18 Q2'18 Q3'18 Q4'18 Asia Europe North America
  • 92.
    PwC | CBInsights MoneyTree™ Report Q4 2018 92 Global seed-stage median deal size Median seed-stage deal size jumps in North America • Median North America seed-stage deal size jumped to $2.0M in Q4’18, from $1.5M in Q3’18. • Asia and European seed-stage medians were mostly flat during this period. $1.1 $1.7 $1.3 $2.0 $1.6 $2.0 $1.5 $2.0 $0.8 $1.2 $1.0 $1.5 $1.1 $1.3 $1.0 $1.2 $0.8 $1.1 $1.0 $1.2 $1.0 $1.2 $1.2 $1.2 Q1'17 Q2'17 Q3'17 Q4'17 Q1'18 Q2'18 Q3'18 Q4'18 North America ($M) Asia ($M) Europe ($M)
  • 93.
    PwC | CBInsights MoneyTree™ Report Q4 2018 93 Global early-stage median deal size North America median early-stage deal size jumped to $8M in Q4’18 • Median early-stage deal size in North America increased to $8M in Q4’18. • Asian and European medians declined. $5.5 $6.0 $6.0 $6.8 $7.0 $7.4 $6.5 $8.0 $5.6 $5.8 $7.1 $5.3 $7.0 $6.3 $6.0 $5.0 $4.8 $5.0 $4.7 $5.2 $4.2 $5.4 $4.6 $4.5 Q1'17 Q2'17 Q3'17 Q4'17 Q1'18 Q2'18 Q3'18 Q4'18 North America ($M) Asia ($M) Europe ($M)
  • 94.
    PwC | CBInsights MoneyTree™ Report Q4 2018 94 Global expansion-stage median deal size Expansion-stage median deal size jumps in North America • Median expansion-stage deal size jumped to $20M in North America, while Europe was up slightly. • Median expansion-stage deal size declined to $14.5M in Asia, down from $20M in Q3’18. $15.0 $15.4 $15.0 $18.3 $16.0 $15.4 $16.0 $20.0 $15.0 $14.7 $17.7 $15.1 $19.0 $17.9 $20.0 $14.5 $10.7 $10.0 $11.3 $11.8 $14.5 $17.4 $12.7 $14.0 Q1'17 Q2'17 Q3'17 Q4'17 Q1'18 Q2'18 Q3'18 Q4'18 North America ($M) Asia ($M) Europe ($M)
  • 95.
    PwC | CBInsights MoneyTree™ Report Q4 2018 95 Global later-stage median deal size Asian median later-stage deal size plummets, North America down slightly • Median later-stage deal size declined by 39% in Asia, dropping from $100M to $61.5M in Q4’18. $24.3 $36.2 $31.8 $25.8 $30.0 $41.0 $32.0 $36.3 $40.0 $71.3 $90.0 $73.1 $65.6 $100.0 $100.0 $61.5 $16.3 $13.8 $12.0 $24.3 $18.6 $14.1 $14.1 $20.5 Q1'17 Q2'17 Q3'17 Q4'17 Q1'18 Q2'18 Q3'18 Q4'18 North America ($M) Asia ($M) Europe ($M)
  • 96.
  • 97.
    PwC | CBInsights MoneyTree™ Report Q4 2018 97 US States: Full listing State $M No. of Deals Alabama 3.5 3 Arizona 158.7 16 Arkansas 2.3 4 California 14,755.8 509 Colorado 243.7 37 Connecticut 51.0 10 DC 403.7 3 Delaware 2 Florida 155.3 23 Georgia 190.1 16 No disclosed quarterly activity: AK, HW, ID, MS, NB, NV, NM, RI, SD, WV, WY State $M No. of Deals Illinois 427.4 33 Indiana 94.8 12 Iowa 5.2 1 Kansas 29.3 6 Kentucky 4.2 2 Louisiana 5.4 2 Maine 1 Maryland 218.8 11 Massachusetts 2,313.0 111 Michigan 70.4 17 State $M No. of Deals Minnesota 285.3 10 Missouri 69.4 9 Montana 3.2 1 New Hampshire 20.3 3 New Jersey 136.5 6 New York 2,054.4 155 North Carolina 1,425.4 16 North Dakota 1 Ohio 57.6 20 Oklahoma 1.0 2 State $M No. of Deals Oregon 92.5 11 Pennsylvania 192.8 25 PR 1.0 1 South Carolina 0.3 1 Tennessee 435.8 10 Texas 428.8 50 Utah 246.9 12 Vermont 13.3 4 Virginia 69.1 8 Washington 252.4 36
  • 98.
    PwC | CBInsights MoneyTree™ Report Q4 2018 98 Notes on methodology PwC (pwc.com/moneytree) and CB Insights (cbinsights.com) encourage you to review the methodology and definitions employed to better understand the numbers presented in this report. If you have any questions about the definitions or methodological principles used, we encourage you to reach out to CB Insights directly. Additionally, if you feel your firm has been underrepresented, please send an email to info@cbinsights.com and we can work together to ensure your firm’s investment data is up-to-date. Rankings, e.g., top states and top sectors, are done by quarterly deal activity (that is, deal count for the given quarter). What is included: - Equity financings into emerging companies. Fundings must be to VC-backed companies, which are defined as companies that have received funding at any point from either: venture capital firms, corporate venture arms, or super angel investors. - Fundings of private companies only. Funding rounds raised by public companies of any kind on any exchange (including Pink Sheets) are excluded from our numbers, even if they received investment by a venture firm(s). - Only includes the investment made in the quarter for tranched investments. If a company does a second closing of its Series B round for $5M and previously had closed $2M in a prior quarter, only the $5M is reflected in our results. - Round numbers reflect what has closed – not what is intended. If a company indicates the closing of $5M out of a desired raise of $15M, our numbers reflect only the amount which has closed. - Only verifiable fundings are included. Fundings are verified via (1) various federal and state regulatory filings; (2) direct confirmation with firm or investor; (3) press release; or (4) credible media sources. - Equity fundings to joint ventures and spinoffs/spinouts are included, given that they meet the VC-backed criteria. - Geography note: Israel funding figures are classified in Asia. What is excluded: - No contingent funding. If a company receives a commitment for $20M subject to hitting certain milestones but first gets $8M, only the $8M is included in our data. - No business development / R&D arrangements whether transferable into equity now, later or never. If a company signs a $300M R&D partnership with a larger corporation, this is not equity financing nor is it from venture capital firms. As a result, it is not included. - No buyouts, consolidations or recapitalizations. All three of these transaction types are commonly employed by private equity firms and are tracked by CB Insights. However, they are excluded for the purposes of this report. - No private placements. These investments, also known as PIPEs (Private Investment in Public Equities), are not included even if made by a venture capital firm(s). - No debt/loans of any kind (except convertible notes). Venture debt or any kind of debt/loan issued to emerging, startup companies, even if included as an additional part of an equity financing, is not included. If a company receives $3M with $2M from venture investors and $1M in debt, only the $2M is included in these statistics. - No non-equity government funding. Grants or loans by the federal government, state agencies, or public-private partnerships to emerging, startup companies are not included. - No fundings to subsidiaries of a larger parent corporation.
  • 99.
    This content isfor general information purposes only, and should not be used as a substitute for consultation with professional advisors. Data is current as of January 2, 2019. PricewaterhouseCoopers and CB Insights have taken responsible steps to ensure that the information contained in the MoneyTree™ Report has been obtained from reliable sources. However, neither PwC nor CB Insights can warrant the ultimate validity of the data obtained in this manner. Results are updated periodically. Therefore, all data is subject to change at any time. © 2019 PwC. All rights reserved. PwC refers to the US member firm or one of its subsidiaries or affiliates, and may sometimes refer to the PwC network. Each member firm is a separate legal entity. Please see www.pwc.com/structure for further details.