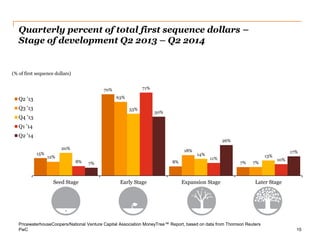
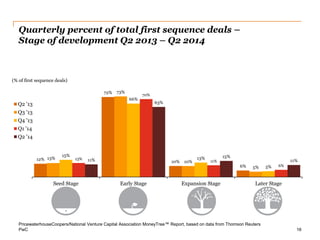
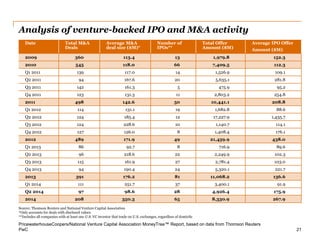
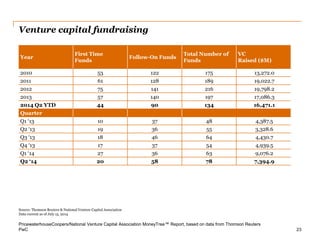
This document is a quarterly report from PricewaterhouseCoopers and the National Venture Capital Association on venture capital investment trends. Some key findings from Q2 2014 include:
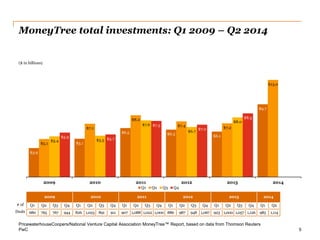
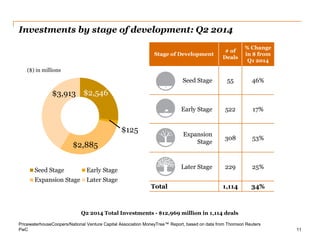
- Total US investments reached $12.9 billion across 1,114 deals, increases of 34% in dollars and 17% in deals from Q1 2014.
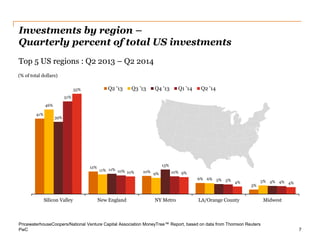
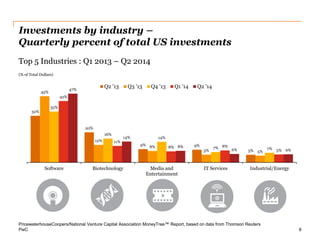
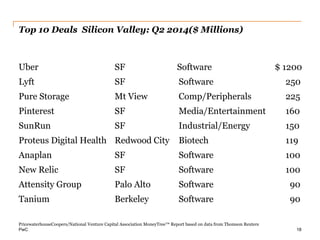
- Software remained the top funded sector, receiving $6.1 billion or 47% of total dollars. Silicon Valley received the largest share of investments at 55% of total dollars.
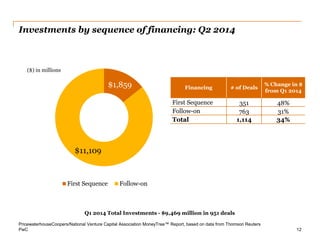
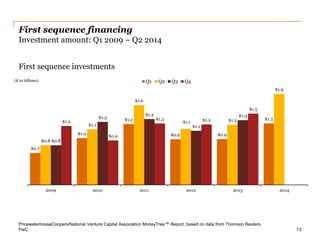
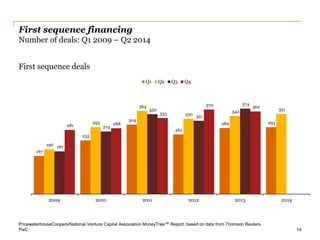
- First sequence (early stage) investments totaled $1.5 billion across 362 deals, increases of 48% in dollars and 26% in deals from Q1 2014.


![5G Explained! A High Level Overview [Introduction]](https://cdn.slidesharecdn.com/ss_thumbnails/5gexplainedahighleveloverview-260119165306-cc137a3e-thumbnail.jpg?width=640&height=640&fit=bounds)


