1. H
H P C X p e r f A p p l i c a t i o n A n a l y z e r
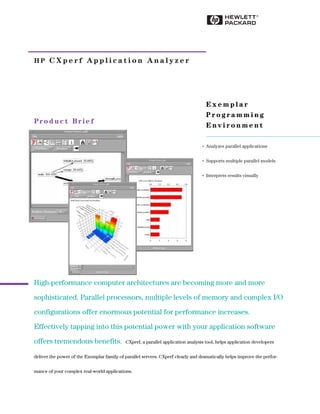
Pr o d u c t Brie f
E x e m p l a r
P r o g r a m m i n g
E n v i r o n m e n t
Analyzes parallel applications
Supports multiple parallel models
Interprets results visually
•
•
•
High-performance computer architectures are becoming more and more
sophisticated. Parallel processors, multiple levels of memory and complex I/O
configurations offer enormous potential for performance increases.
Effectively tapping into this potential power with your application software
offers tremendous benefits. CXperf, a parallel application analysis tool, helps application developers
deliver the power of the Exemplar family of parallel servers. CXperf clearly and dramatically helps improve the perfor-
mance of your complex real-world applications.
2. Why Application Performance
Analysis?
There are several types of perfor-
mance analyses, including hardware
simulation, system monitoring, appli-
cation monitoring and application
performance analysis. Application
performance analysis focuses on
improving the efficiency of your code
and reducing its total time to solution.
Application performance analysis
involves nearly every facet of a
system, including underlying hard-
ware architecture, operating system
and development tools. Analyzing the
behavior of applications therefore
requires well designed professionally
implemented tools.
Need for Speed
To compete in the global marketplace,
a product’s time-to-market and its
time-to-solution are paramount to
success. In scientific and engineering
computing, today’s users require the
ability to complete complex engineer-
ing and scientific development tasks
as quickly as possible.
processor speeds increase, and as the
complexity of memory architectures
increases, memory latency relative to
processor speeds also increases.
Managing the relative increased
memory latency continues to be a
significant challenge. These powerful
advanced systems promise dramatical-
ly improved performance. The chal-
lenge is to gain access to this new
power through applications software.
Larger Applications
As applications increase in size, they
require more memory and more
processors to complete in a timely
fashion. Mapping applications onto
multiprocessor systems with multiple
levels of memory is difficult, even with
the support of parallelizing compilers.
Complex Architectures
Computing architectures evolve to
meet customer demands for increased
performance and capability. As
Source
Program
Module
Parallel
Application
Editor
F90, F77,
C++, C
Compilers
Linker
Debugger
CXperf
Performance
Analysis
HP MPI
HP MLIB
Pthreads
Exemplar Programming Environment
Configure
Instrumentation
Execute
Analyze
CXperf Profiling Methodology
Compile application
for analysis
3. Performance tuning often involves
optimizing the use of this memory by
spreading the load across processors.
What is CXperf?
CXperf is an application analyzer,
designed to help developers identify
ways to improve the time to solution
of applications. CXperf gathers a large
variety of measurements of the perfor-
mance of an application. To reduce the
amount of data generated, CXperf uses
the reductionist method of analysis.
The reductionist method summarizes
statistics for each region of the appli-
cation you want to measure while your
program runs.
CXperf is integrated with HP compil-
ers, including Fortran 90, Fortran 77,
ANSI C++ and ANSI C. CXperf sup-
ports profiling of routines and loops,
including tracking compiler optimiza-
tions. CXperf is integrated with hard-
ware and the operating system to
support wall clock timing, CPU timing,
memory access counts and memory
latency timing. CXperf also supports
profiling of shared memory applica-
tions, including compiler generated
parallel code, Pthreads and user-speci-
fied parallel directives. CXperf can
profile multi-process applications and
message-passing parallel programming
models, such as HP MPI Message
Passing Interface software.
Description
Profiling an application is an iterative
process. CXperf allows a user to pro-
file an application, make changes and
re-profile the same application. CXperf
supports this process with an intuitive,
easy to use graphical user interface as
well as a command line interface to
easily modify and rerun tests.
To begin the process, the user com-
piles the application to profile, selects
the parts of the application to profile,
and then selects the metrics to collect
regarding those parts of the applica-
tion. CXperf then instruments the
application.
After the instrumentation step, the
user runs the application. CXperf
generates a program data file during
execution of the application.
In the analysis step, the developer
uses CXperf tools to graphically dis-
play the behavior of the application as
it occurred during the execution step.
Call graphs, summary profiles and
detailed parallel performance profiles
are all readily displayed. CXperf also
includes a number of textual reports
to describe the overall behavior of the
application.