EVALUATIONS OF WIND VECTORS OBSERVED BY ASCAT USING STATISTICAL DISTRIBUTIONS
LES_POSTER
1. “Sounding” Like Lake-Effect Snow: Evaluating Thermodynamic and Synoptic
Setup of Northwest Indiana Lake-Effect Events Using Local Profiles and
Numerical Modeling
Adam Brainard, Russell Danielson, Kaitlyn Heinlein, Kevin Wagner & Kevin Goebbert
Valparaiso University, Valparaiso, IN
• Hjelmfelt, Mark R., Roscoe R. Braham, 1983: Numerical Simulation of the Airflow over Lake Michigan for a Major
Lake-Effect Snow Event. Mon. Wea. Rev., 111, 205–219.
• Hjelmfelt, Mark R., 1990: Numerical Study of the Influence of Environmental Conditions on Lake-Effect Snowstorms
over Lake Michigan. Mon. Wea. Rev., 118, 138–150.
References:
• VU Meteorology Dept.
• Dr. Kevin Goebbert
• VU Aviation Interns
• VU LES Research group
• Iowa State University GEMPAK
archive
• Wyoming Weather Lab
Acknowledgments:
Lake-effect snow presents significant hazards for Northwest Indiana. From observations, thermodynamic and
synoptic environments are analyzed in conjunction with numerical simulations and official Green Bay soundings of
twelve lake-effect snow events. Unique thresholds will be identified in environmental parameters associated with
the setup and formation of lake-effect snow events over the southern Lake Michigan region and a mean sounding
was created for Northwest Indiana of these lake-effect snow setups.
Abstract
Valparaiso University’s Aviation Team routinely launches radiosondes into
many types of environments, but the project’s focus relied on the lake-effect
events. Data was collected from launches that occurred during times of lake
effect snowfall, thus seven out of twelve events were available for further
analysis and averaged. Raw data from VU launches conducted between the
winters of 2010-2013 was obtained from the log files produced by the Inter-Met
system following each launch. VU’s soundings were compared to the closest
NOAA NWS upper-air soundings at Green Bay, WI, data was retrieved from the
Wyoming Weather Lab archive. Iowa State University provided the archived
model data, which were used for the production of GEMPAK forecast maps.
Finally, thresholds for lake-effect snow events over Lake Michigan, as discussed
by Hjelmfelt 1990, provided initial ideas and parameters for research.
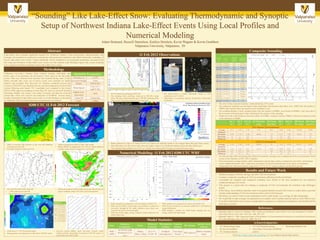
11 Feb 2012 Observations
• Defined averages of before, during, and after LES environments
• Created a composite sounding for LES environments affecting Northwest Indiana
• Concluded our modeled and composite sounding were similar to the ones produced by our launches
conducted during LES events
• This project is a good start for creating a composite of LES environments for Southern Lake Michigan
region
• In the future, more balloon launches need to be geared directly toward LES events to collect data to provide
a better understanding of LES environments and to aid in LES forecasts
• We believe we need to look at more parameters such as lake temps, ice coverage, & lake topography
• We would like to take averages for parameters at a smaller, more resolute interval such as every 5hPa or less
• It would be beneficial once we have enough data to categorize a composite sounding for each month and for
each type of system
Results and Future Work
Statistics of 2011-2013 Launches
Ascent
#
Date
Time of
Launch
(UTC)
Launch vs.
LES Time
014_001 2/9/2010 1730 4.5 hours
014_002 2/10/2010 0530 After LES
016_001 2/24/2010 1902 30 mins
016_002 2250 NA
028_001 12/4/2010 1330 10 hours
029_001 2024 3 hours
029_002 12/5/2010 0424 NA
035_001 2/8/2011 1605 NA
060_001 2/10/2012 2045 3 hours
061_001 2/11/2012 0240 NA
085_001 2/26/2013 1812 41 hours
085_002 2/26/2013 2146 39 hours
086_001 2/27/2013 1951 16 hours
087_001 2/28/2013 2105 NA
090_001 10/22/2013 2206 10 hours
091_001 11/11/2013 1708 10 hours
092_001 2158 6 hours
093_001 11/12/2013 0513 NA
093_002 11/12/2013 1411 NA
Hjelmfelt Parameters
ΔT(850hPa-sfc) ≥13⁰C
Inversion Height ≥1km
Winds NW/N/NE
Wind Speed
5 m/s (11.1
mph/9.7kt)
500hPa Vort.
Advection
AVA
3 hour ΔP increasing
Fetch ≥ 80km
• ΔT(850hPa-sfc) > 12⁰C from RAP model
• Strong surface convergence over Lake MI w/ NW/NE winds
• NE winds WI and N/NW winds MI
• ~10kt winds across Lake MI
• Snow observed w/ temps below freezing
Core:
Boundary
Conditions:
Nests:
Reference
Lat/Lon:
Microphyiscs
Scheme
Cumulus
Scheme
BL Scheme
Surface Layer
Scheme
WRF
ARW
NCEP/NCARR
Reanalysis (2.5o
res.)
108km,
36km, 12km
43.5o N, -
87.00o W
›Goddard
microphysics
New Kain
Fritsch
MYJ physics
›Mellor-Yamada-
Janjic
Model Statistics
• Valpo in between high pressure to the west and departing
low pressure to the east
• Favorable northerly winds and CAA
• Upper-air progressive pattern, large scale trough
• Strong 300hPa jet digging into GL, left exit region aiding in
synoptic rising motion to support LE convection
• Mid-level positively tilted trough and strong 70kt jet left exit
region, northerly winds, AVA aid in LES development
• Inversion around 650hPa, moist low-levels, westerly winds
shifting northerly, temps below freezing level, KVUM warmer w/
greater lapse rates than KGRB
• WRF sounding in comparison to KVUM launch at 0240 UTC
• WRF has less detail, cooler temps, less moisture in surface &
low-levels, stronger & NE winds, shallower snow layer, less
inversions & lower inversion heights
• WRF has similar shape, timing, northerly winds component, &
similar lapse rates
• WRF reflectivity in comparison to observed at 0245 UTC
• WRF has less resolution, no curvature within the S. LES bands &
weaker reflectivity
• WRF displays a similar two initial bands merging into one,
timing, location, & band length
Sfc T
(C)
925 T
(C)
925 Td
(C)
925 Wind Dir
(deg)
925 Wind
Spd (kts)
850 T
(C)
850 Td
(C)
850 Wind
Dir (deg)
850 Wind
Spd (kts)
Pre-Storm Environment
Average -0.11 -4.58 -5.76 3.61 20.5 -8.66 -9.46 353.86 20.88
Standard
Deviation 0.76 1.33 2.48 69.68 7.5 2.13 1.98 56.42 7.21
Maximum 1.5 -2 -2.9 23 -5.2 -6.5 31
Minimum -4 -8.2 -9.6 12 -11.7 -13.2 7
LES Environment
Average -1.21 -7.39 -8.14 342.85 21 -11.5 -12.41 353.71 25.57
Standard
Deviation 2.12 3.74 4.11 16.75 9.45 4.08 4.47 11.93 7.68
Maximum 2.2 -3.3 -3.4 34 -6.7 -7.8 41
Minimum -4.1 -14.3 -16.1 8 -19 -21.1 18Numerical Modeling: 11 Feb 2012 0300 UTC WRF
• KVUM observed sounding at 0240 UTC
• The sounding shows northerly winds up to 800 hPa, temps
below freezing, saturated profile up to 700 hPa, backing winds,
temps below freezing & steep low-level lapse rates
• Radar reflectivity of the LES band at 0245 UTC shows two mid-lake bands w/ the stronger band effecting Porter county
• Snowfall totals over the Great Lakes show the higher values over Northwest Indiana due to the lake effect snow
• The mid-lake band stalled west of VU as 5 inches was observed & 10 inches in western Porter county
• The rows in blue represent launches conducted during LES events
• The composite sounding was developed using temperature and dewpoint data taken every 10hPa from the surface to
500hPa and wind direction and speed at every mandatory level
• The sounding displays a fairly saturated layer from the surface to 800hPa, an inversion at 800hPa, a dry layer above
the inversion, and temperatures below freezing for the entirety of the sounding
• Winds out of the north-northwest from the surface to 850hPa, veering to north at 700hPa, followed by backing winds
to the northwest at 500hPa
• For both pre-lake effect and during lake-effect environments, averages were computed from the seven launches found
in blue on the Statistics of 2011-2013 Launches
• LES environment averages display colder temperatures and stronger winds as compared to pre-storm environment
• Lower standard deviations show winds more consistent in LES environments than in pre-storm environments
• Temperatures for both environments range from -4 ⁰C to -21 ⁰C, a layer conducive to dendritic growth
Methodology
Composite Sounding
SKEW-T
Td T Time/Location
12UTC KGRB
21UTC KVUM
00UTC KGRB
Wind Time/Location
12UTC KGRB
21UTC KVUM
00UTC KGRB
• The photo shows a typical radiosonde launch in LES
conditions from VU KCH
• 300g balloon w/ parachute, dereeler, & InterMet-1 radiosonde
& software
0300 UTC 11 Feb 2012 Forecast
Visit http://fujita.valpo.edu/soundings/ to view balloon launch data archive