SlideShare a Scribd company logo
1 of 4
Download to read offline
Central Florida
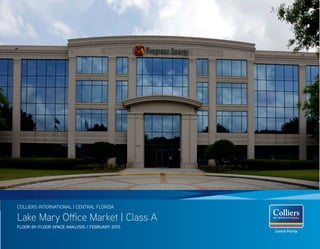
Lake Mary Office Market | Class A
FLOOR-BY-FLOOR SPACE ANALYSIS / FEBRUARY 2015
COLLIERS INTERNATIONAL | CENTRAL FLORIDA
Lake Mary Office Market | Class A
FLOOR-BY-FLOOR SPACE ANALYSIS | FEBRUARY 2015
Central Florida
FLOOR Direct Sublease
5 12,287 28,000 31,678
4 9,942 10,467 16,005 20,992
3 13,707 6,386 4,261 17,494
2 10,557 20,469 20,240 7,176 12,104
1 7,753 4,495 8,267 15,000 6,816 3,548 712
Total Bldg Size (RSF) 108,272 108,499 108,500 117,760 157,358 1153,569 155,203 122,655
Asking Rates
$22.00/FS $22.00/FS NA $22.00/FS Withheld 23.50/FS 23.50/FS
21.50/Net of
Electric
Avg. Floor Plate 21,654 27,125 21,700 23,552 31,472 30,714 31,041 30,664
Avail. Space (RSF)
54,246 0 45,589 0 0 0 40,150 0 43,005 0 34,984 31,618 21,042 0 12,816 0
Occupancy (%) 49.9% 57.98% 100% 65.60% 72.67% 77.22% 86.44% 86.44%
Northpoint I
1025 Greenwood
Boulevard
Northpoint II
1035 Greenwood
Boulevard
Northpoint III
3300 Exchange
Place
Northpoint IV
1064 Greenwood
Boulevard
Bellsouth Building
1101 Greenwood
Boulevard
Colonial Center 100
100 Colonial Center
Parkway
Colonial Center 200
200 Colonial Center
Parkway
Colonial Center 300
300 Colonial Center
Parkway
1 2 3 4 5 6 7 8
FLOOR
6
5 11,030
4 4,967 2,854 11,241 4,265
3 8,866 2,380 12,452
2 8,972 24,345 12,120 18,031 30,626 4,523
1 19,866 10,239 9,249 8,392 250 2,068
Total Bldg Size (RSF) 175,674 199,585 152,270 154,346 152,928 122,056 190,081 171,650
Asking Rates
Withheld 23.50/FS 23.00/FS 23.00/FS $22.00/FS 23.00/FS $23.00/FS 23.50/FS
Avg. Floor Plate 35,135 49,896 25,378 25,724 25,488 30,514 31,680 57,217
Avail. Space (RSF)
28,847 0 24,355 0 13,844 0 36,255 0 29,660 0 62,725 0 8,788 250 2,084 0
Occupancy (%) 83.58% 87.80% 90.91% 76.51% 80.61% 48.61% 95.38% 98.79%
400 Town Park
400 Colonial Center
Parkway
Colonial Center 600
600 Colonial Center
Parkway
Tower I at Primera
610 Crescent
Executive Court
Tower II at Primera
615 Crescent
Executive Court
Primera III
605 Crescent
Executive Court
Primera IV
300 Primera
Boulevard
Primera V
255 Primera
Boulevard
Crescent at Primera
1000 Primera
Boulevard
9 10 11 12 13 14 15 16
5
4 33,795 3,580
3 5,381 14,851 33,748 4,035 2,818
2 17,748 7,077
1 6,686 900 7,807 4,989 28,434 5,000
Total Bldg Size (RSF) 71,152 86,842 100,821 126,570 150,567 178,241 192,159
Asking Rates
$18.50/FS $22.00/FS $22.00/FS $22.00/FS Witheld $22.00/FS $22.00/FS
Avg. Floor Plate 23,717 21,711 25,205 31,643 30,113 44,560 38,432
Avail. Space (RSF)
29,815 0 7,807 0 26,917 0 95,997 0 0 5,000 4,035 2,818 3,580 0
Occupancy (%) 58.10% 91.01% 73.30% 24.16% 100% 97.74% 98.14%
Heathrow 1
250 International
Parkway
300 Heathrow
300 International
Parkway
400 Heathrow
400 International
Parkway
701 Heathrow
701 International
Parkway
801 Heathrow
801 International
Parkway
901 Heathrow
901 International
Parkway
1001 Heathrow
1001 Heathrow
Park Lane
17 18 19 20 21 22 23
COLLIERS INTERNATIONAL
CENTRAL FLORIDA
622 E Washington Street
Suite 300
Orlando, FL 32801
Office	 407 843 1723
Fax	 407 843 4485
www.colliers.com/orlando
Central Florida
NORTH
1
2
3
4
5
6
7
8
9
10
11
12
13 14
15
16
17
18
19
20
21
22
23
	1	 NORTH POINT I
	2	 NORTH POINT II
	3	 NORTHPOINT III
	4	 NORTH POINT IV
	5	 BELLSOUTH BUILDING
	6	 COLONIAL CENTER 100
	7	 COLONIAL CENTER 200
	8	 COLONIAL CENTER 300
	9	 400 TOWNPARK
10	 COLONIAL CENTER 600
11	 TOWER I AT PRIMERA
12	 TOWER II AT PRIMERA
	1	 NORTH POINT I
	2	 NORTH POINT II
	3	 NORTHPOINT III
	4	 NORTH POINT IV
	5	 BELLSOUTH BUILDING
	6	 COLONIAL CENTER 100
	7	 COLONIAL CENTER 200
	8	 COLONIAL CENTER 300
	9	 400 TOWNPARK
10	 COLONIAL CENTER 600
11	 TOWER I AT PRIMERA
12	 TOWER II AT PRIMERA
	13	 PRIMERA III
	14	 PRIMERA IV
	15	 PRIMERA V
	16	 CRESCENT AT PRIMERA
	17	 HEATHROW 1
	18	 300 HEATHROW
	19	 400 HEATHROW
	20	701 HEATHROW
	21	 801 HEATHROW
22	901 HEATHROW
23	1001 HEATHROW
	13	 PRIMERA III
	14	 PRIMERA IV
	15	 PRIMERA V
	16	 CRESCENT AT PRIMERA
	17	 HEATHROW 1
	18	 300 HEATHROW
	19	 400 HEATHROW
	20	701 HEATHROW
	21	 801 HEATHROW
22	901 HEATHROW
23	1001 HEATHROW

More Related Content

What's hot

Geo May 12, 2009
Geo May 12, 2009Geo May 12, 2009
Geo May 12, 2009Mr. Smith
 
Five Years of Spencer Ogden
Five Years of Spencer OgdenFive Years of Spencer Ogden
Five Years of Spencer OgdenTiffany Bowers
 
Buss2 business maths
Buss2 business mathsBuss2 business maths
Buss2 business mathsIGilmore
 
DIBI Conference: Visualising Data
DIBI Conference: Visualising DataDIBI Conference: Visualising Data
DIBI Conference: Visualising Databriansuda
 
2015 Minneapolis/ St. Paul Apartment Industry Outlook
2015 Minneapolis/ St. Paul Apartment Industry Outlook2015 Minneapolis/ St. Paul Apartment Industry Outlook
2015 Minneapolis/ St. Paul Apartment Industry OutlookSteven Ladin
 
2018 JLL Detroit Skyline Report
2018 JLL Detroit Skyline Report2018 JLL Detroit Skyline Report
2018 JLL Detroit Skyline ReportHarrison West
 

What's hot (9)

Section 1-6
Section 1-6Section 1-6
Section 1-6
 
Geo May 12, 2009
Geo May 12, 2009Geo May 12, 2009
Geo May 12, 2009
 
Penawaran bpjs kaca-pintu kaca
Penawaran bpjs kaca-pintu kacaPenawaran bpjs kaca-pintu kaca
Penawaran bpjs kaca-pintu kaca
 
Five Years of Spencer Ogden
Five Years of Spencer OgdenFive Years of Spencer Ogden
Five Years of Spencer Ogden
 
Buss2 business maths
Buss2 business mathsBuss2 business maths
Buss2 business maths
 
DIBI Conference: Visualising Data
DIBI Conference: Visualising DataDIBI Conference: Visualising Data
DIBI Conference: Visualising Data
 
2015 Minneapolis/ St. Paul Apartment Industry Outlook
2015 Minneapolis/ St. Paul Apartment Industry Outlook2015 Minneapolis/ St. Paul Apartment Industry Outlook
2015 Minneapolis/ St. Paul Apartment Industry Outlook
 
PFT Budget Presentation
PFT Budget PresentationPFT Budget Presentation
PFT Budget Presentation
 
2018 JLL Detroit Skyline Report
2018 JLL Detroit Skyline Report2018 JLL Detroit Skyline Report
2018 JLL Detroit Skyline Report
 

Similar to Lake Mary Office Market Space Analysis_February 2015

2016 ULI Hines Student Competition Pro Forma_v11
2016 ULI Hines Student Competition  Pro Forma_v112016 ULI Hines Student Competition  Pro Forma_v11
2016 ULI Hines Student Competition Pro Forma_v11Miguel A. Garcia
 
Midtown group the west end 10.27.08
Midtown group   the west end 10.27.08Midtown group   the west end 10.27.08
Midtown group the west end 10.27.08Tyler Elick
 
AQUILA Austin Market Report Q14 2016
 AQUILA Austin Market Report Q14 2016 AQUILA Austin Market Report Q14 2016
AQUILA Austin Market Report Q14 2016AQUILA Commercial
 
Q1 2013 North Peninsula Quarterly Report
Q1 2013 North Peninsula Quarterly ReportQ1 2013 North Peninsula Quarterly Report
Q1 2013 North Peninsula Quarterly ReportDeborah OReilly
 
Colliers Gta office market statistics q1 2016
Colliers Gta office market statistics q1 2016Colliers Gta office market statistics q1 2016
Colliers Gta office market statistics q1 2016Chris Fyvie
 
Austin Market Overview | 4Q 2015
Austin Market Overview | 4Q 2015Austin Market Overview | 4Q 2015
Austin Market Overview | 4Q 2015AQUILA Commercial
 
Assignment - Financial Appraisal
Assignment - Financial AppraisalAssignment - Financial Appraisal
Assignment - Financial AppraisalKai Yun Pang
 
JLL Cleveland Industrial Outlook: Q4 2018
JLL Cleveland Industrial Outlook: Q4 2018JLL Cleveland Industrial Outlook: Q4 2018
JLL Cleveland Industrial Outlook: Q4 2018Andrew Batson
 
JLL Cleveland Industrial Outlook: Q4 2018
JLL Cleveland Industrial Outlook: Q4 2018JLL Cleveland Industrial Outlook: Q4 2018
JLL Cleveland Industrial Outlook: Q4 2018Andrew Batson
 
Q2 2013 north peninsula quarterly report
Q2 2013 north peninsula quarterly reportQ2 2013 north peninsula quarterly report
Q2 2013 north peninsula quarterly reportDeborah OReilly
 
Q3 2014 industrial market report
Q3 2014 industrial market reportQ3 2014 industrial market report
Q3 2014 industrial market reportdevengriffin
 
Colliers GTA Office Statistics Q1 2017
Colliers GTA Office Statistics Q1 2017Colliers GTA Office Statistics Q1 2017
Colliers GTA Office Statistics Q1 2017Chris Fyvie
 
JLL Cleveland Industrial Outlook: Q3 2018
JLL Cleveland Industrial Outlook: Q3 2018JLL Cleveland Industrial Outlook: Q3 2018
JLL Cleveland Industrial Outlook: Q3 2018Andrew Batson
 
Q2 2014 industrial market report
Q2 2014 industrial market reportQ2 2014 industrial market report
Q2 2014 industrial market reportdevengriffin
 
JLL Cleveland Industrial Outlook: Q1 2019
JLL Cleveland Industrial Outlook: Q1 2019JLL Cleveland Industrial Outlook: Q1 2019
JLL Cleveland Industrial Outlook: Q1 2019Andrew Batson
 
Jll cincinnati industrial outlook q1 2017
Jll cincinnati industrial outlook   q1 2017Jll cincinnati industrial outlook   q1 2017
Jll cincinnati industrial outlook q1 2017Abby Armbruster
 
Cost & man solutions chapter 3 2008
Cost & man solutions chapter 3 2008Cost & man solutions chapter 3 2008
Cost & man solutions chapter 3 2008Kwanda Matiwane
 
JLL Cincinnati Industrial Outlook - Q3 2016
JLL Cincinnati Industrial Outlook - Q3 2016JLL Cincinnati Industrial Outlook - Q3 2016
JLL Cincinnati Industrial Outlook - Q3 2016Ross Bratcher
 
JLL Louisville Industrial Outlook - Q2 2021
JLL Louisville Industrial Outlook - Q2 2021 JLL Louisville Industrial Outlook - Q2 2021
JLL Louisville Industrial Outlook - Q2 2021 Alex Westcott
 

Similar to Lake Mary Office Market Space Analysis_February 2015 (20)

2016 ULI Hines Student Competition Pro Forma_v11
2016 ULI Hines Student Competition  Pro Forma_v112016 ULI Hines Student Competition  Pro Forma_v11
2016 ULI Hines Student Competition Pro Forma_v11
 
Midtown group the west end 10.27.08
Midtown group   the west end 10.27.08Midtown group   the west end 10.27.08
Midtown group the west end 10.27.08
 
AQUILA Austin Market Report Q14 2016
 AQUILA Austin Market Report Q14 2016 AQUILA Austin Market Report Q14 2016
AQUILA Austin Market Report Q14 2016
 
Q1 2013 North Peninsula Quarterly Report
Q1 2013 North Peninsula Quarterly ReportQ1 2013 North Peninsula Quarterly Report
Q1 2013 North Peninsula Quarterly Report
 
Colliers Gta office market statistics q1 2016
Colliers Gta office market statistics q1 2016Colliers Gta office market statistics q1 2016
Colliers Gta office market statistics q1 2016
 
Austin Market Overview | 4Q 2015
Austin Market Overview | 4Q 2015Austin Market Overview | 4Q 2015
Austin Market Overview | 4Q 2015
 
Assignment - Financial Appraisal
Assignment - Financial AppraisalAssignment - Financial Appraisal
Assignment - Financial Appraisal
 
JLL Cleveland Industrial Outlook: Q4 2018
JLL Cleveland Industrial Outlook: Q4 2018JLL Cleveland Industrial Outlook: Q4 2018
JLL Cleveland Industrial Outlook: Q4 2018
 
JLL Cleveland Industrial Outlook: Q4 2018
JLL Cleveland Industrial Outlook: Q4 2018JLL Cleveland Industrial Outlook: Q4 2018
JLL Cleveland Industrial Outlook: Q4 2018
 
Q2 2013 north peninsula quarterly report
Q2 2013 north peninsula quarterly reportQ2 2013 north peninsula quarterly report
Q2 2013 north peninsula quarterly report
 
Q3 2014 industrial market report
Q3 2014 industrial market reportQ3 2014 industrial market report
Q3 2014 industrial market report
 
Colliers GTA Office Statistics Q1 2017
Colliers GTA Office Statistics Q1 2017Colliers GTA Office Statistics Q1 2017
Colliers GTA Office Statistics Q1 2017
 
JLL Cleveland Industrial Outlook: Q3 2018
JLL Cleveland Industrial Outlook: Q3 2018JLL Cleveland Industrial Outlook: Q3 2018
JLL Cleveland Industrial Outlook: Q3 2018
 
Q2 2014 industrial market report
Q2 2014 industrial market reportQ2 2014 industrial market report
Q2 2014 industrial market report
 
JLL Cleveland Industrial Outlook: Q1 2019
JLL Cleveland Industrial Outlook: Q1 2019JLL Cleveland Industrial Outlook: Q1 2019
JLL Cleveland Industrial Outlook: Q1 2019
 
Jll cincinnati industrial outlook q1 2017
Jll cincinnati industrial outlook   q1 2017Jll cincinnati industrial outlook   q1 2017
Jll cincinnati industrial outlook q1 2017
 
Cost & man solutions chapter 3 2008
Cost & man solutions chapter 3 2008Cost & man solutions chapter 3 2008
Cost & man solutions chapter 3 2008
 
Q4 2013 Houston Industrial Market Research Report
Q4 2013 Houston Industrial Market Research ReportQ4 2013 Houston Industrial Market Research Report
Q4 2013 Houston Industrial Market Research Report
 
JLL Cincinnati Industrial Outlook - Q3 2016
JLL Cincinnati Industrial Outlook - Q3 2016JLL Cincinnati Industrial Outlook - Q3 2016
JLL Cincinnati Industrial Outlook - Q3 2016
 
JLL Louisville Industrial Outlook - Q2 2021
JLL Louisville Industrial Outlook - Q2 2021 JLL Louisville Industrial Outlook - Q2 2021
JLL Louisville Industrial Outlook - Q2 2021
 

Lake Mary Office Market Space Analysis_February 2015

  • 1. Central Florida Lake Mary Office Market | Class A FLOOR-BY-FLOOR SPACE ANALYSIS / FEBRUARY 2015 COLLIERS INTERNATIONAL | CENTRAL FLORIDA
  • 2. Lake Mary Office Market | Class A FLOOR-BY-FLOOR SPACE ANALYSIS | FEBRUARY 2015 Central Florida FLOOR Direct Sublease 5 12,287 28,000 31,678 4 9,942 10,467 16,005 20,992 3 13,707 6,386 4,261 17,494 2 10,557 20,469 20,240 7,176 12,104 1 7,753 4,495 8,267 15,000 6,816 3,548 712 Total Bldg Size (RSF) 108,272 108,499 108,500 117,760 157,358 1153,569 155,203 122,655 Asking Rates $22.00/FS $22.00/FS NA $22.00/FS Withheld 23.50/FS 23.50/FS 21.50/Net of Electric Avg. Floor Plate 21,654 27,125 21,700 23,552 31,472 30,714 31,041 30,664 Avail. Space (RSF) 54,246 0 45,589 0 0 0 40,150 0 43,005 0 34,984 31,618 21,042 0 12,816 0 Occupancy (%) 49.9% 57.98% 100% 65.60% 72.67% 77.22% 86.44% 86.44% Northpoint I 1025 Greenwood Boulevard Northpoint II 1035 Greenwood Boulevard Northpoint III 3300 Exchange Place Northpoint IV 1064 Greenwood Boulevard Bellsouth Building 1101 Greenwood Boulevard Colonial Center 100 100 Colonial Center Parkway Colonial Center 200 200 Colonial Center Parkway Colonial Center 300 300 Colonial Center Parkway 1 2 3 4 5 6 7 8
  • 3. FLOOR 6 5 11,030 4 4,967 2,854 11,241 4,265 3 8,866 2,380 12,452 2 8,972 24,345 12,120 18,031 30,626 4,523 1 19,866 10,239 9,249 8,392 250 2,068 Total Bldg Size (RSF) 175,674 199,585 152,270 154,346 152,928 122,056 190,081 171,650 Asking Rates Withheld 23.50/FS 23.00/FS 23.00/FS $22.00/FS 23.00/FS $23.00/FS 23.50/FS Avg. Floor Plate 35,135 49,896 25,378 25,724 25,488 30,514 31,680 57,217 Avail. Space (RSF) 28,847 0 24,355 0 13,844 0 36,255 0 29,660 0 62,725 0 8,788 250 2,084 0 Occupancy (%) 83.58% 87.80% 90.91% 76.51% 80.61% 48.61% 95.38% 98.79% 400 Town Park 400 Colonial Center Parkway Colonial Center 600 600 Colonial Center Parkway Tower I at Primera 610 Crescent Executive Court Tower II at Primera 615 Crescent Executive Court Primera III 605 Crescent Executive Court Primera IV 300 Primera Boulevard Primera V 255 Primera Boulevard Crescent at Primera 1000 Primera Boulevard 9 10 11 12 13 14 15 16 5 4 33,795 3,580 3 5,381 14,851 33,748 4,035 2,818 2 17,748 7,077 1 6,686 900 7,807 4,989 28,434 5,000 Total Bldg Size (RSF) 71,152 86,842 100,821 126,570 150,567 178,241 192,159 Asking Rates $18.50/FS $22.00/FS $22.00/FS $22.00/FS Witheld $22.00/FS $22.00/FS Avg. Floor Plate 23,717 21,711 25,205 31,643 30,113 44,560 38,432 Avail. Space (RSF) 29,815 0 7,807 0 26,917 0 95,997 0 0 5,000 4,035 2,818 3,580 0 Occupancy (%) 58.10% 91.01% 73.30% 24.16% 100% 97.74% 98.14% Heathrow 1 250 International Parkway 300 Heathrow 300 International Parkway 400 Heathrow 400 International Parkway 701 Heathrow 701 International Parkway 801 Heathrow 801 International Parkway 901 Heathrow 901 International Parkway 1001 Heathrow 1001 Heathrow Park Lane 17 18 19 20 21 22 23
  • 4. COLLIERS INTERNATIONAL CENTRAL FLORIDA 622 E Washington Street Suite 300 Orlando, FL 32801 Office 407 843 1723 Fax 407 843 4485 www.colliers.com/orlando Central Florida NORTH 1 2 3 4 5 6 7 8 9 10 11 12 13 14 15 16 17 18 19 20 21 22 23 1 NORTH POINT I 2 NORTH POINT II 3 NORTHPOINT III 4 NORTH POINT IV 5 BELLSOUTH BUILDING 6 COLONIAL CENTER 100 7 COLONIAL CENTER 200 8 COLONIAL CENTER 300 9 400 TOWNPARK 10 COLONIAL CENTER 600 11 TOWER I AT PRIMERA 12 TOWER II AT PRIMERA 1 NORTH POINT I 2 NORTH POINT II 3 NORTHPOINT III 4 NORTH POINT IV 5 BELLSOUTH BUILDING 6 COLONIAL CENTER 100 7 COLONIAL CENTER 200 8 COLONIAL CENTER 300 9 400 TOWNPARK 10 COLONIAL CENTER 600 11 TOWER I AT PRIMERA 12 TOWER II AT PRIMERA 13 PRIMERA III 14 PRIMERA IV 15 PRIMERA V 16 CRESCENT AT PRIMERA 17 HEATHROW 1 18 300 HEATHROW 19 400 HEATHROW 20 701 HEATHROW 21 801 HEATHROW 22 901 HEATHROW 23 1001 HEATHROW 13 PRIMERA III 14 PRIMERA IV 15 PRIMERA V 16 CRESCENT AT PRIMERA 17 HEATHROW 1 18 300 HEATHROW 19 400 HEATHROW 20 701 HEATHROW 21 801 HEATHROW 22 901 HEATHROW 23 1001 HEATHROW