Top Rated Pune Call Girls Viman Nagar ⟟ 6297143586 ⟟ Call Me For Genuine Sex...
2018 10-03 pf wastewater
1. 1/8
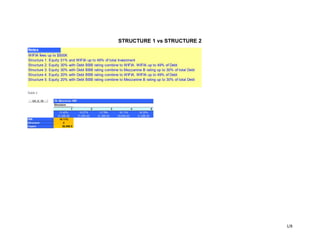
STRUCTURE 1 vs STRUCTURE 2
Table 1
Notes
WIFIA fees up to $500K
Structure 1: Equity 51% and WIFIA up to 49% of total Investment
Structure 2: Equity 30% with Debt BBB rating combine to WIFIA. WIFIA up to 49% of Debt
Structure 3: Equity 30% with Debt BBB rating combine to Mezzanine B rating up to 30% of total Debt
Structure 4: Equity 20% with Debt BBB rating combine to WIFIA. WIFIA up to 49% of Debt
Structure 5: Equity 20% with Debt BBB rating combine to Mezzanine B rating up to 30% of total Debt
4. 4/8
TRIANGULAR DISCRETE DISTRIBUTION
Table 3
1- CAPEX 3- ΔCOGS/Revenues Yea r 1 Year 2 Year 3 Year 4 Year 5
a -10.00% 18,900 Optimistic a -10.00% 0.00% 0.00% 22.50% 19.80% 18.00% Optimistic
c 10.00% 23,100 Most Likely c 10.00% 0.00% 0.00% 27.50% 24.20% 22.00% Most Likely
b 20.00% 25,200 W orst b 20.00% 0.00% 0.00% 30.00% 26.40% 24.00% W orst
P(X) 0.689 P(X) 0.509 0.630 0.395 0.651 0.418
x 23,171 x 0.00% 0.00% 26.35% 24.15% 21.17%
2- CAPACITY 4- D&B PLANNING
a -10.00% 18.00 W orse a 1.5 Optimistic
c 5.00% 21.00 Most Likely c 2.5 Most Likely
b 10.00% 22.00 Optimistic b 3.0 W orst
P(X) 0.154 P(X) 0.950
x 19 x 2.8
Skew 2.32
Kurtosis 5.39
VAR 5% 9.53%
M e a n 1 1 . 8 0 %
M e d ia n 1 1 . 2 0 %
S d t D e via t i o n 2 . 4 5 %
M i n 8 . 7 7 %
M a x 2 2 . 5 1 %
Figure 10
0
2
4
6
8
10
12
14
16
18
8.00%
8.61%
9.22%
9.84%
10.45%
11.06%
11.67%
12.29%
12.90%
13.51%
14.12%
14.73%
15.35%
15.96%
16.57%
17.18%
17.80%
18.41%
19.02%
19.63%
20.24%
20.86%
21.47%
22.08%
22.69%
Frequency
IRR
IRR
Discrete ProbabilityDistribution
Table 2
1- CAPEX 3- ΔCOGS/Re venue s Ye ar 1 Ye a r 2 Ye ar 3 Yea r 4 Ye ar 5
a -10.00% 18,900 Optim istic a -10.00% 0.00% 0.00% 22.50% 19.80% 18.00% Optim istic
c 10.00% 23,100 Most Likely c 10.00% 0.00% 0.00% 27.50% 24.20% 22.00% Most Likely
b 20.00% 25,200 W orst b 20.00% 0.00% 0.00% 30.00% 26.40% 24.00% W orst
P(X) 0.760 P(X) 0.365 0.733 0.071 0.670 0.222
x 23,416 x 0.00% 0.00% 24.13% 24.21% 20.31%
2- CAPACITY 4- D&B PLANNING
a -10.00% 18.00 W orse a 1.5 Optimistic
c 5.00% 21.00 Most Likely c 2.5 M ost Likely
b 10.00% 22.00 Optim istic b 3.0 W orst
P(X) 0.238 P(X) 0.961
x 20 x 2.8
Skew 1.43
Kurtosis 2.73
VAR 5% 8.80%
M e a n 1 1 . 5 7 %
M e d ia n 1 0 . 6 1 %
S d t D e via t io n 2 . 4 0 %
M in 7 . 8 8 %
M a x 1 7 . 8 3 %
Figure 9
0
2
4
6
8
10
12
7.00%
7.45%
7.90%
8.35%
8.80%
9.24%
9.69%
10.14%
10.59%
11.04%
11.49%
11.94%
12.39%
12.84%
13.29%
13.73%
14.18%
14.63%
15.08%
15.53%
15.98%
16.43%
16.88%
17.33%
17.78%
Frequency
IRR
IRR
Discrete ProbabilityDistribution