What your FP&A set up reveals
•Download as DOCX, PDF•
0 likes•64 views

What your FP&A set up reveals about yor company

Recommended
Recommended
More Related Content
What's hot
What's hot (20)
Similar to What your FP&A set up reveals
Similar to What your FP&A set up reveals (20)
More from Christian FOURNIER
More from Christian FOURNIER (8)
Recently uploaded
Recently uploaded (20)
What your FP&A set up reveals
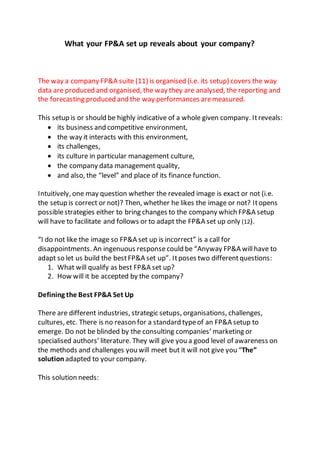
- 1. What your FP&A set up reveals about your company? The way a company FP&A suite (11) is organised (i.e. its setup) covers the way data are produced and organised, the way they are analysed, the reporting and the forecasting produced and the way performances aremeasured. This setup is or should be highly indicative of a whole given company. Itreveals: its business and competitive environment, the way it interacts with this environment, its challenges, its culture in particular management culture, the company data management quality, and also, the “level” and place of its finance function. Intuitively, one may question whether the revealed image is exact or not (i.e. the setup is correct or not)? Then, whether he likes the image or not? Itopens possiblestrategies either to bring changes to the company which FP&A setup will have to facilitate and follows or to adapt the FP&A set up only (12). “I do not like the image so FP&A set up is incorrect” is a call for disappointments. An ingenuous responsecould be “Anyway FP&A willhave to adapt so let us build the bestFP&A set up”. Itposes two differentquestions: 1. What will qualify as best FP&A set up? 2. How will it be accepted by the company? Defining the Best FP&A Set Up There are different industries, strategic setups, organisations, challenges, cultures, etc. There is no reason for a standard typeof an FP&A setup to emerge. Do not be blinded by the consulting companies’ marketing or specialised authors’ literature. They will give you a good level of awareness on the methods and challenges you will meet but it will not give you “The” solution adapted to your company. This solution needs:
- 2. 1. To be customised to your specific environment. In other words, thereis no BEST set up. There are only tools and methods that needs to be adapted to fit optimally a particular situation (11). 2. To creatively match your present andfuture business andcompetitive environment and the way your company interacts with it (11). 3. To develop more focus on the key challenges metby the company. 4. To favour (promote) achievements of company overall goals through management ownership thanks to soundtechnical processes thatgives visibility andpredictability based on educatedunderstanding of the situation and proper decision-making process. 5. To be supported by data management excellence. 6. To be fully integrated in company management logic and supported by a finance team that acts as a true business partners to all functions. Your solution will haveto respond to 7 challenges that are generally addressed by FP&A: 1. Timeliness, 2. Accuracy, 3. Relevance, 4. Transparency, 5. Efficiency, 6. Help to decision-making, 7. Flexibility, The different domains i.e. orders, revenues, OPEX, CAPEX, inventories, cash flow, etc., will be organised by responsibility centres (geographies/departments) and permit to understand the profitability evolution by productlines and customer/customer types, potentially projects (11) (3). The natural complexity of the company situation drives the overall setting yet the setting shall not complexify nor oversimplify the situation. Finding the right balance is key (4). So that is a lot to take in consideration!Butnot enough! Making the FP&A Set Up Accepted by the Company The setup needs to be highly culture-compatible i.e. well-accepted by the company. Lack of cultural compatibility will create behaviour biases that can
- 3. become highly counterproductive. Still it shall not be “sacralised” to the point of becoming THE only reference. “FP&A fundamentalism” can be extremely damageable (5). This posean issuewhen the company culture needs to be or is challenged. The FP&A setup is a good tool to supportchanges but can it be the tool that initiate the changes by itself? A chicken and egg question, may be. Cultural changes need a strong leadership push and supportbut also changes in the tools that are culturally sensitive such as FP&A setup and recognition mechanisms. So, both are needed and shall draw in the samedirection. What Should Be in the Set Up Then? Tools that permit to give visibility and predictability and insuremanagement ownership: Financial statements giving the overall financial situation. Tools that permits toanalyse the results in a meaningful way considering the company situation. The standard financialstatements are definitively insufficient (except for small, mono productcompanies). Tools that permit to communicate the results and the analysis outcomes to the relevant accountable managers. Tools that permit to predict the situation in the future. Tools that permit to take (material) decisions. Depending on the company sizeand situation, on its market and geographic reach, on its type of activity those different tools will have to be configured differently i.e. customised (11). The key will be how you match the 7 challenges previously mentioned and to make surethere are tested againstthe possibility to generate Simpson paradoxes (9) i.e. the dependant variables clearly identified and followed, the time distribution effects are correctly taken in consideration as well as the different data group size. How to Handle the 7 Challenges? 1. Timeliness,
- 4. The way different industries/businesses “respire” is different i.e. different Time To. Some havea high degree of immediateness (e.g. retail) whereas other goes through sales and delivery processes that are measured in weeks, months potentially years. Somemay have seasonal activities others are driven by large recurrentrevenuetype contract etc. This shall drivethe time table of analysis, reporting and forecasting activities. Itmay result in budget windows thatare quarters/ semesters/year, or seasons, or in rolling forecasts of different frequencies (rather than the annual standard financial time table). The whole point of the time table is to bring informationwhen it is needed i.e. actionable. Too early/too often, too late/not frequent enough will both results in inefficiencies and frustration (8). This posea specific challenge in companies having productlines with materially different time to. Itmay bring mix solutions wheredifferent productlines have different forecasting frequencies with some overall full company consolidation along the way. 2. Accuracy, Actuals and forecasts are two different “animals”. Accuracy shallnot be confused with precision. For actuals, it largely refers to data quality but not only. For forecast, it is both data quality and competitive and business intelligence. Budgetbasezero is a possible option in this domain (10) (7). 3. Relevance, The main point is that the person that receive an information can determine (with the help of FP&A) if actions are needed and if yes, take the appropriateactions. Receiving information (on a systematic manner) that are outside its area of responsibilities and ability to act can only create confusion and be a distraction. Same if the information is not specific enough. Furthermore, somefocus needs to exist on the key company challenges e.g. If financing situation is dire, the cash in and cash out needs to be work in more detail and focus more attention. 4. Transparency, Understanding and transparency on the way the figures are built are important to achieve trust in the figures and then focus on actions rather than on challenging the figures.
- 5. 5. Efficiency, Amount of effort it takes to producea report, a forecast, a productor customer P&L is often a sourceof discussion notto say complains. Data quality, ITtools and FP&A processes arekey to deliver efficiently. Yet, clear time table and due deliverables is a must (Who shall deliver what and when). One note here, amounts of effortand delays are two different things e.g. a forecastmay take 3 months to finalise but involve only 10 men days of effort. 6. Helpto decision-making, Most decisions involveunderstanding the underlining financial impacts. This involveability to producea view that is limited to the area of decision as well to model the consequences of the possibledecision(s) (1) (2). 7. Flexibility, Itcovers severalpossibleaspects. Let say here that the setup shall not impact the ability to take decisions and act on it whether it is internal changes or reaction to the environment. This is particularly true for budget/forecast. Actions shall be business driven rather than budget/forecastdriven (6). The following specific articles give more details on a number of subjects: (1) https://www.fpa-trends.com/article/business-cases-key-decision-making-tool-fpa (2) https://www.fpa-trends.com/article/explaining-reporting-and-forecasting-revenues- evolutions (3) https://www.fpa-trends.com/article/fpa-and-profitability (4) https://www.fpa-trends.com/article/role-fpa-mastering-company-ecosystem- complexity (5) https://www.fpa-trends.com/article/when-measure-become-target-it-ceases-be- good-measure (6) https://www.fpa-trends.com/article/two-examples-flexible-target-setting-fpa- process (7) https://www.fpa-trends.com/article/competitive-and-business-intelligence- forecasting-activities (8) https://www.fpa-trends.com/article/watch-your-fpa-processes (9) https://www.fpa-trends.com/article/fpa-analytics-and-simpsons-paradox (10)https://www.fpa-trends.com/article/forecast-accuracy (11)https://www.fpa-trends.com/article/my-fpa-suite (12)https://www.fpa-trends.com/article/evaluate-your-fpa-processes
- 6. In summary, as a CFO or FP&A manager, you must take the time to analyse your complete FP&A setup and define whatit reveals on your company. The image can bring you to improve your setup and/or to promote moregeneral changes in your company culture.