SlideShare a Scribd company logo
1 of 3
FP&A analytics and Simpson’s Paradox
Are your KPIs, Scoreboards and other metrics safe from the Simpson's paradox?
“Simpson’s paradox or Yule-Simpson effect is a paradox in probability and statistics, in which a trend appears in
different groups of data but disappears or reverses when these groups are combined. It is sometimes given the
descriptive title reversal paradox or amalgamation paradox”. (Extract from Wikipedia)
KPI, dashboard, other types of analytics,… that finance and FP&A use for communication, may include or
generate such paradox polluting the decision making process. Typically, those tools aggregate i.e. combine data
in the perspective to give simpler and quicker ways to manage and communicate performance and take decisions.
General trend in management practices is to highly recommend limitation of indicators’ number, and as such to
increase the aggregation level. It more or less focuses the attention of top and middle management depending on
company culture and on rewards and recognition systems.
It is then highly possible for such aggregation to induce directly or indirectly “false” understanding or certitudes just
like Simpson’s paradox would do. It should then be FP&A role to find and to fight such occurrence.
Still, we hardly hear or see mention of this concept during professional studies and life.
Practically, teaching and promotion of such tools includes few recommendations that would potentially exclude
dropping in that trap but without formally researching or verifying whether it exists or not.
Example:
A sales director is looking at theratio of commercial contact turned into sales in order to follow theperformance of two teams and
(among few other things) reward them on this basis.
Ratio contact to sales Period 1 Period 2 Period 3 Period 4 Period 5 Period 6
Team 1 60% 10% 64% 47% 43% 20%
Team 2 90% 30% 75% 50% 49% 50%
Team 2 had better rewards periods after periods.
Frustrated Team 1 leader ask their FP&A to analyze in more details and feed-back is
“Sorry, Simpson paradox!! Here is a better view of the relative performance! In fact, the two teams had the same performance
over last 6 periods“
Number of sales contact transformed in sales
Period 1 Period 2 Period 3 Period 4 Period 5 Period 6 Total
Nber of visits Team 1 100 10 50 150 70 20 400
Team 2 10 100 60 120 80 30 400
nber visits Turnsales Team 1 60 1 32 71 30 4 198
Team 2 9 30 45 60 39 15 198
Ratio contact to sales
Team 1 60% 10% 64% 47% 43% 20% 50%
Team 2 90% 30% 75% 50% 49% 50% 50%
Of course, here I forced the figures to a ridiculously simplistic example to illustrate my point and make it easy to understand.
In real life, it is generally far more complex to identify such issue. My example is a reversal case (or nearly) which is more easy to
spot. Still, in many cases it will not be so extreme, it will only hide (make disappear) the real evolution or performance.
The paradox appears thanks to few main causes:
1. Dependent variables are hidden through the aggregation of data,
2. Difference of distribution in time (the example is it),
3. Difference of size between the data groups entering in the calculation.
Similar examples can be found with return on investments, any given typeof expenses (say marketing) versus revenues, product
lines revenue distribution or growth, etc.… (In fact, many of thewidely known ratios or indicators may very well includes or
generate such effects if not properly customized and tested).
This brings few questions:
1. Up to what point thisparadox is known (as such or in another form)?
2. How it is reflected into the definition and implementation of the company tools and processes?
3. How the verification is done?
In my example, FP&A should have make sure the KPI was not reduced (aggregated)to such a level and demonstrate
that a more comprehensive set of figures needs to be considered,this should have been made during the set-up of the
company systems and FP&A should have “tell the story” behind those figures all along the process in such a way
that recognition should have been more in line with performance. A period to date indicator (or a weighted indicator)
would have been more representative e.g.
Period to date 60% 55% 58% 53% 51% 50%
90% 35% 49% 50% 49% 50%
In this example, it is highly intuitive, i.e. even without knowing about the paradox, a reasonably able person shall
have made it happen. Still, reality can be far more complex and intuitive reasoning might not be sufficient to identify
and adopt the right approach in each and every case, in particular, when the context is strongly oriented towards
limiting the number of KPI, Indicators,… used by management. Who has not heard a manager saying “This is too
much detail/figures, I just need to know (i.e. my compensation is only based on) these x indicators”.
Obviously, this brings into picture a different subject i.e. the reward and recognition based on KPI, scoreboard and
other metrics. Still, is it really different, if the metrics can reveal to be paradoxical?!
Knowing (be conscious of) this paradox and systematically making sure to avoid its trap is then a key role for
FP&A (i) when elaborating the systems and process that will be used (ii) when analyzing and commenting the
ongoing results.
We may try to draw a list of potentialcommon case but it remains a high level approach that cannot exempt from doing
effectively the exercise.
 Volume vs price evolution i.e. where your Revenue Indicators may hide more or less important shift in the price and/or
volumes. Similar for external expenditures.
 Regional differences, RI covering wide geographic reach may hide major evolutions in the respectiveareas,
 Customer profiles differences, RI covering wide customers profiles may hide customer profile shift,
 Product or market maturity phase, RI covering wide range may hide product or market maturity shift,
 Currency effect, in particular when pricing currency is different from the entities currency and from the consolidation
currency. Indicators expressed in consolidation currency will aggregate and then hide any currency effects and shift.
This also applies to most costs.
 Risk assessment or indicators,
 Quality indicators,
 Productivity indicators,
 …
Thoseapplicable to revenues (but not only) may very well combine altogether.
An (hopefully over-simplistic) example would be a global company management concentrating on an overall revenue indicator
mixing revenues from different geographic areas with product and markets in different maturity phasewhere customer profiles are
evolving rapidly and where business is done in few pricing currencies but over a large number of legal entities (with different
currencies then) and consolidating their results in its home currency. Such a global revenue indicator would mix so many effects
and potentials evolutions that it may reveal paradoxical. Even more dangerous, as it may not have been a problem for few years
i.e. whereas the potentialof an issue was there but the reality of the markets was not challenging (activating) it.
We could bet in such a case that the information systems will“lose” the pricing currency within theconsolidation process,
potentially shortcut theentity currency to consolidation currency effect too; will aggregate the product into a few product lines
historically driving the company development, will probably lose track of the customers profiles among few other “simplifications”
justified by the necessity to keep things more effective. Furthermore, the FP&A peoplemay be located in a limited number of
shared service centers loosening the contact with local reality. Theend result would be that thewhole organization IS and
processes, (probably culture) are cut from reality thanks to a basic misconception (lack of understanding/verification) during the
process of defining and implementing tools.
FP&A peoples do not need to know all the mathematics about this paradox. They still need to understand the concept, recognize
that it may “slip in” when defining their tools and processes, KPI, Scoreboard and other metrics and then make sure it is not the
case.

More Related Content

Similar to FP&A analytics and Simpson’s Paradox

Cash management - Exchange - Article 1
Cash management - Exchange - Article 1Cash management - Exchange - Article 1
Cash management - Exchange - Article 1
Ankur Bhandari
 
52 SEPTEMBER 2006 ©2006, CFA Institute cfapubs.orgEarnings.docx
52 SEPTEMBER 2006 ©2006, CFA Institute cfapubs.orgEarnings.docx52 SEPTEMBER 2006 ©2006, CFA Institute cfapubs.orgEarnings.docx
52 SEPTEMBER 2006 ©2006, CFA Institute cfapubs.orgEarnings.docx
blondellchancy
 
Is Your Customer-Centric Transformation Living Up to its Promise
Is Your Customer-Centric Transformation Living Up to its PromiseIs Your Customer-Centric Transformation Living Up to its Promise
Is Your Customer-Centric Transformation Living Up to its Promise
François Videlaine
 

Similar to FP&A analytics and Simpson’s Paradox (20)

Effective demand planning - our vision at Solventure
Effective demand planning - our vision at SolventureEffective demand planning - our vision at Solventure
Effective demand planning - our vision at Solventure
 
Margin Analysis Example
Margin Analysis ExampleMargin Analysis Example
Margin Analysis Example
 
Market Data Spend to sky-rocket for Canadian financial firms
Market Data Spend to sky-rocket for Canadian financial firms Market Data Spend to sky-rocket for Canadian financial firms
Market Data Spend to sky-rocket for Canadian financial firms
 
Financial Forecasts and Projections - Paul Beckman
Financial Forecasts and Projections - Paul BeckmanFinancial Forecasts and Projections - Paul Beckman
Financial Forecasts and Projections - Paul Beckman
 
Watch yr FP&A process
Watch yr FP&A processWatch yr FP&A process
Watch yr FP&A process
 
What your FP&A set up reveals
What your FP&A set up revealsWhat your FP&A set up reveals
What your FP&A set up reveals
 
Uncovering the Value of Financial Benefits
Uncovering the Value of Financial BenefitsUncovering the Value of Financial Benefits
Uncovering the Value of Financial Benefits
 
Ten Ways to Make Analytics Actionable
Ten Ways to Make Analytics ActionableTen Ways to Make Analytics Actionable
Ten Ways to Make Analytics Actionable
 
Final Khiyara (4)
Final Khiyara (4)Final Khiyara (4)
Final Khiyara (4)
 
Cash management - Exchange - Article 1
Cash management - Exchange - Article 1Cash management - Exchange - Article 1
Cash management - Exchange - Article 1
 
Making Analytics Actionable for Financial Institutions (Part I of III)
Making Analytics Actionable for Financial Institutions (Part I of III)Making Analytics Actionable for Financial Institutions (Part I of III)
Making Analytics Actionable for Financial Institutions (Part I of III)
 
S D M001 Sechrist 091707
S D M001  Sechrist 091707S D M001  Sechrist 091707
S D M001 Sechrist 091707
 
52 SEPTEMBER 2006 ©2006, CFA Institute cfapubs.orgEarnings.docx
52 SEPTEMBER 2006 ©2006, CFA Institute cfapubs.orgEarnings.docx52 SEPTEMBER 2006 ©2006, CFA Institute cfapubs.orgEarnings.docx
52 SEPTEMBER 2006 ©2006, CFA Institute cfapubs.orgEarnings.docx
 
Taking the Guesswork out of Pipelines and Forecasts
Taking the Guesswork out of Pipelines and ForecastsTaking the Guesswork out of Pipelines and Forecasts
Taking the Guesswork out of Pipelines and Forecasts
 
Is Your Customer-Centric Transformation Living Up to its Promise
Is Your Customer-Centric Transformation Living Up to its PromiseIs Your Customer-Centric Transformation Living Up to its Promise
Is Your Customer-Centric Transformation Living Up to its Promise
 
Basics of a pitch deck
Basics of a pitch deckBasics of a pitch deck
Basics of a pitch deck
 
Explaining finance to my grandchildren
Explaining finance to my grandchildrenExplaining finance to my grandchildren
Explaining finance to my grandchildren
 
Fit for Growth: PwC Top Issuses
Fit for Growth: PwC Top Issuses  Fit for Growth: PwC Top Issuses
Fit for Growth: PwC Top Issuses
 
Ignacio Velez-Pareja : From the Slide Rule to the Black Berry
Ignacio Velez-Pareja : From the Slide Rule to the Black BerryIgnacio Velez-Pareja : From the Slide Rule to the Black Berry
Ignacio Velez-Pareja : From the Slide Rule to the Black Berry
 
What is the function of the performance analyst by Luciano Ruocco
What is the function of the performance analyst by Luciano RuoccoWhat is the function of the performance analyst by Luciano Ruocco
What is the function of the performance analyst by Luciano Ruocco
 

Recently uploaded

Call Girls Hebbal Just Call 👗 7737669865 👗 Top Class Call Girl Service Bangalore
Call Girls Hebbal Just Call 👗 7737669865 👗 Top Class Call Girl Service BangaloreCall Girls Hebbal Just Call 👗 7737669865 👗 Top Class Call Girl Service Bangalore
Call Girls Hebbal Just Call 👗 7737669865 👗 Top Class Call Girl Service Bangalore
amitlee9823
 
Call Now ☎️🔝 9332606886🔝 Call Girls ❤ Service In Bhilwara Female Escorts Serv...
Call Now ☎️🔝 9332606886🔝 Call Girls ❤ Service In Bhilwara Female Escorts Serv...Call Now ☎️🔝 9332606886🔝 Call Girls ❤ Service In Bhilwara Female Escorts Serv...
Call Now ☎️🔝 9332606886🔝 Call Girls ❤ Service In Bhilwara Female Escorts Serv...
Anamikakaur10
 
Nelamangala Call Girls: 🍓 7737669865 🍓 High Profile Model Escorts | Bangalore...
Nelamangala Call Girls: 🍓 7737669865 🍓 High Profile Model Escorts | Bangalore...Nelamangala Call Girls: 🍓 7737669865 🍓 High Profile Model Escorts | Bangalore...
Nelamangala Call Girls: 🍓 7737669865 🍓 High Profile Model Escorts | Bangalore...
amitlee9823
 
unwanted pregnancy Kit [+918133066128] Abortion Pills IN Dubai UAE Abudhabi
unwanted pregnancy Kit [+918133066128] Abortion Pills IN Dubai UAE Abudhabiunwanted pregnancy Kit [+918133066128] Abortion Pills IN Dubai UAE Abudhabi
unwanted pregnancy Kit [+918133066128] Abortion Pills IN Dubai UAE Abudhabi
Abortion pills in Kuwait Cytotec pills in Kuwait
 
Call Girls Electronic City Just Call 👗 7737669865 👗 Top Class Call Girl Servi...
Call Girls Electronic City Just Call 👗 7737669865 👗 Top Class Call Girl Servi...Call Girls Electronic City Just Call 👗 7737669865 👗 Top Class Call Girl Servi...
Call Girls Electronic City Just Call 👗 7737669865 👗 Top Class Call Girl Servi...
amitlee9823
 
FULL ENJOY Call Girls In Mahipalpur Delhi Contact Us 8377877756
FULL ENJOY Call Girls In Mahipalpur Delhi Contact Us 8377877756FULL ENJOY Call Girls In Mahipalpur Delhi Contact Us 8377877756
FULL ENJOY Call Girls In Mahipalpur Delhi Contact Us 8377877756
dollysharma2066
 
Russian Call Girls In Gurgaon ❤️8448577510 ⊹Best Escorts Service In 24/7 Delh...
Russian Call Girls In Gurgaon ❤️8448577510 ⊹Best Escorts Service In 24/7 Delh...Russian Call Girls In Gurgaon ❤️8448577510 ⊹Best Escorts Service In 24/7 Delh...
Russian Call Girls In Gurgaon ❤️8448577510 ⊹Best Escorts Service In 24/7 Delh...
lizamodels9
 

Recently uploaded (20)

Call Girls Hebbal Just Call 👗 7737669865 👗 Top Class Call Girl Service Bangalore
Call Girls Hebbal Just Call 👗 7737669865 👗 Top Class Call Girl Service BangaloreCall Girls Hebbal Just Call 👗 7737669865 👗 Top Class Call Girl Service Bangalore
Call Girls Hebbal Just Call 👗 7737669865 👗 Top Class Call Girl Service Bangalore
 
Call Now ☎️🔝 9332606886🔝 Call Girls ❤ Service In Bhilwara Female Escorts Serv...
Call Now ☎️🔝 9332606886🔝 Call Girls ❤ Service In Bhilwara Female Escorts Serv...Call Now ☎️🔝 9332606886🔝 Call Girls ❤ Service In Bhilwara Female Escorts Serv...
Call Now ☎️🔝 9332606886🔝 Call Girls ❤ Service In Bhilwara Female Escorts Serv...
 
Nelamangala Call Girls: 🍓 7737669865 🍓 High Profile Model Escorts | Bangalore...
Nelamangala Call Girls: 🍓 7737669865 🍓 High Profile Model Escorts | Bangalore...Nelamangala Call Girls: 🍓 7737669865 🍓 High Profile Model Escorts | Bangalore...
Nelamangala Call Girls: 🍓 7737669865 🍓 High Profile Model Escorts | Bangalore...
 
It will be International Nurses' Day on 12 May
It will be International Nurses' Day on 12 MayIt will be International Nurses' Day on 12 May
It will be International Nurses' Day on 12 May
 
How to Get Started in Social Media for Art League City
How to Get Started in Social Media for Art League CityHow to Get Started in Social Media for Art League City
How to Get Started in Social Media for Art League City
 
unwanted pregnancy Kit [+918133066128] Abortion Pills IN Dubai UAE Abudhabi
unwanted pregnancy Kit [+918133066128] Abortion Pills IN Dubai UAE Abudhabiunwanted pregnancy Kit [+918133066128] Abortion Pills IN Dubai UAE Abudhabi
unwanted pregnancy Kit [+918133066128] Abortion Pills IN Dubai UAE Abudhabi
 
Falcon Invoice Discounting: Empowering Your Business Growth
Falcon Invoice Discounting: Empowering Your Business GrowthFalcon Invoice Discounting: Empowering Your Business Growth
Falcon Invoice Discounting: Empowering Your Business Growth
 
JAYNAGAR CALL GIRL IN 98274*61493 ❤CALL GIRLS IN ESCORT SERVICE❤CALL GIRL
JAYNAGAR CALL GIRL IN 98274*61493 ❤CALL GIRLS IN ESCORT SERVICE❤CALL GIRLJAYNAGAR CALL GIRL IN 98274*61493 ❤CALL GIRLS IN ESCORT SERVICE❤CALL GIRL
JAYNAGAR CALL GIRL IN 98274*61493 ❤CALL GIRLS IN ESCORT SERVICE❤CALL GIRL
 
Mysore Call Girls 8617370543 WhatsApp Number 24x7 Best Services
Mysore Call Girls 8617370543 WhatsApp Number 24x7 Best ServicesMysore Call Girls 8617370543 WhatsApp Number 24x7 Best Services
Mysore Call Girls 8617370543 WhatsApp Number 24x7 Best Services
 
Cracking the Cultural Competence Code.pptx
Cracking the Cultural Competence Code.pptxCracking the Cultural Competence Code.pptx
Cracking the Cultural Competence Code.pptx
 
Eluru Call Girls Service ☎ ️93326-06886 ❤️‍🔥 Enjoy 24/7 Escort Service
Eluru Call Girls Service ☎ ️93326-06886 ❤️‍🔥 Enjoy 24/7 Escort ServiceEluru Call Girls Service ☎ ️93326-06886 ❤️‍🔥 Enjoy 24/7 Escort Service
Eluru Call Girls Service ☎ ️93326-06886 ❤️‍🔥 Enjoy 24/7 Escort Service
 
Business Model Canvas (BMC)- A new venture concept
Business Model Canvas (BMC)-  A new venture conceptBusiness Model Canvas (BMC)-  A new venture concept
Business Model Canvas (BMC)- A new venture concept
 
PHX May 2024 Corporate Presentation Final
PHX May 2024 Corporate Presentation FinalPHX May 2024 Corporate Presentation Final
PHX May 2024 Corporate Presentation Final
 
Call Girls Electronic City Just Call 👗 7737669865 👗 Top Class Call Girl Servi...
Call Girls Electronic City Just Call 👗 7737669865 👗 Top Class Call Girl Servi...Call Girls Electronic City Just Call 👗 7737669865 👗 Top Class Call Girl Servi...
Call Girls Electronic City Just Call 👗 7737669865 👗 Top Class Call Girl Servi...
 
FULL ENJOY Call Girls In Mahipalpur Delhi Contact Us 8377877756
FULL ENJOY Call Girls In Mahipalpur Delhi Contact Us 8377877756FULL ENJOY Call Girls In Mahipalpur Delhi Contact Us 8377877756
FULL ENJOY Call Girls In Mahipalpur Delhi Contact Us 8377877756
 
Russian Call Girls In Gurgaon ❤️8448577510 ⊹Best Escorts Service In 24/7 Delh...
Russian Call Girls In Gurgaon ❤️8448577510 ⊹Best Escorts Service In 24/7 Delh...Russian Call Girls In Gurgaon ❤️8448577510 ⊹Best Escorts Service In 24/7 Delh...
Russian Call Girls In Gurgaon ❤️8448577510 ⊹Best Escorts Service In 24/7 Delh...
 
Dr. Admir Softic_ presentation_Green Club_ENG.pdf
Dr. Admir Softic_ presentation_Green Club_ENG.pdfDr. Admir Softic_ presentation_Green Club_ENG.pdf
Dr. Admir Softic_ presentation_Green Club_ENG.pdf
 
Uneak White's Personal Brand Exploration Presentation
Uneak White's Personal Brand Exploration PresentationUneak White's Personal Brand Exploration Presentation
Uneak White's Personal Brand Exploration Presentation
 
Falcon Invoice Discounting platform in india
Falcon Invoice Discounting platform in indiaFalcon Invoice Discounting platform in india
Falcon Invoice Discounting platform in india
 
Organizational Transformation Lead with Culture
Organizational Transformation Lead with CultureOrganizational Transformation Lead with Culture
Organizational Transformation Lead with Culture
 

FP&A analytics and Simpson’s Paradox

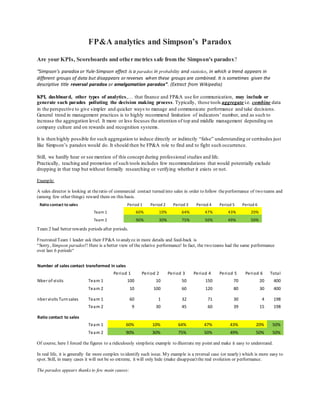
  • 1. FP&A analytics and Simpson’s Paradox Are your KPIs, Scoreboards and other metrics safe from the Simpson's paradox? “Simpson’s paradox or Yule-Simpson effect is a paradox in probability and statistics, in which a trend appears in different groups of data but disappears or reverses when these groups are combined. It is sometimes given the descriptive title reversal paradox or amalgamation paradox”. (Extract from Wikipedia) KPI, dashboard, other types of analytics,… that finance and FP&A use for communication, may include or generate such paradox polluting the decision making process. Typically, those tools aggregate i.e. combine data in the perspective to give simpler and quicker ways to manage and communicate performance and take decisions. General trend in management practices is to highly recommend limitation of indicators’ number, and as such to increase the aggregation level. It more or less focuses the attention of top and middle management depending on company culture and on rewards and recognition systems. It is then highly possible for such aggregation to induce directly or indirectly “false” understanding or certitudes just like Simpson’s paradox would do. It should then be FP&A role to find and to fight such occurrence. Still, we hardly hear or see mention of this concept during professional studies and life. Practically, teaching and promotion of such tools includes few recommendations that would potentially exclude dropping in that trap but without formally researching or verifying whether it exists or not. Example: A sales director is looking at theratio of commercial contact turned into sales in order to follow theperformance of two teams and (among few other things) reward them on this basis. Ratio contact to sales Period 1 Period 2 Period 3 Period 4 Period 5 Period 6 Team 1 60% 10% 64% 47% 43% 20% Team 2 90% 30% 75% 50% 49% 50% Team 2 had better rewards periods after periods. Frustrated Team 1 leader ask their FP&A to analyze in more details and feed-back is “Sorry, Simpson paradox!! Here is a better view of the relative performance! In fact, the two teams had the same performance over last 6 periods“ Number of sales contact transformed in sales Period 1 Period 2 Period 3 Period 4 Period 5 Period 6 Total Nber of visits Team 1 100 10 50 150 70 20 400 Team 2 10 100 60 120 80 30 400 nber visits Turnsales Team 1 60 1 32 71 30 4 198 Team 2 9 30 45 60 39 15 198 Ratio contact to sales Team 1 60% 10% 64% 47% 43% 20% 50% Team 2 90% 30% 75% 50% 49% 50% 50% Of course, here I forced the figures to a ridiculously simplistic example to illustrate my point and make it easy to understand. In real life, it is generally far more complex to identify such issue. My example is a reversal case (or nearly) which is more easy to spot. Still, in many cases it will not be so extreme, it will only hide (make disappear) the real evolution or performance. The paradox appears thanks to few main causes:
  • 2. 1. Dependent variables are hidden through the aggregation of data, 2. Difference of distribution in time (the example is it), 3. Difference of size between the data groups entering in the calculation. Similar examples can be found with return on investments, any given typeof expenses (say marketing) versus revenues, product lines revenue distribution or growth, etc.… (In fact, many of thewidely known ratios or indicators may very well includes or generate such effects if not properly customized and tested). This brings few questions: 1. Up to what point thisparadox is known (as such or in another form)? 2. How it is reflected into the definition and implementation of the company tools and processes? 3. How the verification is done? In my example, FP&A should have make sure the KPI was not reduced (aggregated)to such a level and demonstrate that a more comprehensive set of figures needs to be considered,this should have been made during the set-up of the company systems and FP&A should have “tell the story” behind those figures all along the process in such a way that recognition should have been more in line with performance. A period to date indicator (or a weighted indicator) would have been more representative e.g. Period to date 60% 55% 58% 53% 51% 50% 90% 35% 49% 50% 49% 50% In this example, it is highly intuitive, i.e. even without knowing about the paradox, a reasonably able person shall have made it happen. Still, reality can be far more complex and intuitive reasoning might not be sufficient to identify and adopt the right approach in each and every case, in particular, when the context is strongly oriented towards limiting the number of KPI, Indicators,… used by management. Who has not heard a manager saying “This is too much detail/figures, I just need to know (i.e. my compensation is only based on) these x indicators”. Obviously, this brings into picture a different subject i.e. the reward and recognition based on KPI, scoreboard and other metrics. Still, is it really different, if the metrics can reveal to be paradoxical?! Knowing (be conscious of) this paradox and systematically making sure to avoid its trap is then a key role for FP&A (i) when elaborating the systems and process that will be used (ii) when analyzing and commenting the ongoing results. We may try to draw a list of potentialcommon case but it remains a high level approach that cannot exempt from doing effectively the exercise.  Volume vs price evolution i.e. where your Revenue Indicators may hide more or less important shift in the price and/or volumes. Similar for external expenditures.  Regional differences, RI covering wide geographic reach may hide major evolutions in the respectiveareas,  Customer profiles differences, RI covering wide customers profiles may hide customer profile shift,  Product or market maturity phase, RI covering wide range may hide product or market maturity shift,  Currency effect, in particular when pricing currency is different from the entities currency and from the consolidation currency. Indicators expressed in consolidation currency will aggregate and then hide any currency effects and shift. This also applies to most costs.  Risk assessment or indicators,  Quality indicators,  Productivity indicators,  … Thoseapplicable to revenues (but not only) may very well combine altogether. An (hopefully over-simplistic) example would be a global company management concentrating on an overall revenue indicator mixing revenues from different geographic areas with product and markets in different maturity phasewhere customer profiles are evolving rapidly and where business is done in few pricing currencies but over a large number of legal entities (with different currencies then) and consolidating their results in its home currency. Such a global revenue indicator would mix so many effects and potentials evolutions that it may reveal paradoxical. Even more dangerous, as it may not have been a problem for few years i.e. whereas the potentialof an issue was there but the reality of the markets was not challenging (activating) it.
  • 3. We could bet in such a case that the information systems will“lose” the pricing currency within theconsolidation process, potentially shortcut theentity currency to consolidation currency effect too; will aggregate the product into a few product lines historically driving the company development, will probably lose track of the customers profiles among few other “simplifications” justified by the necessity to keep things more effective. Furthermore, the FP&A peoplemay be located in a limited number of shared service centers loosening the contact with local reality. Theend result would be that thewhole organization IS and processes, (probably culture) are cut from reality thanks to a basic misconception (lack of understanding/verification) during the process of defining and implementing tools. FP&A peoples do not need to know all the mathematics about this paradox. They still need to understand the concept, recognize that it may “slip in” when defining their tools and processes, KPI, Scoreboard and other metrics and then make sure it is not the case.