SlideShare a Scribd company logo
1 of 65
Download to read offline
Candlestick Patterns (Every trader should know)
A doji represents an equilibrium between supply and demand, a tug of war that neither the bulls
nor bears are winning. In the case of an uptrend, the bulls have by definition won previous battles
because prices have moved higher. Now, the outcome of the latest skirmish is in doubt. After a long
downtrend, the opposite is true. The bears have been victorious in previous battles, forcing prices
down. Now the bulls have found courage to buy, and the tide may be ready to turn.
For example = INET
Doji Star
A “long-legged” doji is a far more dramatic candle. It says that prices moved far higher on the
day, but then profit taking kicked in. Typically, a very large upper shadow is left. A close below the
midpoint of the candle shows a lot of weakness. Here’s an example of a long-legged doji.
For example = K
Long-legged Doji
A “gravestone doji” as the name implies, is probably the most ominous candle of all, on that
day, price rallied, but could not stand the altitude they achieved. By the end of the day. They came
back and closed at the same level. Here ’s an example of a gravestone doji:
A “Dragonfly” doji depicts a day on which prices opened high, sold off, and then returned to the
opening price. Dragonflies are fairly infrequent. When they do occur, however, they often resolve
bullishly (provided the stock is not already overbought as show by Bollinger bands and indicators such
as stochastic).
For example = DSGT
The hangman candle, so named because it looks like a person who has been executed with legs
swinging beneath, always occurs after an extended uptrend The hangman occurs because traders,
seeing a sell-off in the shares, rush in to grab the stock a bargain price.
In order for the Hanging Man signal to be valid, the following conditions must exist:
• The stock must have been in a definite uptrend before this signal occurs. This can be visually
seen on the chart.
• The lower shadow must be at least twice the size of the body.
• The day after the Hanging Man is formed, one should witness continued selling.
• There should be no upper shadow or a very small upper shadow. The colour of the body does
not matter, but a black body would be more positive than a white body.
For example = MC
The hammer puts in its appearance after prolonged downtrend. On the day of the hammer candle,
there is strong selling, often beginning at the opening bell. As the day goes on, however, the market
recovers and closes near the unchanged mark, or in some cased even higher. In these cases the
market potentially is “hammering” out a bottom.
In order for the Hammer signal to be valid, the following conditions must exist:
• The stock must have been in a definite downtrend before this signal occurs. This can be
visually seen on the chart.
• The lower shadow must be at least twice the size of the body.
• The day after the Hammer is formed, one should witness continued buying.
• There should be no upper shadow or a very small upper shadow. The colour of the body does
not matter, but a white body would be more positive than a black body.
For example = KCE
A bullish engulfing candle occurs after a significant downtrend. Note that the engulfing candle must
encompass the real body of the previous candle, but need not surround the shadow.
In order for the Bullish Engulfing signal to be valid, the following conditions must exist:
• The stock must have been in a definite downtrend before this signal occurs. This can be
visually seen on the chart.
• The second day of the signal should be a white candle opening below the Close of the previous
day and closing above the Open of the previous day’s black candle
For example = MINT
A bearish engulfing candle occurs after a significant uptrend. Again, the shadows need not be
surrounded.
In order for the Bullish Engulfing signal to be valid, the following conditions must exist:
• The stock must have been in a definite downtrend before this signal occurs. This can be
visually seen on the chart.
• The second day of the signal should be a white candle opening below the Close of the previous
day and closing above the Open of the previous day’s black candle.
.
For example = ECL
On the dark cloud cover day, the stock closes at least halfway into the previous white capping candle.
The larger the penetration of the previous candle (that is , the closer this candle is a being a bearish
engulfing), the more powerful the signal. Traders should pay particular attention to a dark cloud cover
candle if it occurs at an important resistance area and if the end of day volume is strong.
In order for the Dark Cloud signal to be valid, the following conditions must exist:
• The stock must have been in a definite uptrend before this signal occurs. This can be visually
seen on the chart.
• The second day of the signal should be a black candle opening above the high of the previous
day and closing more than half way into the body of the previous day’s white candle.
For example = SCN
The piercing pattern often will end a minor downtrend (a downtrend that often lasts between five a
fifteen trading days) The day before the piercing candle appears, the daily candle should ideally have a
fairly large dark real body, signifying a strong down day. In the classic piercing pattern, the next day’s
candle gaps below the lower shadow, or previous day’s low.
In order for the Piercing signal to be valid, the following conditions must exist:
• The stock must have been in a definite downtrend before this signal occurs. This can be
visually seen on the chart.
• The second day of the signal should be a white candle opening below the low of the previous
day and closing more than half way into the body of the previous day’s black candle
For example = SET INDEX
The evening star pattern occurs during a sustained uptrend. On the first day we see a candle with a
long white body. Everything looks normal and the bulls appear to have full control of the stock. Tn the
second day, however, a star candle occur. For this to be a valid evening star pattern, the stock must
gap higher on the day of the star. The star can be either black or white. A star candle has a small real
body and often contains a large upper shadow. On the third day, a candle with a black real body
emerges. This candle retreats substantially into the real body of the first day. The pattern is made
more powerful if there is a gap between the second and third day’s candles. However, this gap is
unusual, particularly when it comes to equity trading. The further this third candle retreats into the
real body of the first day’s candle, the more powerful the reversal signal.
For example = TRUE
The morning star, that on the first day there is a large dark candle. The middle day is not a perfect
star, because there is a small lower shadow, but the upper shadow on top of a small real body gives it
a star quality. The third candle is a large white candle that completes the reversal. Not how the third
candle recovered nearly to the highs of the first day and occurred on strong volume.
In order for the Morning Star signal to be valid, the following conditions must exist:
• The stock must have been in a definite downtrend before this signal occurs. This can be
visually seen on the chart.
• The first day of the signal must be a long dark body. The second day must be a day of
indecision. The third day should be a long white candle reaching at least halfway into the body
of the first day’s dark candle.
For example = VIBHA
The shooting star can appear only at a potential market top. If a shooting star occurs after a candle
with a large real body, typically it is that much stronger a warning because it shows that the price
cannot sustain high levels. The day the shooting star occurs, the market ideally should gap higher . The
stock should then rally sharply. At this point, it appears as though the longs are in complete control.
Sometime during the day, however, profit taking ensues. The stock closes near the unchanged market,
as shown by a small real body. Therefore a shooting star has a small real body and a large upper
shadow. Typically, there will be either no lower shadow or a very small one.
In order for the Shooting Star signal to be valid, the following conditions must exist:
• The stock must have been in a definite uptrend before this signal occurs. This can be visually
seen on the chart.
• The Upper shadow must be at least twice the size of the body.
• The day after the Shooting Star is formed, one should witness continued selling.
• There should be no lower shadow or a very small lower shadow. The colour of the body does
not matter, but a black
For example = WICE
The inverted hammer can only occur after a sustained downtrend, the stock is in all probability
already oversold. Therefore, the inverted hammer signifies that traders who have held long positions
in the security, most of whom are now showing large losses, often are quick to dump their shares by
selling into strength .
For example = STEC
The bullish harami candle can occur in either bullish or bearish trends, but the colors are reversed: A
large black body precedes a smaller white real body, and this gives out a bullish precedes a smaller
white real body, and this gives out a bullish signal: it implies that the stock is poised to move upward.
In signal: In either bullish or bearish haramis, the upper and lower shadows can be of any size, and
theoretically could even go above the real body of the clear candle day. In practice, however, the
harami day’s shadows often are small and typically are contained well within the real body of the
previous day’s candle.
In order for the Bullish Harami signal to be valid, the following conditions must exist:
• The stock must have been in a definite downtrend before this signal occurs. This can be
visually seen on the chart.
• The second day of the signal should be a white candle opening above the Close of the previous
day and closing below the Open of the previous day’s black candle.
For example = CPF
In order for the Bearish Harami signal to be valid, the following conditions must exist:
• The stock must have been in a definite uptrend before this signal occurs. This can be visually
seen on the chart.
• The second day of the signal should be a dark candle opening below the Close of the previous
day and closing above the Open of the previous day’s white candle.
For example = BBL
Marubozu means “close-cropped” Typically, the marubozu is a long candle that implies the day’s
trading range has been large. A marubozu candle lacks either an upper or lower shadow. On rare
occasions it can lack both a upper or lower shadow. When a full marubozu occurs, or one that is very
close to full, it is very well worth noting. If it is a white candle, then it signals extreme conviction
among buyers. Conversely, if it is a dark candle, then it indicates sellers were eager to flee. AS always,
you should pay careful attention to the nex day’s trading to see if there is follow through. A full or
nearly full marubozu implies that there is strong buying or selling interest depending on the color. If
there is follow through early the next day, the stock is likely to trend in that same direction for the
next few sessions. That awareness can be important for the trader.
For example = INTUCH
Spin top , the shadow are relatively small and the candle has a very small range. When combined with
low volume, traders may be expressing disinterest.
Spinning Top High Wave Definition:
A Spinning Top Wave, also called a High Wave candle, is candlestick that has an open and close price
near each other which produces a small real body and color is of no importance. They also have long
upper and lower shadows that significantly exceed the length of the body. These types of candlesticks
indicate indecision and subsequent consolidation.
Practical Use:
Technical analysts will often watch for Spinning Top High Wave candlesticks and then "join the
sidelines." After such a volatile session, traders will often wait for additional confirmation of an
upward or downward price movement.
For example = SET INDEX
High wave candle, on the other hand, portrays a situation where there is a active tug of war between
the bulls and bears. This candle shows a market has lost a clear sense of direction. If it occurs on high
volume, then it indicates the market’s general confusion about the direction prices are headed
• High Wave candles show the confusion among traders
• The size of the real body shows the lack of consensus among traders to sustain the current
trend
• Indicates an early sign of a possible shift in the current uptrend or downtrend
• The candle has a small real body of either color
• The size of both shadows are particularly long, but are not required to be the exact same
length
• Ignore in a trading range: price is pausing before breaking out
• Caution is recommended when encountering such candles
The three black crows candle formation does not happen very frequently in stock trading, but when
it does occur swing traders should be very alert to the crow’s caw. The candlestick’s metaphor is three
crows sitting in a tall tree. On the day the first black crow makes its appearance, the formation is most
predictive if the first “crow” or dark candlestick closes below the previous candle’s real body. Two
more long-bodied consecutive down days then ensue. On each of these days, it appears as if the stock
wants to regain its former strength, as the stock opens higher than the close on the previous day. By
the end of each session, however, the sellers regain control and the stock drops to a new closing low.
The three white soldiers pattern is most potent when it occurs after an extended decline and a
period of subsequent consolidation. When a particular stock posts a decline followed by sideways
movement, the appearance at that point of three white soldiers signals that higher prices are likely
ahead. The first of the three white soldiers is a reversal candle. It either ends a downtrend or signifies
that the stock Is moving out of a period of consolidation after a decline. The candle on day two may
open within the real body of day one. The pattern is valid as long as the candle of day two opens in the
upper half of day one’s ra nge. By the end of dy two, the stock should close near its high leaving a very
small or non-existent upper shadow. The same pattern is then repeated on day three.
For example = BEM
The tweezers formation always involves two candles. At a tweezers top, the high price of two nearby
sessions is identical or very nearly so. In a high priced stock there may be a few cents variation, and I
believer it should still be considered a tweezers. At a tweezers bottom, the low price of two sessions
that come in close succession is the same. For simplicity, lets talk just about the tweezers bottom. In
some instances, the tweezers bottom is formed by two real candlestick bodies that make an identical
low. In other instances, the lower shadows of two nearby candles touch the same price level and the
stock then bounces higher. A third possibility is that the lower shadow of one day and the real body of
a nearby session hit the same bottom level.
For example = BH
For example = STEC
Stick Sandwich
It occurs during a Downtrend; confirmation is required by the candles that follow the Pattern.
– The First Candle is black, it has a short Lower shadow (Or it has not a Lower Shadow) that
represents a new Low in the Downtrend.
– The Second Candle is white, it has the Open above the Close of the First Candle (The Real Body is
above the close of the First Candle).
– The Third Candle is black, it has the Open above the Close of the Second Candle whereas it has the
Close at the same level (More or less) of the Close of the First Candle (So that it fully contains the Real
Body of the Second Candle).
– It occurs during an Uptrend; confirmation is required by the candles that follow the Pattern.
– The First Candle is white, it has a short Upper shadow (Or it has not an Upper Shadow) that
represents a new High in the Uptrend.
– The Second Candle is black, it has the Close below the Open of the First Candle (The Real Body is
below the Close of the First Candle).
– The Third Candle is white, it has the Open below the Close of the Second Candle whereas it has the
Close at the same level (More or less) of the Close of the First Candle (So that it fully contains the Real
Body of the Second Candle).
Dumpling top pattern
Normally it should be a signal of Bearish reversal of the current Trend.
– It occurs during an Uptrend; confirmation is required by the candles that follow the Pattern.
– The Pattern starts during an Uptrend, then it becomes a “Sideways” Trend (That represents the
indecision of the Markets); at the end of the Pattern, there is a reversal in the direction of the Trend
and it becomes a Downtrend.
– This Pattern is quite rare; is important that there is a Gap Down after the “Sideways” Trend and just
before the start of the Downtrend (To obtain a further confirmation of the reversal of the Trend, as
the Pattern suggests).
For example = BTS
Fry pan bottom pattern
– Normally it should be a signal of Bullish reversal of the current Trend.
– It occurs during a Downtrend; confirmation is required by the candles that follow the Pattern.
– The Pattern starts during a Downtrend, then it becomes a “Sideways” Trend (That represents the
indecision of the Markets); at the end of the Pattern, there is a reversal in the direction of the Trend
and it becomes an Uptrend.
– This Pattern is quite rare; is important that there is a Gap Up after the “Sideways” Trend and just
before the start of the Uptrend (To obtain a further confirmation of the reversal of the Trend, as the
Pattern suggests).
For example = BLA
Tower top pattern
It occurs during an Uptrend; confirmation is required by the candles that follow the Pattern.
– The First Candle is long and white.
– The next Candles that are in the “Sideways” Phase, are Spinning Tops (Black or white) and they
show the indecision of the Market.
– The Last Candle is long and black, that is the start of the reversal of the current Trend.
For example = MDX
Tower bottom pattern
– It occurs during a Downtrend; confirmation is required by the candles that follow the Pattern.
– The First Candle is long and black.
– The next Candles that are in the “Sideways” Phase, are Spinning Tops (Black or white) and they
show the indecision of the Market.
– The Last Candle is long and white, that is the start of the reversal of the current Trend.
For example = SMPC
Mat Hold pattern
It occurs during an Uptrend; confirmation is required by the candles that follow the Pattern.
– The First Candle is long and white.
– Then there is a Gap Up between the First and Second Candle.
– The Second Candle is black, it has a short Real Body; moreover it has the Close above the Close of
the First Candle.
– The Third Candle can be white or black (It doesn’t matter), but it has a short Real Body.
– The Fourth Candle is black, with a short Real Body.
– The Second, Third and Fourth Candle represent a decline in prices; moreover their Real Bodies are
above the Low of the First Candle.
– The Fifth Candle is long and white; it has the Close above the High of the Second Candle.
– It occurs during a Downtrend; confirmation is required by the candles that follow the Pattern.
– The First Candle is long and black.
– Then there is a Gap Down between the First and Second Candle.
– The Second Candle is white, it has a short Real Body; moreover it has the Close below the Close of
the First Candle.
– The Third Candle can be white or black (It doesn’t matter), but it has a short Real Body.
– The Fourth Candle is white, with a short Real Body.
– The Second, Third and Fourth Candle represent a rise in prices; moreover their Real Bodies are
below the High of the First Candle.
– The Fifth Candle is long and black; it has the Close below the Low of the Second Candle.
For example = JAS
For example = QTC
Abandoned baby pattern
– It occurs during a Downtrend; confirmation is not required by the candles that follow the Pattern
(Although it’s better if you search for confirmation).
– The First Candle is long and black.
– The Second Candle is a Doji Candle, that gaps down from the Previous Candle.
– The Third Candle is long and white; it has the Open above the Second Candle.
Tri star doji
It occurs during a Downtrend; confirmation is required by the candles that follow the Pattern.
– The Second Doji is below the other Two Doji Candles.
Above below the Stomach pattern
– Normally it should be a signal of reversal of the current Trend.
– You can find it in the variants: Above and Below, depending on the Trend in which is located.
Below The Stomach
– It occurs during an Uptrend; confirmation is required by the candles that follow the Pattern .
– The First Candle is long and white.
– The Second Candle is black (Although it could be also white); it has the Open below or at the same
level of the midpoint of the Real Body of the First Candle. Whereas it has the Close below the Open of
the First Candle and below the midpoint of the Real Body of the First Candle (In the case which the
Second Candle is black).
Thrusting Line
– Normally it should be a signal of continuation of the current Trend.
– It occurs during a Downtrend or an Uptrend; confirmation is required by the candles that follow the
Pattern.
– The Pattern is characterized by Two Candles of opposite color (Black and white in case of a
Downtrend; white and black in case of an Uptrend).
The First Candle is long and black (In case of a Downtrend) or is long and white (In case of an
Uptrend).
– The Second Candle has the Open below the Low of the First Candle, whereas it has the Close near
(But below) the Midpoint of the Real Body of the First Candle (In case of a Downtrend). The Second
Candle has the Open above the High of the First Candle, whereas it has the Close near (But above) the
Midpoint of the Real Body of the First Candle (In case of an Uptrend).
Separating Line pattern
– Normally it should be a signal of continuation of the current Trend.
– You can find it in the variants: Bullish and Bearish, depending on the Trend in which is located.
Bearish Separating line
– It occurs during a Downtrend; confirmation is required by the candles that follow the Pattern.
– The First Candle is long and white.
– The Second Candle is long and black; it has the Open at the same level (More or less) of the Open of
the First Candle.
Three line Strike
– Normally it should be a signal of continuation of the current Trend.
– You can find it in the variants: Bullish and Bearish, depending on the Trend in which is located.
– It occurs during an Uptrend; confirmation is required by the candles that follow the Pattern.
– The First, Second and Third Candle are white; moreover each Candle has the Close above the Close
of the Previous Candle.
– The Fourth Candle is long and black; it has the Open above the Open of the Previous Candles while
it has the Close below the Open of the First Candle (The Fourth Candle fully contains within his Real
Body the Three Previous Candles).
Meeting line pattern
– It occurs during a Downtrend; confirmation is required by the candles that follow the Pattern.
– The First Candle is long and black.
– The Second Candle is long and white; it has the Close at the same level (More or Less) of the Close of
the First Candle.
– It occurs during an Uptrend; confirmation is required by the candles that follow the Pattern.
– The First Candle is long and white.
– The Second Candle is long and black; it has the Close at the same level (More or Less) of the Close of
the First Candle.
Low price gapping play
– Normally it should be a signal of continuation of the current Trend.
– It occurs during a Downtrend; confirmation is required by the candles that follow the Pattern.
– The First Candle is long and black.
– The Second, Third and Fourth Candle, have a short Real Body and they are near the level of the Low
of the First Candle.
– The Fifth Candle is long and black, that gaps down from the Previous Candle.
– The “Sideways” Period, can contain up to Eleven Candles (Not necessarily Three Candles); these
candles are the Spinning Tops (That have short Real Body).
For example = AP
High price gapping play
– Normally it should be a signal of continuation of the current Trend.
– It occurs during an Uptrend; confirmation is required by the candles that follow the Pattern.
– The First Candle is long and white.
– The Second, Third and Fourth Candle, have a short Real Body and they are near the level of the High
of the First Candle.
– The Fifth Candle is long and white, that gaps up from the Previous Candle.
– The “Sideways” Period, can contain up to Eleven Candles (Not necessarily Three Candles); these
candles are the Spinning Tops (That have short Real Body).
Homing Pigeon pattern
– Normally it should be a signal of Bullish reversal of the current Trend.
– It occurs during a Downtrend; confirmation is required by the candles that follow the Pattern.
– The First Candle is long and black, whereas the Second Candle is black but is shorter than the First
Candle. The Real Body of the Second Candle is fully contained within the Real Body of the First Candle.
– Confirmation of the Pattern and the reversal of the Trend: when the Close of a Candle that follows
the “Homing Pigeon” is below the Lowest Low of the Two Candle of the Homing Pigeon.
For example = IRPC
8-10-12-13 New price lines
– It occurs during an Uptrend; confirmation is required by the candles that follow the Pattern.
– The Pattern is characterized by eight consecutive candles, each with a higher High.
– To obtain a further confirmation of the Pattern, you should check the Close of the last Candle Line:
if it is over the Top of the Real Body of the Previous Candle, there are more chances that there will be
a rise in Prices. If the Close is below the Top of the Real Body of the Previous Candle , there are more
chances that there will be a fall in Prices.
For example = FTSE
Scoop pattern
– It occurs during a Sideways Trend; confirmation is required by the candles that follow the Pattern.
– The Pattern starts showing the indecision of the Markets (Spinning Tops, Doji, Small Candles, etc… ).
(1)
– Then the Price starts to fall (Probably due to some Traders that expected a rise in the prices, but
now that the trend is sideways they are selling because they do not believe anymore in a possible
rise). (2)
– This decline in Prices attracts other Traders, that hope in a possible Rise in the Prices after the fall.
For this reason the prices start to rise: if the prices go above the phase of indecision, it will begin a
new Uptrend; if not, the Pattern will fail. (3)
J-Hook pattern and Inverted J-Hook pattern
– Normally it should be a signal of continuation of the current Trend.
– It occurs during an Uptrend; confirmation is required by the candles that follow the Pattern.
– The Pattern starts with a rapid increase in the Prices. (1)
– Then there is a Candlestick Pattern that gives a bearish signal (So the Traders start to sell). (2)
– The prices fall, then reach a level of “indecision”; at the end of this phase of indecision, there should
be a Bullish signal. (3)
– The prices start to rise and they reach the Previous High (The one formed from the Phase (1) ). If the
prices keep rising, going above this High, there should be a new Uptrend in Prices.
– If the prices don’t go above the High, the Pattern has failed; in this case the Pattern creates the
Double Top Pattern (A pattern from the Technical analysis).
For example = KCE
For example = SAPPE
Cradle pattern
Normally it should be a signal of reversal of the current Trend.
– It occurs during a Downtrend; confirmation is required by the candles that follow the Pattern.
– The Pattern starts with a long and black Candle, during a downtrend (Due to the Traders that are
selling because they are worried by the downtrend).
– Then there is a phase of indecision in the Prices (There are Doji Candles, Spinning Tops, Hammer,
Inverted Hammer), so the Prices remain in a precarious balance.
– At the end of the Pattern, starts a rise in the Prices with a long and white Candle (That shows the
strength of the rise).
For example = SMPC
Rising three methods
– It occurs during an Uptrend; confirmation is required by the candles that follow the Pattern.
– The First and Fifth Candle are white and are longer than the other Three Candles of the Pattern.
– The Second, Third and Fourth Candle are black (Or they alternate the color: it only matters that
they represent a Decline in Prices; normally is the Third Candle that can be of any color). Moreover
these Candles are fully contained within the Real Body of the First Candle (or within the High-Low
Range of the First Candle); while the Lows are above the Open of the First Candle and the Highs are
below the Close of the First Candle.
– The Close of the Fifth Candle is above the Close of the First Candle
For example = SPA
Falling Three Methods
– It occurs during a Downtrend; confirmation is required by the candles that follow the Pattern.
– The First and Fifth Candle are black and are longer than the other Three Candles of the Pattern.
– The Second, Third and Fourth Candle are white(Or they alternate the color: it only matters that they
represent a Rise in Prices; normally is the Third Candle that can be of any color). Moreover these
Candles are fully contained within the Real Body of the First Candle (or within the High-Low Range of
the First Candle); while the Lows are below the Open of the First Candle and the Highs are above the
Close of the First Candle.
– The Close of the Fifth Candle is below the Close of the First Candle.
For example = DTAC
Deliberation pattern or Stalled pattern
– It occurs during an Uptrend; confirmation is required by the candles that follow the Pattern.
– Normally it should be a signal of Bearish reversal of the current Trend.
– The Pattern is composed by Three White Candles: the First One and the Second One have their Real
Body longer than the Real Body of the Third Candle.
– The Open and Close of each Candle, should be higher then The Open and Close of the Previous
Candle.
– The Third Candle has a short Real Body, it can be also a Doji Candle; moreover, it has an Upper
Shadow very tall. Lastly, it has the Open near the level of the Close of the Second Candle.
– The confirmation of the Bearish Reversal could be from the next Candles, when one of them (While
is falling) overcomes the midpoint of the Real Body of the Second Candle.
Advance block pattern
– It occurs during an Uptrend; confirmation is required by the candles that follow the Pattern.
– Normally it should be a signal of Bearish reversal of the current Trend.
– The Pattern is composed by Three White Candles, that gradually have a shorter Real Body.
– The Open of the Second and Third Candle should be within the Real Body of the Previous Candle.
– The Close of the Candles are often far away from their respective Highs.
– The Shadows of the Candles are gradually taller, especially the Upper Shadows of the Last Two
Candles.
– The confirmation of the Bearish Reversal could be from the next Candles, when one of them (While
is falling) overcomes the midpoint of the Real Body of the First Candle.
Kicker
You can see in the above graphic why this pattern is so explosive. Like most candle patterns
there is a bullish and bearish version. In the bullish version, the stock is moving down and the
last red candle closes at the bottom of the range.
Then, on the next day, the stock gaps open above the previous days high and close. This
"shock event" forces short sellers to cover and brings in new traders on the long side.
This is reversed in the bearish version.
FOR EXAMPLE = MINT
BULLISH UNIQUE THREE RIVER BOTTOM
Definition
This is a three-candlestick pattern that somewhat looks like the Bullish Morning Star. It appears in a
downtrend. The first day’s black candlestick engulfs the following small black body, which
characteristically has a long lower shadow. The pattern is completed by a small white body, which
closes below the close of the second day.
Recognition Criteria
1.The market is characterized by a prevailing downtrend.
2. A black candlestick is observed on the first day.
3. The second day is a black body that opens higher, trades at a new low, and then closes near the
high.
4. The third day is a short white day below the second day.
BULLISH DOWNSIDE GAP TWO RABBITS
Definition
This is a three-candlestick bullish reversal pattern. The gap between the white body of the second day
and the black body of the first day represents the downside gap. The white candlesticks of the second
and third day represent the rabbits ready to jump out of their burrow.
Recognition Criteria
1. The market is characterized by a prevailing downtrend.
2. A normal or long black candlestick appears on the first day.
3. The second day is a short white candlestick that gaps down.
4. On the last day another white candlestick appears that opens at or below the open, and then closes
above the close of the previous day, but still below the close of the first day.
BULLISH THREE STARS IN THE SOUTH
Definition
This pattern consists of three consecutive black candlesticks which have consecutively lower closes
and higher lows in a slowly deteriorating downtrend.
Recognition Criteria
1. The market is characterized by a prevailing downtrend.
2. A black candlestick with almost no upper shadow and a long lower shadow appears on the first day.
3. The next day is another black candlestick closing below the previous day’s close and having an
opening in the range of the previous day’s body. However, it has a higher low.
4. The last day is a small black Marubozu with a higher low.
BULLISH CONCEALING BABY SWALLOW
Definition
This is a pattern formed by four black candlesticks. After two falling Black Marubozu days, a short
down day engulfed by a fourth black day shows that the downtrend has eroded significantly, despite
the final close is at a new low.
Recognition Criteria
1. Two falling Black Marubozu days at the beginning confirms the downtrend.
2. The third day is a short black with downside gap. However, this day trades into the previous day’s
body, producing a long upper shadow.
3. The fourth black day completely engulfs the third day including the shadow.
BULLISH LADDER BOTTOM
Definition
This is a five candlestick pattern that starts with three strong black candlesticks. The downtrend
continues with the fourth lower close. The next day gaps higher and closes much higher than the
previous day or two. This may imply a bullish reversal.
Recognition Criteria
1. The market is characterized by a prevailing downtrend.
2. Three strong black candlesticks occur much like the Three Black Crows pattern.
3. The fourth black candlestick closes also lower but has a long upper shadow.
4. The fifth day is a strong white with an open above the previous day’s body.
BULLISH AFTER BOTTOM GAP UP
Definition
This is a five candlestick pattern that starts with three black candlesticks. The market signals a bottom
reversal with the change in the color at the fourth candlestick. The next day gaps higher and makes a
strong upward move, confirming the reversal.
Recognition Criteria
1. The pattern begins with a black candlestick.
2. The next two days are also black days, and each one closes lower than the previous day’s close.
3. The third day gaps down and opens below the close of the second day.
4. The fourth day is white.
BULLISH DESCENT BLOCK
Definition
This pattern consists of three consecutive black candlesticks with consecutively lower closes in a
downtrend. It is the compliment of the Bearish Advanced Block Pattern.
Recognition Criteria
1. The market is characterized by a prevailing downtrend.
2. A black candlestick appears on the first day.
3. The next two days are black candlesticks with each closing below the previous day’s close and
having an opening in the range of the previous day’s body.
4. The last two days have long lower shadows.
Pattern Requirements and Flexibility
The first candlestick of a Bullish Descent Block should be a normal or long black candlestick. The
following consecutive black candlesticks must open within the range of the previous day’s body, and
close below the previous day’s close. The bodies of the three black candlesticks should get shorter,
while the lower shadows get longer.
BULLISH DELIBERATION BLOCK
Definition
This pattern consists of three consecutive black candlesticks with consecutively lower closes in a
downtrend. It is the compliment of the Bearish Deliberation Block Pattern.
Recognition Criteria
1. Market is characterized by a prevailing downtrend.
2. A black candlestick appears on the first day.
3. The next day is another black candlestick, which opens in the range of the previous day’s body and
closes below the previous day’s close.
4. The final day is a short black candlestick, a spinning top or a Doji that gaps down below the second
day.
Pattern Requirements and Flexibility
The first two black candlesticks appearing in the Bullish Deliberation Block should not be short. The
second day should open at or higher than the close of the first day, while the close of the second day
should be at or below the close of the first day. The gapping down third candlestick can be a short
black candlestick or a Doji.
BULLISH SQUEEZE ALERT
Definition
This is a three-day bullish reversal pattern. It was developed because of the frequent event where
prices can break to the upside following this pattern, especially if the pattern is preceded by a strong
downside move.
Recognition Criteria
1. The market is characterized by a prevailing downtrend.
2. A black candlestick appears on the first day.
3. The second and third days each have lower highs and higher lows than the previous day. Their color
is not important.
4. The sizes of the bodies of the three days do not matter.
Pattern Requirements and Flexibility
The first candlestick should be a black candlestick. The other two candlesticks can be of any color and
length but they should have lower highs and higher lows consecutively.
BULLISH AFTER BOTTOM GAP UP
Definition
This is a five candlestick pattern that starts with three black candlesticks. The market signals a bottom
reversal with the change in the color at the fourth candlestick. The next day gaps higher and makes a
strong upward move, confirming the reversal.
Recognition Criteria
1. The pattern begins with a black candlestick.
2. The next two days are also black days, and each one closes lower than the previous day’s close.
3. The third day gaps down and opens below the close of the second day.
4. The fourth day is white.
4. The fifth day is a strong white with an open forming (causing) a gap above the previous day’s close.
Pattern Requirements and Flexibility
The first three days of the Bullish After Bottom Gap Up are strong black candlesticks with consecutive
lower opens and lower closes. The third black should gap down. The fourth day is a white candlestick
that opens higher and covers the gap. The fifth day is a strong white candlestick that makes a body
gap with the fourth day. There are no short candlesticks in this pattern.
ON NECK LINE
(ate kubi)
Description
The On Neck Line pattern is almost a 'meeting line pattern', but the critical term is 'almost'.
The ON Neck pattern does not reach the previous day's close; it only reaches the previous
day's low.
Criteria
1. A long black candle forms in a downtrend.
2. The next day gaps down from the previous day's close; howver, the body is usally smaller
than one seen in the meeting line pattern.
3. The second day closes at the low of the previous day.
Pattern Psychology
After a market has been moving in a downward direction, a long black candle enhances the
downtrend. The next day opens lower, a small gap down, but the trend is halted by a move
back up to the previous day's low. The buyers in this upmove should be uncomfortable that
threre was not more strength in the upm,ove. The sellers step back in the next dya to
continue the downtrend.
IN NECK LINE
(iri kubi)
Description
The In Neck pattern is almost a Meeting Line pattern. I t has the same description as the On Neck
pattern except that it closes at or slightly above the previous day's close. Confirmation is suggested.
The In Neck Line indicates some short covering, but not a change in trend direction.
Criteria
1. A long black candle forms in a downtrend
2. The next day gaps down from the previous day's close; howver, the body is usally smaller than
one seen in the Meeting Line pattern.
3. The second day closes at the close or just slightly above the close of the previous day.
Pattern Psychology
This is the same scenario as the On Neck pattern. After a market has been moving in a downward
direction, a long black candles enhances the downtrend. The next day opens lower, a small gap down,
but the trend is halted by a move back up to the previous day's low. The buyers in this upmove should
be uncomfortable that there was not more strength in the upmove. The sellers step back in the next
day to continue the downtrend
THRUSTING
Description
The Thrusting pattern is almost an 'On Neck' or an 'In Neck' pattern and resembles the Meeting Line
pattern, also. It has the same description as the 'On Neck' pattern except that it closes near, but
slightly below the midpoint of the previous day's black body.
Criteria
1. A long black candle forms in a downtrend.
2. The next day gaps down from the previous day's close; however, the body is usually bigger than
the ones found in the On Neck and In Neck patterns.
3. The second day closes just slightly below the midpoint of the previous day's candle.
Pattern Pasychology
This is the same scenario as the 'On neck' pattern. After a market has been moving in a downward
direction, a long black candle enhances the downtrend. The next day opens lower, a small gap down,
but the trend is halted by a move back up to the previous day's low. The buyers in this upmove should
be uncomfortable that there was not more strength in the upmove. The sellers step back in the next
day to continue the downtrend. It is a little stronger than the On neck and In Neck patters, but not
quite as strong as the Piercing Line pattern.
SIDE-BY-SIDE WHITE LINES - Continuation Pattern
(narabi aka)
Description
Side-by-Side White Lines are found in uptrends. Two white candles form side-by-side after gapping up
from the previous white candle. Narabi in Japanese means 'in a row'. Narabi aka means "whites in a
row,; Side-by-Side Lines, black or white, indicate a pause or stalemate when they are observed by
themselves. In this case, the stock market data has a different meaning because they occur after a gap
in the trend's direction.
Criteria
1. An uptrend is in progress. A gap occurs between two candles of the same co9lor.
2. The color the first two candles is the same as the prevailing trend.
3. The third day, a candle opens at the same or near the open price of the previous day.
4. The third day closed near the close of the previous day.
HOMING PIGEON
Description
The Homing Pigeon is the same as the Harami, except for the color of the second day's body. The
pattern is composed of a two-candle formation in a down trending market. Both candles are the same
color as the current trend. The first body of the pattern is a long body, the second body is smaller. The
open and the close of the second day occurs inside the open and the close of the previous day. Its
presence indicates that the trend is over.
Criteria
1. The body of the first candle is black; the body of the second candle is black.
2. The downtrend has been evident for a good period. A long black candle occurs at the end of the
trend.
3. The second day opens higher than the close of the previous day and closes lower than the open
but above the closing price of the prior day.
4. Unlike the Western Inside Day, just the body needs to remain in the previous day's body; where
as the Inside Day requires both the body and the shadows to remain inside the previous day's
body.
5. For a reversal signal, further confirmation is required to indicate that the trend is moving up.
Signal Enhancements
The higher the second candle closes up on the first black candle, the more convincing that a
reversal has occurred.
Pattern Psychology
After a strong downtrend has been in effect and after a long black candle, the bulls open the price
higher than the previous close. The shorts get concerned and start covering. The price finishes lower
for the day but not as low as the previous day. This is enough support to have the short sellers take
notice that the trend has been violated. A strong day after that would convince everybody that the
trend was reversing. Usually the volume is above the recent norm due to the unwinding of short
positions.
MATCHING LOW
Description
The Matching Low pattern is similar to the Homing Pigeon patter, the exception being that the two
days of the pattern close on their lows, at the same level. After a long downtrend, recognizing that the
price has closed at the same level without going through is an indication to the bears that the bottom
has been hit.
Criteria
1. The body of the first candle is black; the blody of the second candle is black.
2. The downtrend has been evident for a good period. A long black candles occurs at the end of the
trend.
3. The second day opens higher than the close of hte previous day and closes at the same close as
the prior day.
4. For a reversal signal, further confirmation is required to indicate that the trend is moving up.
Pattern Psychology
After a strong downtrend has been in effect and after a long black candle, the bulls open the price
higher than the previous close. The shorts get concerned and start covering. However, the bears sitll
have enough control to close the price at the low of the day, the low being the same as the close of
the previous day. The psychological impact for hte bears is that it couldn't close below the previous
close, thus causing concern that this is a support level.

More Related Content

What's hot

Stop Trading Support And Resistance The Wrong Way
Stop Trading Support And Resistance The Wrong WayStop Trading Support And Resistance The Wrong Way
Stop Trading Support And Resistance The Wrong WayNetpicksTrading
 
ESTRATEGIAS-OLIVER VELEZ.pptx
ESTRATEGIAS-OLIVER VELEZ.pptxESTRATEGIAS-OLIVER VELEZ.pptx
ESTRATEGIAS-OLIVER VELEZ.pptxEliseoVera5
 
Understanding Japanese Candlesticks in Forex Trading by valentino heavens
Understanding Japanese Candlesticks in Forex Trading by valentino heavensUnderstanding Japanese Candlesticks in Forex Trading by valentino heavens
Understanding Japanese Candlesticks in Forex Trading by valentino heavensValentino Heavens
 
Best strategies for trading
Best strategies for tradingBest strategies for trading
Best strategies for tradingTeyYeeShen
 
Technical-Analysis-presentation.pdf
Technical-Analysis-presentation.pdfTechnical-Analysis-presentation.pdf
Technical-Analysis-presentation.pdfOeli3
 
Candlestick patterns
Candlestick patternsCandlestick patterns
Candlestick patternsNSEData.com
 
Price action trading1
Price action trading1Price action trading1
Price action trading1labyo
 
Introduction to Technical Analysis
Introduction to Technical AnalysisIntroduction to Technical Analysis
Introduction to Technical Analysismediafin
 
Candlestick Quick Reference Guide
Candlestick Quick Reference GuideCandlestick Quick Reference Guide
Candlestick Quick Reference GuideLiu's Willian
 
candlestick pattern trading strategy ,What is Hammer candlestick ? Technical ...
candlestick pattern trading strategy ,What is Hammer candlestick ? Technical ...candlestick pattern trading strategy ,What is Hammer candlestick ? Technical ...
candlestick pattern trading strategy ,What is Hammer candlestick ? Technical ...Alok kumar
 
Techincal analysis chart patterns part 2
Techincal analysis chart patterns part 2Techincal analysis chart patterns part 2
Techincal analysis chart patterns part 2Indranil Bhattacharjee
 
How to read japanese candlesticks
How to read japanese candlesticksHow to read japanese candlesticks
How to read japanese candlesticksJustForex
 
mastering-candlestick-charts-part-i
mastering-candlestick-charts-part-imastering-candlestick-charts-part-i
mastering-candlestick-charts-part-iBoyEnvi BoyEnvi
 
Soporte y resistencia.
Soporte y resistencia.Soporte y resistencia.
Soporte y resistencia.besgle
 
Lesson-6 Candle Stick Session.ppt
Lesson-6 Candle Stick Session.pptLesson-6 Candle Stick Session.ppt
Lesson-6 Candle Stick Session.pptTithiDas30
 
Classical Methods - Chapter 26 - Part I - Japanese Candle Stick Pattern - Bas...
Classical Methods - Chapter 26 - Part I - Japanese Candle Stick Pattern - Bas...Classical Methods - Chapter 26 - Part I - Japanese Candle Stick Pattern - Bas...
Classical Methods - Chapter 26 - Part I - Japanese Candle Stick Pattern - Bas...Professional Training Academy
 
Candlestick presentation
Candlestick presentationCandlestick presentation
Candlestick presentationJenn Astwood
 
Trading With Candlestick Charts
Trading With Candlestick ChartsTrading With Candlestick Charts
Trading With Candlestick ChartsVivek Rattan
 

What's hot (20)

Stop Trading Support And Resistance The Wrong Way
Stop Trading Support And Resistance The Wrong WayStop Trading Support And Resistance The Wrong Way
Stop Trading Support And Resistance The Wrong Way
 
ESTRATEGIAS-OLIVER VELEZ.pptx
ESTRATEGIAS-OLIVER VELEZ.pptxESTRATEGIAS-OLIVER VELEZ.pptx
ESTRATEGIAS-OLIVER VELEZ.pptx
 
Understanding Japanese Candlesticks in Forex Trading by valentino heavens
Understanding Japanese Candlesticks in Forex Trading by valentino heavensUnderstanding Japanese Candlesticks in Forex Trading by valentino heavens
Understanding Japanese Candlesticks in Forex Trading by valentino heavens
 
Best strategies for trading
Best strategies for tradingBest strategies for trading
Best strategies for trading
 
Technical-Analysis-presentation.pdf
Technical-Analysis-presentation.pdfTechnical-Analysis-presentation.pdf
Technical-Analysis-presentation.pdf
 
Candlestick patterns
Candlestick patternsCandlestick patterns
Candlestick patterns
 
Price action trading1
Price action trading1Price action trading1
Price action trading1
 
Introduction to Technical Analysis
Introduction to Technical AnalysisIntroduction to Technical Analysis
Introduction to Technical Analysis
 
Candlestick Quick Reference Guide
Candlestick Quick Reference GuideCandlestick Quick Reference Guide
Candlestick Quick Reference Guide
 
The Technical Analysis Guidebook
The Technical Analysis GuidebookThe Technical Analysis Guidebook
The Technical Analysis Guidebook
 
RSI Strategy
RSI StrategyRSI Strategy
RSI Strategy
 
candlestick pattern trading strategy ,What is Hammer candlestick ? Technical ...
candlestick pattern trading strategy ,What is Hammer candlestick ? Technical ...candlestick pattern trading strategy ,What is Hammer candlestick ? Technical ...
candlestick pattern trading strategy ,What is Hammer candlestick ? Technical ...
 
Techincal analysis chart patterns part 2
Techincal analysis chart patterns part 2Techincal analysis chart patterns part 2
Techincal analysis chart patterns part 2
 
How to read japanese candlesticks
How to read japanese candlesticksHow to read japanese candlesticks
How to read japanese candlesticks
 
mastering-candlestick-charts-part-i
mastering-candlestick-charts-part-imastering-candlestick-charts-part-i
mastering-candlestick-charts-part-i
 
Soporte y resistencia.
Soporte y resistencia.Soporte y resistencia.
Soporte y resistencia.
 
Lesson-6 Candle Stick Session.ppt
Lesson-6 Candle Stick Session.pptLesson-6 Candle Stick Session.ppt
Lesson-6 Candle Stick Session.ppt
 
Classical Methods - Chapter 26 - Part I - Japanese Candle Stick Pattern - Bas...
Classical Methods - Chapter 26 - Part I - Japanese Candle Stick Pattern - Bas...Classical Methods - Chapter 26 - Part I - Japanese Candle Stick Pattern - Bas...
Classical Methods - Chapter 26 - Part I - Japanese Candle Stick Pattern - Bas...
 
Candlestick presentation
Candlestick presentationCandlestick presentation
Candlestick presentation
 
Trading With Candlestick Charts
Trading With Candlestick ChartsTrading With Candlestick Charts
Trading With Candlestick Charts
 

Similar to 21_Candlesticks.pdf

Candlesticks The Basics
Candlesticks   The Basics Candlesticks   The Basics
Candlesticks The Basics K W
 
Multiple candlesticks.pptx
Multiple candlesticks.pptxMultiple candlesticks.pptx
Multiple candlesticks.pptxPadmanavRout
 
Best 30 Candlestick Pattern You Should Have To Know
Best 30 Candlestick Pattern You Should Have To KnowBest 30 Candlestick Pattern You Should Have To Know
Best 30 Candlestick Pattern You Should Have To KnowStockia
 
Teoria dos candlesticks
Teoria dos candlesticksTeoria dos candlesticks
Teoria dos candlesticksGrupo Shield
 
Technical analysis finance
Technical analysis financeTechnical analysis finance
Technical analysis financeHittttesh
 
TECHNICAL ANALYSIS PART II.pdf
TECHNICAL ANALYSIS PART II.pdfTECHNICAL ANALYSIS PART II.pdf
TECHNICAL ANALYSIS PART II.pdfRealTrader2
 
Kishore Mirchumal Mansinghani
Kishore Mirchumal MansinghaniKishore Mirchumal Mansinghani
Kishore Mirchumal MansinghaniPowerup Capital
 
Candle presentation 3
Candle presentation 3Candle presentation 3
Candle presentation 3Jenn Astwood
 
Lesson BTF107. Single Candlestick Patterns for Binary Trading
Lesson BTF107. Single Candlestick Patterns for Binary TradingLesson BTF107. Single Candlestick Patterns for Binary Trading
Lesson BTF107. Single Candlestick Patterns for Binary TradingOrlando G
 
Candle stick for Online Trading
Candle stick  for Online TradingCandle stick  for Online Trading
Candle stick for Online TradingMD SALMAN ANJUM
 
Candlestick patterns in Share market trading
Candlestick patterns in Share market tradingCandlestick patterns in Share market trading
Candlestick patterns in Share market tradingTraders Mantra
 
406192387-CandleSticks-Diagram-PPT.pptx
406192387-CandleSticks-Diagram-PPT.pptx406192387-CandleSticks-Diagram-PPT.pptx
406192387-CandleSticks-Diagram-PPT.pptxParasghanchi
 
Technical-Analysis.pdf
Technical-Analysis.pdfTechnical-Analysis.pdf
Technical-Analysis.pdfSutarAtharv
 
Candlestick cheat-sheet-rgb-final
Candlestick cheat-sheet-rgb-finalCandlestick cheat-sheet-rgb-final
Candlestick cheat-sheet-rgb-finalsubucud
 
Technical Analysis Pattern-Candelsticks
Technical Analysis Pattern-CandelsticksTechnical Analysis Pattern-Candelsticks
Technical Analysis Pattern-CandelsticksJaspreet Kaur
 

Similar to 21_Candlesticks.pdf (20)

Candlesticks The Basics
Candlesticks   The Basics Candlesticks   The Basics
Candlesticks The Basics
 
Multiple candlesticks.pptx
Multiple candlesticks.pptxMultiple candlesticks.pptx
Multiple candlesticks.pptx
 
Best 30 Candlestick Pattern You Should Have To Know
Best 30 Candlestick Pattern You Should Have To KnowBest 30 Candlestick Pattern You Should Have To Know
Best 30 Candlestick Pattern You Should Have To Know
 
Teoria dos candlesticks
Teoria dos candlesticksTeoria dos candlesticks
Teoria dos candlesticks
 
Technical analysis finance
Technical analysis financeTechnical analysis finance
Technical analysis finance
 
Multiple candles pattern
Multiple candles patternMultiple candles pattern
Multiple candles pattern
 
Kiev part2
Kiev part2Kiev part2
Kiev part2
 
TECHNICAL ANALYSIS PART II.pdf
TECHNICAL ANALYSIS PART II.pdfTECHNICAL ANALYSIS PART II.pdf
TECHNICAL ANALYSIS PART II.pdf
 
Kishore Mirchumal Mansinghani
Kishore Mirchumal MansinghaniKishore Mirchumal Mansinghani
Kishore Mirchumal Mansinghani
 
Candle Stick Patterns.ppt
Candle Stick Patterns.pptCandle Stick Patterns.ppt
Candle Stick Patterns.ppt
 
Candle presentation 3
Candle presentation 3Candle presentation 3
Candle presentation 3
 
Crypto Currencyy.pdf
Crypto Currencyy.pdfCrypto Currencyy.pdf
Crypto Currencyy.pdf
 
Lesson BTF107. Single Candlestick Patterns for Binary Trading
Lesson BTF107. Single Candlestick Patterns for Binary TradingLesson BTF107. Single Candlestick Patterns for Binary Trading
Lesson BTF107. Single Candlestick Patterns for Binary Trading
 
Candle stick for Online Trading
Candle stick  for Online TradingCandle stick  for Online Trading
Candle stick for Online Trading
 
Candlestick patterns in Share market trading
Candlestick patterns in Share market tradingCandlestick patterns in Share market trading
Candlestick patterns in Share market trading
 
406192387-CandleSticks-Diagram-PPT.pptx
406192387-CandleSticks-Diagram-PPT.pptx406192387-CandleSticks-Diagram-PPT.pptx
406192387-CandleSticks-Diagram-PPT.pptx
 
Japanese Candlestick
Japanese CandlestickJapanese Candlestick
Japanese Candlestick
 
Technical-Analysis.pdf
Technical-Analysis.pdfTechnical-Analysis.pdf
Technical-Analysis.pdf
 
Candlestick cheat-sheet-rgb-final
Candlestick cheat-sheet-rgb-finalCandlestick cheat-sheet-rgb-final
Candlestick cheat-sheet-rgb-final
 
Technical Analysis Pattern-Candelsticks
Technical Analysis Pattern-CandelsticksTechnical Analysis Pattern-Candelsticks
Technical Analysis Pattern-Candelsticks
 

Recently uploaded

How we prevented account sharing with MFA
How we prevented account sharing with MFAHow we prevented account sharing with MFA
How we prevented account sharing with MFAAndrei Kaleshka
 
Beautiful Sapna Vip Call Girls Hauz Khas 9711199012 Call /Whatsapps
Beautiful Sapna Vip  Call Girls Hauz Khas 9711199012 Call /WhatsappsBeautiful Sapna Vip  Call Girls Hauz Khas 9711199012 Call /Whatsapps
Beautiful Sapna Vip Call Girls Hauz Khas 9711199012 Call /Whatsappssapnasaifi408
 
Saket, (-DELHI )+91-9654467111-(=)CHEAP Call Girls in Escorts Service Saket C...
Saket, (-DELHI )+91-9654467111-(=)CHEAP Call Girls in Escorts Service Saket C...Saket, (-DELHI )+91-9654467111-(=)CHEAP Call Girls in Escorts Service Saket C...
Saket, (-DELHI )+91-9654467111-(=)CHEAP Call Girls in Escorts Service Saket C...Sapana Sha
 
办理学位证中佛罗里达大学毕业证,UCF成绩单原版一比一
办理学位证中佛罗里达大学毕业证,UCF成绩单原版一比一办理学位证中佛罗里达大学毕业证,UCF成绩单原版一比一
办理学位证中佛罗里达大学毕业证,UCF成绩单原版一比一F sss
 
Amazon TQM (2) Amazon TQM (2)Amazon TQM (2).pptx
Amazon TQM (2) Amazon TQM (2)Amazon TQM (2).pptxAmazon TQM (2) Amazon TQM (2)Amazon TQM (2).pptx
Amazon TQM (2) Amazon TQM (2)Amazon TQM (2).pptxAbdelrhman abooda
 
9654467111 Call Girls In Munirka Hotel And Home Service
9654467111 Call Girls In Munirka Hotel And Home Service9654467111 Call Girls In Munirka Hotel And Home Service
9654467111 Call Girls In Munirka Hotel And Home ServiceSapana Sha
 
INTERNSHIP ON PURBASHA COMPOSITE TEX LTD
INTERNSHIP ON PURBASHA COMPOSITE TEX LTDINTERNSHIP ON PURBASHA COMPOSITE TEX LTD
INTERNSHIP ON PURBASHA COMPOSITE TEX LTDRafezzaman
 
VIP Call Girls Service Miyapur Hyderabad Call +91-8250192130
VIP Call Girls Service Miyapur Hyderabad Call +91-8250192130VIP Call Girls Service Miyapur Hyderabad Call +91-8250192130
VIP Call Girls Service Miyapur Hyderabad Call +91-8250192130Suhani Kapoor
 
办理(Vancouver毕业证书)加拿大温哥华岛大学毕业证成绩单原版一比一
办理(Vancouver毕业证书)加拿大温哥华岛大学毕业证成绩单原版一比一办理(Vancouver毕业证书)加拿大温哥华岛大学毕业证成绩单原版一比一
办理(Vancouver毕业证书)加拿大温哥华岛大学毕业证成绩单原版一比一F La
 
专业一比一美国俄亥俄大学毕业证成绩单pdf电子版制作修改
专业一比一美国俄亥俄大学毕业证成绩单pdf电子版制作修改专业一比一美国俄亥俄大学毕业证成绩单pdf电子版制作修改
专业一比一美国俄亥俄大学毕业证成绩单pdf电子版制作修改yuu sss
 
办理学位证纽约大学毕业证(NYU毕业证书)原版一比一
办理学位证纽约大学毕业证(NYU毕业证书)原版一比一办理学位证纽约大学毕业证(NYU毕业证书)原版一比一
办理学位证纽约大学毕业证(NYU毕业证书)原版一比一fhwihughh
 
vip Sarai Rohilla Call Girls 9999965857 Call or WhatsApp Now Book
vip Sarai Rohilla Call Girls 9999965857 Call or WhatsApp Now Bookvip Sarai Rohilla Call Girls 9999965857 Call or WhatsApp Now Book
vip Sarai Rohilla Call Girls 9999965857 Call or WhatsApp Now Bookmanojkuma9823
 
20240419 - Measurecamp Amsterdam - SAM.pdf
20240419 - Measurecamp Amsterdam - SAM.pdf20240419 - Measurecamp Amsterdam - SAM.pdf
20240419 - Measurecamp Amsterdam - SAM.pdfHuman37
 
Consent & Privacy Signals on Google *Pixels* - MeasureCamp Amsterdam 2024
Consent & Privacy Signals on Google *Pixels* - MeasureCamp Amsterdam 2024Consent & Privacy Signals on Google *Pixels* - MeasureCamp Amsterdam 2024
Consent & Privacy Signals on Google *Pixels* - MeasureCamp Amsterdam 2024thyngster
 
9711147426✨Call In girls Gurgaon Sector 31. SCO 25 escort service
9711147426✨Call In girls Gurgaon Sector 31. SCO 25 escort service9711147426✨Call In girls Gurgaon Sector 31. SCO 25 escort service
9711147426✨Call In girls Gurgaon Sector 31. SCO 25 escort servicejennyeacort
 
科罗拉多大学波尔得分校毕业证学位证成绩单-可办理
科罗拉多大学波尔得分校毕业证学位证成绩单-可办理科罗拉多大学波尔得分校毕业证学位证成绩单-可办理
科罗拉多大学波尔得分校毕业证学位证成绩单-可办理e4aez8ss
 
Building on a FAIRly Strong Foundation to Connect Academic Research to Transl...
Building on a FAIRly Strong Foundation to Connect Academic Research to Transl...Building on a FAIRly Strong Foundation to Connect Academic Research to Transl...
Building on a FAIRly Strong Foundation to Connect Academic Research to Transl...Jack DiGiovanna
 
Industrialised data - the key to AI success.pdf
Industrialised data - the key to AI success.pdfIndustrialised data - the key to AI success.pdf
Industrialised data - the key to AI success.pdfLars Albertsson
 
Predictive Analysis - Using Insight-informed Data to Determine Factors Drivin...
Predictive Analysis - Using Insight-informed Data to Determine Factors Drivin...Predictive Analysis - Using Insight-informed Data to Determine Factors Drivin...
Predictive Analysis - Using Insight-informed Data to Determine Factors Drivin...ThinkInnovation
 

Recently uploaded (20)

How we prevented account sharing with MFA
How we prevented account sharing with MFAHow we prevented account sharing with MFA
How we prevented account sharing with MFA
 
Beautiful Sapna Vip Call Girls Hauz Khas 9711199012 Call /Whatsapps
Beautiful Sapna Vip  Call Girls Hauz Khas 9711199012 Call /WhatsappsBeautiful Sapna Vip  Call Girls Hauz Khas 9711199012 Call /Whatsapps
Beautiful Sapna Vip Call Girls Hauz Khas 9711199012 Call /Whatsapps
 
Saket, (-DELHI )+91-9654467111-(=)CHEAP Call Girls in Escorts Service Saket C...
Saket, (-DELHI )+91-9654467111-(=)CHEAP Call Girls in Escorts Service Saket C...Saket, (-DELHI )+91-9654467111-(=)CHEAP Call Girls in Escorts Service Saket C...
Saket, (-DELHI )+91-9654467111-(=)CHEAP Call Girls in Escorts Service Saket C...
 
办理学位证中佛罗里达大学毕业证,UCF成绩单原版一比一
办理学位证中佛罗里达大学毕业证,UCF成绩单原版一比一办理学位证中佛罗里达大学毕业证,UCF成绩单原版一比一
办理学位证中佛罗里达大学毕业证,UCF成绩单原版一比一
 
Amazon TQM (2) Amazon TQM (2)Amazon TQM (2).pptx
Amazon TQM (2) Amazon TQM (2)Amazon TQM (2).pptxAmazon TQM (2) Amazon TQM (2)Amazon TQM (2).pptx
Amazon TQM (2) Amazon TQM (2)Amazon TQM (2).pptx
 
9654467111 Call Girls In Munirka Hotel And Home Service
9654467111 Call Girls In Munirka Hotel And Home Service9654467111 Call Girls In Munirka Hotel And Home Service
9654467111 Call Girls In Munirka Hotel And Home Service
 
INTERNSHIP ON PURBASHA COMPOSITE TEX LTD
INTERNSHIP ON PURBASHA COMPOSITE TEX LTDINTERNSHIP ON PURBASHA COMPOSITE TEX LTD
INTERNSHIP ON PURBASHA COMPOSITE TEX LTD
 
VIP Call Girls Service Miyapur Hyderabad Call +91-8250192130
VIP Call Girls Service Miyapur Hyderabad Call +91-8250192130VIP Call Girls Service Miyapur Hyderabad Call +91-8250192130
VIP Call Girls Service Miyapur Hyderabad Call +91-8250192130
 
办理(Vancouver毕业证书)加拿大温哥华岛大学毕业证成绩单原版一比一
办理(Vancouver毕业证书)加拿大温哥华岛大学毕业证成绩单原版一比一办理(Vancouver毕业证书)加拿大温哥华岛大学毕业证成绩单原版一比一
办理(Vancouver毕业证书)加拿大温哥华岛大学毕业证成绩单原版一比一
 
专业一比一美国俄亥俄大学毕业证成绩单pdf电子版制作修改
专业一比一美国俄亥俄大学毕业证成绩单pdf电子版制作修改专业一比一美国俄亥俄大学毕业证成绩单pdf电子版制作修改
专业一比一美国俄亥俄大学毕业证成绩单pdf电子版制作修改
 
办理学位证纽约大学毕业证(NYU毕业证书)原版一比一
办理学位证纽约大学毕业证(NYU毕业证书)原版一比一办理学位证纽约大学毕业证(NYU毕业证书)原版一比一
办理学位证纽约大学毕业证(NYU毕业证书)原版一比一
 
vip Sarai Rohilla Call Girls 9999965857 Call or WhatsApp Now Book
vip Sarai Rohilla Call Girls 9999965857 Call or WhatsApp Now Bookvip Sarai Rohilla Call Girls 9999965857 Call or WhatsApp Now Book
vip Sarai Rohilla Call Girls 9999965857 Call or WhatsApp Now Book
 
20240419 - Measurecamp Amsterdam - SAM.pdf
20240419 - Measurecamp Amsterdam - SAM.pdf20240419 - Measurecamp Amsterdam - SAM.pdf
20240419 - Measurecamp Amsterdam - SAM.pdf
 
Deep Generative Learning for All - The Gen AI Hype (Spring 2024)
Deep Generative Learning for All - The Gen AI Hype (Spring 2024)Deep Generative Learning for All - The Gen AI Hype (Spring 2024)
Deep Generative Learning for All - The Gen AI Hype (Spring 2024)
 
Consent & Privacy Signals on Google *Pixels* - MeasureCamp Amsterdam 2024
Consent & Privacy Signals on Google *Pixels* - MeasureCamp Amsterdam 2024Consent & Privacy Signals on Google *Pixels* - MeasureCamp Amsterdam 2024
Consent & Privacy Signals on Google *Pixels* - MeasureCamp Amsterdam 2024
 
9711147426✨Call In girls Gurgaon Sector 31. SCO 25 escort service
9711147426✨Call In girls Gurgaon Sector 31. SCO 25 escort service9711147426✨Call In girls Gurgaon Sector 31. SCO 25 escort service
9711147426✨Call In girls Gurgaon Sector 31. SCO 25 escort service
 
科罗拉多大学波尔得分校毕业证学位证成绩单-可办理
科罗拉多大学波尔得分校毕业证学位证成绩单-可办理科罗拉多大学波尔得分校毕业证学位证成绩单-可办理
科罗拉多大学波尔得分校毕业证学位证成绩单-可办理
 
Building on a FAIRly Strong Foundation to Connect Academic Research to Transl...
Building on a FAIRly Strong Foundation to Connect Academic Research to Transl...Building on a FAIRly Strong Foundation to Connect Academic Research to Transl...
Building on a FAIRly Strong Foundation to Connect Academic Research to Transl...
 
Industrialised data - the key to AI success.pdf
Industrialised data - the key to AI success.pdfIndustrialised data - the key to AI success.pdf
Industrialised data - the key to AI success.pdf
 
Predictive Analysis - Using Insight-informed Data to Determine Factors Drivin...
Predictive Analysis - Using Insight-informed Data to Determine Factors Drivin...Predictive Analysis - Using Insight-informed Data to Determine Factors Drivin...
Predictive Analysis - Using Insight-informed Data to Determine Factors Drivin...
 

21_Candlesticks.pdf

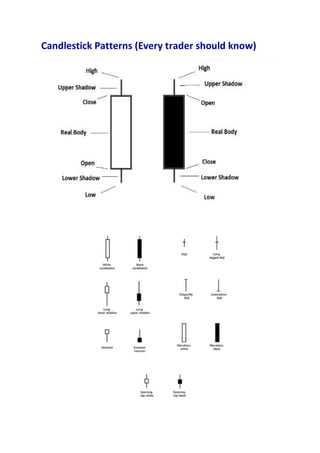
  • 1. Candlestick Patterns (Every trader should know)
  • 2. A doji represents an equilibrium between supply and demand, a tug of war that neither the bulls nor bears are winning. In the case of an uptrend, the bulls have by definition won previous battles because prices have moved higher. Now, the outcome of the latest skirmish is in doubt. After a long downtrend, the opposite is true. The bears have been victorious in previous battles, forcing prices down. Now the bulls have found courage to buy, and the tide may be ready to turn. For example = INET Doji Star
  • 3. A “long-legged” doji is a far more dramatic candle. It says that prices moved far higher on the day, but then profit taking kicked in. Typically, a very large upper shadow is left. A close below the midpoint of the candle shows a lot of weakness. Here’s an example of a long-legged doji. For example = K Long-legged Doji
  • 4. A “gravestone doji” as the name implies, is probably the most ominous candle of all, on that day, price rallied, but could not stand the altitude they achieved. By the end of the day. They came back and closed at the same level. Here ’s an example of a gravestone doji:
  • 5. A “Dragonfly” doji depicts a day on which prices opened high, sold off, and then returned to the opening price. Dragonflies are fairly infrequent. When they do occur, however, they often resolve bullishly (provided the stock is not already overbought as show by Bollinger bands and indicators such as stochastic). For example = DSGT
  • 6. The hangman candle, so named because it looks like a person who has been executed with legs swinging beneath, always occurs after an extended uptrend The hangman occurs because traders, seeing a sell-off in the shares, rush in to grab the stock a bargain price. In order for the Hanging Man signal to be valid, the following conditions must exist: • The stock must have been in a definite uptrend before this signal occurs. This can be visually seen on the chart. • The lower shadow must be at least twice the size of the body. • The day after the Hanging Man is formed, one should witness continued selling. • There should be no upper shadow or a very small upper shadow. The colour of the body does not matter, but a black body would be more positive than a white body. For example = MC
  • 7. The hammer puts in its appearance after prolonged downtrend. On the day of the hammer candle, there is strong selling, often beginning at the opening bell. As the day goes on, however, the market recovers and closes near the unchanged mark, or in some cased even higher. In these cases the market potentially is “hammering” out a bottom. In order for the Hammer signal to be valid, the following conditions must exist: • The stock must have been in a definite downtrend before this signal occurs. This can be visually seen on the chart. • The lower shadow must be at least twice the size of the body. • The day after the Hammer is formed, one should witness continued buying. • There should be no upper shadow or a very small upper shadow. The colour of the body does not matter, but a white body would be more positive than a black body. For example = KCE
  • 8. A bullish engulfing candle occurs after a significant downtrend. Note that the engulfing candle must encompass the real body of the previous candle, but need not surround the shadow. In order for the Bullish Engulfing signal to be valid, the following conditions must exist: • The stock must have been in a definite downtrend before this signal occurs. This can be visually seen on the chart. • The second day of the signal should be a white candle opening below the Close of the previous day and closing above the Open of the previous day’s black candle For example = MINT
  • 9. A bearish engulfing candle occurs after a significant uptrend. Again, the shadows need not be surrounded. In order for the Bullish Engulfing signal to be valid, the following conditions must exist: • The stock must have been in a definite downtrend before this signal occurs. This can be visually seen on the chart. • The second day of the signal should be a white candle opening below the Close of the previous day and closing above the Open of the previous day’s black candle. . For example = ECL
  • 10. On the dark cloud cover day, the stock closes at least halfway into the previous white capping candle. The larger the penetration of the previous candle (that is , the closer this candle is a being a bearish engulfing), the more powerful the signal. Traders should pay particular attention to a dark cloud cover candle if it occurs at an important resistance area and if the end of day volume is strong. In order for the Dark Cloud signal to be valid, the following conditions must exist: • The stock must have been in a definite uptrend before this signal occurs. This can be visually seen on the chart. • The second day of the signal should be a black candle opening above the high of the previous day and closing more than half way into the body of the previous day’s white candle. For example = SCN
  • 11. The piercing pattern often will end a minor downtrend (a downtrend that often lasts between five a fifteen trading days) The day before the piercing candle appears, the daily candle should ideally have a fairly large dark real body, signifying a strong down day. In the classic piercing pattern, the next day’s candle gaps below the lower shadow, or previous day’s low. In order for the Piercing signal to be valid, the following conditions must exist: • The stock must have been in a definite downtrend before this signal occurs. This can be visually seen on the chart. • The second day of the signal should be a white candle opening below the low of the previous day and closing more than half way into the body of the previous day’s black candle For example = SET INDEX
  • 12. The evening star pattern occurs during a sustained uptrend. On the first day we see a candle with a long white body. Everything looks normal and the bulls appear to have full control of the stock. Tn the second day, however, a star candle occur. For this to be a valid evening star pattern, the stock must gap higher on the day of the star. The star can be either black or white. A star candle has a small real body and often contains a large upper shadow. On the third day, a candle with a black real body emerges. This candle retreats substantially into the real body of the first day. The pattern is made more powerful if there is a gap between the second and third day’s candles. However, this gap is unusual, particularly when it comes to equity trading. The further this third candle retreats into the real body of the first day’s candle, the more powerful the reversal signal. For example = TRUE
  • 13. The morning star, that on the first day there is a large dark candle. The middle day is not a perfect star, because there is a small lower shadow, but the upper shadow on top of a small real body gives it a star quality. The third candle is a large white candle that completes the reversal. Not how the third candle recovered nearly to the highs of the first day and occurred on strong volume. In order for the Morning Star signal to be valid, the following conditions must exist: • The stock must have been in a definite downtrend before this signal occurs. This can be visually seen on the chart. • The first day of the signal must be a long dark body. The second day must be a day of indecision. The third day should be a long white candle reaching at least halfway into the body of the first day’s dark candle. For example = VIBHA
  • 14. The shooting star can appear only at a potential market top. If a shooting star occurs after a candle with a large real body, typically it is that much stronger a warning because it shows that the price cannot sustain high levels. The day the shooting star occurs, the market ideally should gap higher . The stock should then rally sharply. At this point, it appears as though the longs are in complete control. Sometime during the day, however, profit taking ensues. The stock closes near the unchanged market, as shown by a small real body. Therefore a shooting star has a small real body and a large upper shadow. Typically, there will be either no lower shadow or a very small one. In order for the Shooting Star signal to be valid, the following conditions must exist: • The stock must have been in a definite uptrend before this signal occurs. This can be visually seen on the chart. • The Upper shadow must be at least twice the size of the body. • The day after the Shooting Star is formed, one should witness continued selling. • There should be no lower shadow or a very small lower shadow. The colour of the body does not matter, but a black For example = WICE
  • 15. The inverted hammer can only occur after a sustained downtrend, the stock is in all probability already oversold. Therefore, the inverted hammer signifies that traders who have held long positions in the security, most of whom are now showing large losses, often are quick to dump their shares by selling into strength . For example = STEC
  • 16. The bullish harami candle can occur in either bullish or bearish trends, but the colors are reversed: A large black body precedes a smaller white real body, and this gives out a bullish precedes a smaller white real body, and this gives out a bullish signal: it implies that the stock is poised to move upward. In signal: In either bullish or bearish haramis, the upper and lower shadows can be of any size, and theoretically could even go above the real body of the clear candle day. In practice, however, the harami day’s shadows often are small and typically are contained well within the real body of the previous day’s candle. In order for the Bullish Harami signal to be valid, the following conditions must exist: • The stock must have been in a definite downtrend before this signal occurs. This can be visually seen on the chart. • The second day of the signal should be a white candle opening above the Close of the previous day and closing below the Open of the previous day’s black candle. For example = CPF
  • 17. In order for the Bearish Harami signal to be valid, the following conditions must exist: • The stock must have been in a definite uptrend before this signal occurs. This can be visually seen on the chart. • The second day of the signal should be a dark candle opening below the Close of the previous day and closing above the Open of the previous day’s white candle. For example = BBL
  • 18. Marubozu means “close-cropped” Typically, the marubozu is a long candle that implies the day’s trading range has been large. A marubozu candle lacks either an upper or lower shadow. On rare occasions it can lack both a upper or lower shadow. When a full marubozu occurs, or one that is very close to full, it is very well worth noting. If it is a white candle, then it signals extreme conviction among buyers. Conversely, if it is a dark candle, then it indicates sellers were eager to flee. AS always, you should pay careful attention to the nex day’s trading to see if there is follow through. A full or nearly full marubozu implies that there is strong buying or selling interest depending on the color. If there is follow through early the next day, the stock is likely to trend in that same direction for the next few sessions. That awareness can be important for the trader. For example = INTUCH
  • 19. Spin top , the shadow are relatively small and the candle has a very small range. When combined with low volume, traders may be expressing disinterest. Spinning Top High Wave Definition: A Spinning Top Wave, also called a High Wave candle, is candlestick that has an open and close price near each other which produces a small real body and color is of no importance. They also have long upper and lower shadows that significantly exceed the length of the body. These types of candlesticks indicate indecision and subsequent consolidation. Practical Use: Technical analysts will often watch for Spinning Top High Wave candlesticks and then "join the sidelines." After such a volatile session, traders will often wait for additional confirmation of an upward or downward price movement. For example = SET INDEX
  • 20. High wave candle, on the other hand, portrays a situation where there is a active tug of war between the bulls and bears. This candle shows a market has lost a clear sense of direction. If it occurs on high volume, then it indicates the market’s general confusion about the direction prices are headed • High Wave candles show the confusion among traders • The size of the real body shows the lack of consensus among traders to sustain the current trend • Indicates an early sign of a possible shift in the current uptrend or downtrend • The candle has a small real body of either color • The size of both shadows are particularly long, but are not required to be the exact same length • Ignore in a trading range: price is pausing before breaking out • Caution is recommended when encountering such candles
  • 21. The three black crows candle formation does not happen very frequently in stock trading, but when it does occur swing traders should be very alert to the crow’s caw. The candlestick’s metaphor is three crows sitting in a tall tree. On the day the first black crow makes its appearance, the formation is most predictive if the first “crow” or dark candlestick closes below the previous candle’s real body. Two more long-bodied consecutive down days then ensue. On each of these days, it appears as if the stock wants to regain its former strength, as the stock opens higher than the close on the previous day. By the end of each session, however, the sellers regain control and the stock drops to a new closing low.
  • 22. The three white soldiers pattern is most potent when it occurs after an extended decline and a period of subsequent consolidation. When a particular stock posts a decline followed by sideways movement, the appearance at that point of three white soldiers signals that higher prices are likely ahead. The first of the three white soldiers is a reversal candle. It either ends a downtrend or signifies that the stock Is moving out of a period of consolidation after a decline. The candle on day two may open within the real body of day one. The pattern is valid as long as the candle of day two opens in the upper half of day one’s ra nge. By the end of dy two, the stock should close near its high leaving a very small or non-existent upper shadow. The same pattern is then repeated on day three. For example = BEM
  • 23. The tweezers formation always involves two candles. At a tweezers top, the high price of two nearby sessions is identical or very nearly so. In a high priced stock there may be a few cents variation, and I believer it should still be considered a tweezers. At a tweezers bottom, the low price of two sessions that come in close succession is the same. For simplicity, lets talk just about the tweezers bottom. In some instances, the tweezers bottom is formed by two real candlestick bodies that make an identical low. In other instances, the lower shadows of two nearby candles touch the same price level and the stock then bounces higher. A third possibility is that the lower shadow of one day and the real body of a nearby session hit the same bottom level. For example = BH
  • 25. Stick Sandwich It occurs during a Downtrend; confirmation is required by the candles that follow the Pattern. – The First Candle is black, it has a short Lower shadow (Or it has not a Lower Shadow) that represents a new Low in the Downtrend. – The Second Candle is white, it has the Open above the Close of the First Candle (The Real Body is above the close of the First Candle). – The Third Candle is black, it has the Open above the Close of the Second Candle whereas it has the Close at the same level (More or less) of the Close of the First Candle (So that it fully contains the Real Body of the Second Candle). – It occurs during an Uptrend; confirmation is required by the candles that follow the Pattern. – The First Candle is white, it has a short Upper shadow (Or it has not an Upper Shadow) that represents a new High in the Uptrend. – The Second Candle is black, it has the Close below the Open of the First Candle (The Real Body is below the Close of the First Candle). – The Third Candle is white, it has the Open below the Close of the Second Candle whereas it has the Close at the same level (More or less) of the Close of the First Candle (So that it fully contains the Real Body of the Second Candle).
  • 26. Dumpling top pattern Normally it should be a signal of Bearish reversal of the current Trend. – It occurs during an Uptrend; confirmation is required by the candles that follow the Pattern. – The Pattern starts during an Uptrend, then it becomes a “Sideways” Trend (That represents the indecision of the Markets); at the end of the Pattern, there is a reversal in the direction of the Trend and it becomes a Downtrend. – This Pattern is quite rare; is important that there is a Gap Down after the “Sideways” Trend and just before the start of the Downtrend (To obtain a further confirmation of the reversal of the Trend, as the Pattern suggests). For example = BTS
  • 27. Fry pan bottom pattern – Normally it should be a signal of Bullish reversal of the current Trend. – It occurs during a Downtrend; confirmation is required by the candles that follow the Pattern. – The Pattern starts during a Downtrend, then it becomes a “Sideways” Trend (That represents the indecision of the Markets); at the end of the Pattern, there is a reversal in the direction of the Trend and it becomes an Uptrend. – This Pattern is quite rare; is important that there is a Gap Up after the “Sideways” Trend and just before the start of the Uptrend (To obtain a further confirmation of the reversal of the Trend, as the Pattern suggests). For example = BLA
  • 28. Tower top pattern It occurs during an Uptrend; confirmation is required by the candles that follow the Pattern. – The First Candle is long and white. – The next Candles that are in the “Sideways” Phase, are Spinning Tops (Black or white) and they show the indecision of the Market. – The Last Candle is long and black, that is the start of the reversal of the current Trend. For example = MDX
  • 29. Tower bottom pattern – It occurs during a Downtrend; confirmation is required by the candles that follow the Pattern. – The First Candle is long and black. – The next Candles that are in the “Sideways” Phase, are Spinning Tops (Black or white) and they show the indecision of the Market. – The Last Candle is long and white, that is the start of the reversal of the current Trend. For example = SMPC
  • 30. Mat Hold pattern It occurs during an Uptrend; confirmation is required by the candles that follow the Pattern. – The First Candle is long and white. – Then there is a Gap Up between the First and Second Candle. – The Second Candle is black, it has a short Real Body; moreover it has the Close above the Close of the First Candle. – The Third Candle can be white or black (It doesn’t matter), but it has a short Real Body. – The Fourth Candle is black, with a short Real Body. – The Second, Third and Fourth Candle represent a decline in prices; moreover their Real Bodies are above the Low of the First Candle. – The Fifth Candle is long and white; it has the Close above the High of the Second Candle. – It occurs during a Downtrend; confirmation is required by the candles that follow the Pattern. – The First Candle is long and black. – Then there is a Gap Down between the First and Second Candle. – The Second Candle is white, it has a short Real Body; moreover it has the Close below the Close of the First Candle. – The Third Candle can be white or black (It doesn’t matter), but it has a short Real Body. – The Fourth Candle is white, with a short Real Body. – The Second, Third and Fourth Candle represent a rise in prices; moreover their Real Bodies are below the High of the First Candle. – The Fifth Candle is long and black; it has the Close below the Low of the Second Candle.
  • 31. For example = JAS For example = QTC
  • 32. Abandoned baby pattern – It occurs during a Downtrend; confirmation is not required by the candles that follow the Pattern (Although it’s better if you search for confirmation). – The First Candle is long and black. – The Second Candle is a Doji Candle, that gaps down from the Previous Candle. – The Third Candle is long and white; it has the Open above the Second Candle. Tri star doji It occurs during a Downtrend; confirmation is required by the candles that follow the Pattern. – The Second Doji is below the other Two Doji Candles.
  • 33. Above below the Stomach pattern – Normally it should be a signal of reversal of the current Trend. – You can find it in the variants: Above and Below, depending on the Trend in which is located. Below The Stomach – It occurs during an Uptrend; confirmation is required by the candles that follow the Pattern . – The First Candle is long and white. – The Second Candle is black (Although it could be also white); it has the Open below or at the same level of the midpoint of the Real Body of the First Candle. Whereas it has the Close below the Open of the First Candle and below the midpoint of the Real Body of the First Candle (In the case which the Second Candle is black).
  • 34. Thrusting Line – Normally it should be a signal of continuation of the current Trend. – It occurs during a Downtrend or an Uptrend; confirmation is required by the candles that follow the Pattern. – The Pattern is characterized by Two Candles of opposite color (Black and white in case of a Downtrend; white and black in case of an Uptrend). The First Candle is long and black (In case of a Downtrend) or is long and white (In case of an Uptrend). – The Second Candle has the Open below the Low of the First Candle, whereas it has the Close near (But below) the Midpoint of the Real Body of the First Candle (In case of a Downtrend). The Second Candle has the Open above the High of the First Candle, whereas it has the Close near (But above) the Midpoint of the Real Body of the First Candle (In case of an Uptrend).
  • 35. Separating Line pattern – Normally it should be a signal of continuation of the current Trend. – You can find it in the variants: Bullish and Bearish, depending on the Trend in which is located. Bearish Separating line – It occurs during a Downtrend; confirmation is required by the candles that follow the Pattern. – The First Candle is long and white. – The Second Candle is long and black; it has the Open at the same level (More or less) of the Open of the First Candle.
  • 36. Three line Strike – Normally it should be a signal of continuation of the current Trend. – You can find it in the variants: Bullish and Bearish, depending on the Trend in which is located. – It occurs during an Uptrend; confirmation is required by the candles that follow the Pattern. – The First, Second and Third Candle are white; moreover each Candle has the Close above the Close of the Previous Candle. – The Fourth Candle is long and black; it has the Open above the Open of the Previous Candles while it has the Close below the Open of the First Candle (The Fourth Candle fully contains within his Real Body the Three Previous Candles).
  • 37. Meeting line pattern – It occurs during a Downtrend; confirmation is required by the candles that follow the Pattern. – The First Candle is long and black. – The Second Candle is long and white; it has the Close at the same level (More or Less) of the Close of the First Candle. – It occurs during an Uptrend; confirmation is required by the candles that follow the Pattern. – The First Candle is long and white. – The Second Candle is long and black; it has the Close at the same level (More or Less) of the Close of the First Candle.
  • 38. Low price gapping play – Normally it should be a signal of continuation of the current Trend. – It occurs during a Downtrend; confirmation is required by the candles that follow the Pattern. – The First Candle is long and black. – The Second, Third and Fourth Candle, have a short Real Body and they are near the level of the Low of the First Candle. – The Fifth Candle is long and black, that gaps down from the Previous Candle. – The “Sideways” Period, can contain up to Eleven Candles (Not necessarily Three Candles); these candles are the Spinning Tops (That have short Real Body). For example = AP
  • 39. High price gapping play – Normally it should be a signal of continuation of the current Trend. – It occurs during an Uptrend; confirmation is required by the candles that follow the Pattern. – The First Candle is long and white. – The Second, Third and Fourth Candle, have a short Real Body and they are near the level of the High of the First Candle. – The Fifth Candle is long and white, that gaps up from the Previous Candle. – The “Sideways” Period, can contain up to Eleven Candles (Not necessarily Three Candles); these candles are the Spinning Tops (That have short Real Body).
  • 40. Homing Pigeon pattern – Normally it should be a signal of Bullish reversal of the current Trend. – It occurs during a Downtrend; confirmation is required by the candles that follow the Pattern. – The First Candle is long and black, whereas the Second Candle is black but is shorter than the First Candle. The Real Body of the Second Candle is fully contained within the Real Body of the First Candle. – Confirmation of the Pattern and the reversal of the Trend: when the Close of a Candle that follows the “Homing Pigeon” is below the Lowest Low of the Two Candle of the Homing Pigeon. For example = IRPC
  • 41. 8-10-12-13 New price lines – It occurs during an Uptrend; confirmation is required by the candles that follow the Pattern. – The Pattern is characterized by eight consecutive candles, each with a higher High. – To obtain a further confirmation of the Pattern, you should check the Close of the last Candle Line: if it is over the Top of the Real Body of the Previous Candle, there are more chances that there will be a rise in Prices. If the Close is below the Top of the Real Body of the Previous Candle , there are more chances that there will be a fall in Prices. For example = FTSE
  • 42. Scoop pattern – It occurs during a Sideways Trend; confirmation is required by the candles that follow the Pattern. – The Pattern starts showing the indecision of the Markets (Spinning Tops, Doji, Small Candles, etc… ). (1) – Then the Price starts to fall (Probably due to some Traders that expected a rise in the prices, but now that the trend is sideways they are selling because they do not believe anymore in a possible rise). (2) – This decline in Prices attracts other Traders, that hope in a possible Rise in the Prices after the fall. For this reason the prices start to rise: if the prices go above the phase of indecision, it will begin a new Uptrend; if not, the Pattern will fail. (3)
  • 43. J-Hook pattern and Inverted J-Hook pattern – Normally it should be a signal of continuation of the current Trend. – It occurs during an Uptrend; confirmation is required by the candles that follow the Pattern. – The Pattern starts with a rapid increase in the Prices. (1) – Then there is a Candlestick Pattern that gives a bearish signal (So the Traders start to sell). (2) – The prices fall, then reach a level of “indecision”; at the end of this phase of indecision, there should be a Bullish signal. (3) – The prices start to rise and they reach the Previous High (The one formed from the Phase (1) ). If the prices keep rising, going above this High, there should be a new Uptrend in Prices. – If the prices don’t go above the High, the Pattern has failed; in this case the Pattern creates the Double Top Pattern (A pattern from the Technical analysis).
  • 44. For example = KCE For example = SAPPE
  • 45. Cradle pattern Normally it should be a signal of reversal of the current Trend. – It occurs during a Downtrend; confirmation is required by the candles that follow the Pattern. – The Pattern starts with a long and black Candle, during a downtrend (Due to the Traders that are selling because they are worried by the downtrend). – Then there is a phase of indecision in the Prices (There are Doji Candles, Spinning Tops, Hammer, Inverted Hammer), so the Prices remain in a precarious balance. – At the end of the Pattern, starts a rise in the Prices with a long and white Candle (That shows the strength of the rise). For example = SMPC
  • 46. Rising three methods – It occurs during an Uptrend; confirmation is required by the candles that follow the Pattern. – The First and Fifth Candle are white and are longer than the other Three Candles of the Pattern. – The Second, Third and Fourth Candle are black (Or they alternate the color: it only matters that they represent a Decline in Prices; normally is the Third Candle that can be of any color). Moreover these Candles are fully contained within the Real Body of the First Candle (or within the High-Low Range of the First Candle); while the Lows are above the Open of the First Candle and the Highs are below the Close of the First Candle. – The Close of the Fifth Candle is above the Close of the First Candle For example = SPA
  • 47. Falling Three Methods – It occurs during a Downtrend; confirmation is required by the candles that follow the Pattern. – The First and Fifth Candle are black and are longer than the other Three Candles of the Pattern. – The Second, Third and Fourth Candle are white(Or they alternate the color: it only matters that they represent a Rise in Prices; normally is the Third Candle that can be of any color). Moreover these Candles are fully contained within the Real Body of the First Candle (or within the High-Low Range of the First Candle); while the Lows are below the Open of the First Candle and the Highs are above the Close of the First Candle. – The Close of the Fifth Candle is below the Close of the First Candle. For example = DTAC
  • 48. Deliberation pattern or Stalled pattern – It occurs during an Uptrend; confirmation is required by the candles that follow the Pattern. – Normally it should be a signal of Bearish reversal of the current Trend. – The Pattern is composed by Three White Candles: the First One and the Second One have their Real Body longer than the Real Body of the Third Candle. – The Open and Close of each Candle, should be higher then The Open and Close of the Previous Candle. – The Third Candle has a short Real Body, it can be also a Doji Candle; moreover, it has an Upper Shadow very tall. Lastly, it has the Open near the level of the Close of the Second Candle. – The confirmation of the Bearish Reversal could be from the next Candles, when one of them (While is falling) overcomes the midpoint of the Real Body of the Second Candle.
  • 49. Advance block pattern – It occurs during an Uptrend; confirmation is required by the candles that follow the Pattern. – Normally it should be a signal of Bearish reversal of the current Trend. – The Pattern is composed by Three White Candles, that gradually have a shorter Real Body. – The Open of the Second and Third Candle should be within the Real Body of the Previous Candle. – The Close of the Candles are often far away from their respective Highs. – The Shadows of the Candles are gradually taller, especially the Upper Shadows of the Last Two Candles. – The confirmation of the Bearish Reversal could be from the next Candles, when one of them (While is falling) overcomes the midpoint of the Real Body of the First Candle.
  • 50. Kicker You can see in the above graphic why this pattern is so explosive. Like most candle patterns there is a bullish and bearish version. In the bullish version, the stock is moving down and the last red candle closes at the bottom of the range. Then, on the next day, the stock gaps open above the previous days high and close. This "shock event" forces short sellers to cover and brings in new traders on the long side. This is reversed in the bearish version. FOR EXAMPLE = MINT
  • 51. BULLISH UNIQUE THREE RIVER BOTTOM Definition This is a three-candlestick pattern that somewhat looks like the Bullish Morning Star. It appears in a downtrend. The first day’s black candlestick engulfs the following small black body, which characteristically has a long lower shadow. The pattern is completed by a small white body, which closes below the close of the second day. Recognition Criteria 1.The market is characterized by a prevailing downtrend. 2. A black candlestick is observed on the first day. 3. The second day is a black body that opens higher, trades at a new low, and then closes near the high. 4. The third day is a short white day below the second day. BULLISH DOWNSIDE GAP TWO RABBITS Definition This is a three-candlestick bullish reversal pattern. The gap between the white body of the second day and the black body of the first day represents the downside gap. The white candlesticks of the second and third day represent the rabbits ready to jump out of their burrow. Recognition Criteria 1. The market is characterized by a prevailing downtrend. 2. A normal or long black candlestick appears on the first day. 3. The second day is a short white candlestick that gaps down. 4. On the last day another white candlestick appears that opens at or below the open, and then closes above the close of the previous day, but still below the close of the first day.
  • 52. BULLISH THREE STARS IN THE SOUTH Definition This pattern consists of three consecutive black candlesticks which have consecutively lower closes and higher lows in a slowly deteriorating downtrend. Recognition Criteria 1. The market is characterized by a prevailing downtrend. 2. A black candlestick with almost no upper shadow and a long lower shadow appears on the first day. 3. The next day is another black candlestick closing below the previous day’s close and having an opening in the range of the previous day’s body. However, it has a higher low. 4. The last day is a small black Marubozu with a higher low. BULLISH CONCEALING BABY SWALLOW Definition This is a pattern formed by four black candlesticks. After two falling Black Marubozu days, a short down day engulfed by a fourth black day shows that the downtrend has eroded significantly, despite the final close is at a new low. Recognition Criteria 1. Two falling Black Marubozu days at the beginning confirms the downtrend. 2. The third day is a short black with downside gap. However, this day trades into the previous day’s body, producing a long upper shadow. 3. The fourth black day completely engulfs the third day including the shadow.
  • 53. BULLISH LADDER BOTTOM Definition This is a five candlestick pattern that starts with three strong black candlesticks. The downtrend continues with the fourth lower close. The next day gaps higher and closes much higher than the previous day or two. This may imply a bullish reversal. Recognition Criteria 1. The market is characterized by a prevailing downtrend. 2. Three strong black candlesticks occur much like the Three Black Crows pattern. 3. The fourth black candlestick closes also lower but has a long upper shadow. 4. The fifth day is a strong white with an open above the previous day’s body. BULLISH AFTER BOTTOM GAP UP Definition This is a five candlestick pattern that starts with three black candlesticks. The market signals a bottom reversal with the change in the color at the fourth candlestick. The next day gaps higher and makes a strong upward move, confirming the reversal. Recognition Criteria 1. The pattern begins with a black candlestick. 2. The next two days are also black days, and each one closes lower than the previous day’s close. 3. The third day gaps down and opens below the close of the second day. 4. The fourth day is white.
  • 54. BULLISH DESCENT BLOCK Definition This pattern consists of three consecutive black candlesticks with consecutively lower closes in a downtrend. It is the compliment of the Bearish Advanced Block Pattern. Recognition Criteria 1. The market is characterized by a prevailing downtrend. 2. A black candlestick appears on the first day. 3. The next two days are black candlesticks with each closing below the previous day’s close and having an opening in the range of the previous day’s body. 4. The last two days have long lower shadows. Pattern Requirements and Flexibility The first candlestick of a Bullish Descent Block should be a normal or long black candlestick. The following consecutive black candlesticks must open within the range of the previous day’s body, and close below the previous day’s close. The bodies of the three black candlesticks should get shorter, while the lower shadows get longer. BULLISH DELIBERATION BLOCK Definition This pattern consists of three consecutive black candlesticks with consecutively lower closes in a downtrend. It is the compliment of the Bearish Deliberation Block Pattern. Recognition Criteria 1. Market is characterized by a prevailing downtrend. 2. A black candlestick appears on the first day. 3. The next day is another black candlestick, which opens in the range of the previous day’s body and closes below the previous day’s close. 4. The final day is a short black candlestick, a spinning top or a Doji that gaps down below the second day. Pattern Requirements and Flexibility The first two black candlesticks appearing in the Bullish Deliberation Block should not be short. The second day should open at or higher than the close of the first day, while the close of the second day should be at or below the close of the first day. The gapping down third candlestick can be a short black candlestick or a Doji.
  • 55. BULLISH SQUEEZE ALERT Definition This is a three-day bullish reversal pattern. It was developed because of the frequent event where prices can break to the upside following this pattern, especially if the pattern is preceded by a strong downside move. Recognition Criteria 1. The market is characterized by a prevailing downtrend. 2. A black candlestick appears on the first day. 3. The second and third days each have lower highs and higher lows than the previous day. Their color is not important. 4. The sizes of the bodies of the three days do not matter. Pattern Requirements and Flexibility The first candlestick should be a black candlestick. The other two candlesticks can be of any color and length but they should have lower highs and higher lows consecutively. BULLISH AFTER BOTTOM GAP UP Definition This is a five candlestick pattern that starts with three black candlesticks. The market signals a bottom reversal with the change in the color at the fourth candlestick. The next day gaps higher and makes a strong upward move, confirming the reversal. Recognition Criteria 1. The pattern begins with a black candlestick. 2. The next two days are also black days, and each one closes lower than the previous day’s close. 3. The third day gaps down and opens below the close of the second day. 4. The fourth day is white. 4. The fifth day is a strong white with an open forming (causing) a gap above the previous day’s close. Pattern Requirements and Flexibility The first three days of the Bullish After Bottom Gap Up are strong black candlesticks with consecutive lower opens and lower closes. The third black should gap down. The fourth day is a white candlestick that opens higher and covers the gap. The fifth day is a strong white candlestick that makes a body gap with the fourth day. There are no short candlesticks in this pattern.
  • 56. ON NECK LINE (ate kubi) Description The On Neck Line pattern is almost a 'meeting line pattern', but the critical term is 'almost'. The ON Neck pattern does not reach the previous day's close; it only reaches the previous day's low. Criteria 1. A long black candle forms in a downtrend. 2. The next day gaps down from the previous day's close; howver, the body is usally smaller than one seen in the meeting line pattern. 3. The second day closes at the low of the previous day. Pattern Psychology After a market has been moving in a downward direction, a long black candle enhances the downtrend. The next day opens lower, a small gap down, but the trend is halted by a move back up to the previous day's low. The buyers in this upmove should be uncomfortable that threre was not more strength in the upm,ove. The sellers step back in the next dya to continue the downtrend.
  • 57. IN NECK LINE (iri kubi) Description The In Neck pattern is almost a Meeting Line pattern. I t has the same description as the On Neck pattern except that it closes at or slightly above the previous day's close. Confirmation is suggested. The In Neck Line indicates some short covering, but not a change in trend direction. Criteria 1. A long black candle forms in a downtrend 2. The next day gaps down from the previous day's close; howver, the body is usally smaller than one seen in the Meeting Line pattern. 3. The second day closes at the close or just slightly above the close of the previous day. Pattern Psychology This is the same scenario as the On Neck pattern. After a market has been moving in a downward direction, a long black candles enhances the downtrend. The next day opens lower, a small gap down, but the trend is halted by a move back up to the previous day's low. The buyers in this upmove should be uncomfortable that there was not more strength in the upmove. The sellers step back in the next day to continue the downtrend
  • 58. THRUSTING Description The Thrusting pattern is almost an 'On Neck' or an 'In Neck' pattern and resembles the Meeting Line pattern, also. It has the same description as the 'On Neck' pattern except that it closes near, but slightly below the midpoint of the previous day's black body. Criteria 1. A long black candle forms in a downtrend. 2. The next day gaps down from the previous day's close; however, the body is usually bigger than the ones found in the On Neck and In Neck patterns. 3. The second day closes just slightly below the midpoint of the previous day's candle. Pattern Pasychology This is the same scenario as the 'On neck' pattern. After a market has been moving in a downward direction, a long black candle enhances the downtrend. The next day opens lower, a small gap down, but the trend is halted by a move back up to the previous day's low. The buyers in this upmove should be uncomfortable that there was not more strength in the upmove. The sellers step back in the next day to continue the downtrend. It is a little stronger than the On neck and In Neck patters, but not quite as strong as the Piercing Line pattern.
  • 59. SIDE-BY-SIDE WHITE LINES - Continuation Pattern (narabi aka) Description Side-by-Side White Lines are found in uptrends. Two white candles form side-by-side after gapping up from the previous white candle. Narabi in Japanese means 'in a row'. Narabi aka means "whites in a row,; Side-by-Side Lines, black or white, indicate a pause or stalemate when they are observed by themselves. In this case, the stock market data has a different meaning because they occur after a gap in the trend's direction. Criteria 1. An uptrend is in progress. A gap occurs between two candles of the same co9lor. 2. The color the first two candles is the same as the prevailing trend. 3. The third day, a candle opens at the same or near the open price of the previous day. 4. The third day closed near the close of the previous day.
  • 60. ON NECK LINE (ate kubi) Description The On Neck Line pattern is almost a 'meeting line pattern', but the critical term is 'almost'. The ON Neck pattern does not reach the previous day's close; it only reaches the previous day's low. Criteria 1. A long black candle forms in a downtrend. 2. The next day gaps down from the previous day's close; howver, the body is usally smaller than one seen in the meeting line pattern. 3. The second day closes at the low of the previous day. Pattern Psychology After a market has been moving in a downward direction, a long black candle enhances the downtrend. The next day opens lower, a small gap down, but the trend is halted by a move back up to the previous day's low. The buyers in this upmove should be uncomfortable that threre was not more strength in the upm,ove. The sellers step back in the next dya to continue the downtrend.
  • 61. IN NECK LINE (iri kubi) Description The In Neck pattern is almost a Meeting Line pattern. I t has the same description as the On Neck pattern except that it closes at or slightly above the previous day's close. Confirmation is suggested. The In Neck Line indicates some short covering, but not a change in trend direction. Criteria 1. A long black candle forms in a downtrend 2. The next day gaps down from the previous day's close; howver, the body is usally smaller than one seen in the Meeting Line pattern. 3. The second day closes at the close or just slightly above the close of the previous day. Pattern Psychology This is the same scenario as the On Neck pattern. After a market has been moving in a downward direction, a long black candles enhances the downtrend. The next day opens lower, a small gap down, but the trend is halted by a move back up to the previous day's low. The buyers in this upmove should be uncomfortable that there was not more strength in the upmove. The sellers step back in the next day to continue the downtrend
  • 62. THRUSTING Description The Thrusting pattern is almost an 'On Neck' or an 'In Neck' pattern and resembles the Meeting Line pattern, also. It has the same description as the 'On Neck' pattern except that it closes near, but slightly below the midpoint of the previous day's black body. Criteria 1. A long black candle forms in a downtrend. 2. The next day gaps down from the previous day's close; however, the body is usually bigger than the ones found in the On Neck and In Neck patterns. 3. The second day closes just slightly below the midpoint of the previous day's candle. Pattern Pasychology This is the same scenario as the 'On neck' pattern. After a market has been moving in a downward direction, a long black candle enhances the downtrend. The next day opens lower, a small gap down, but the trend is halted by a move back up to the previous day's low. The buyers in this upmove should be uncomfortable that there was not more strength in the upmove. The sellers step back in the next day to continue the downtrend. It is a little stronger than the On neck and In Neck patters, but not quite as strong as the Piercing Line pattern.
  • 63. SIDE-BY-SIDE WHITE LINES - Continuation Pattern (narabi aka) Description Side-by-Side White Lines are found in uptrends. Two white candles form side-by-side after gapping up from the previous white candle. Narabi in Japanese means 'in a row'. Narabi aka means "whites in a row,; Side-by-Side Lines, black or white, indicate a pause or stalemate when they are observed by themselves. In this case, the stock market data has a different meaning because they occur after a gap in the trend's direction. Criteria 1. An uptrend is in progress. A gap occurs between two candles of the same co9lor. 2. The color the first two candles is the same as the prevailing trend. 3. The third day, a candle opens at the same or near the open price of the previous day. 4. The third day closed near the close of the previous day.
  • 64. HOMING PIGEON Description The Homing Pigeon is the same as the Harami, except for the color of the second day's body. The pattern is composed of a two-candle formation in a down trending market. Both candles are the same color as the current trend. The first body of the pattern is a long body, the second body is smaller. The open and the close of the second day occurs inside the open and the close of the previous day. Its presence indicates that the trend is over. Criteria 1. The body of the first candle is black; the body of the second candle is black. 2. The downtrend has been evident for a good period. A long black candle occurs at the end of the trend. 3. The second day opens higher than the close of the previous day and closes lower than the open but above the closing price of the prior day. 4. Unlike the Western Inside Day, just the body needs to remain in the previous day's body; where as the Inside Day requires both the body and the shadows to remain inside the previous day's body. 5. For a reversal signal, further confirmation is required to indicate that the trend is moving up. Signal Enhancements The higher the second candle closes up on the first black candle, the more convincing that a reversal has occurred. Pattern Psychology After a strong downtrend has been in effect and after a long black candle, the bulls open the price higher than the previous close. The shorts get concerned and start covering. The price finishes lower for the day but not as low as the previous day. This is enough support to have the short sellers take notice that the trend has been violated. A strong day after that would convince everybody that the trend was reversing. Usually the volume is above the recent norm due to the unwinding of short positions.
  • 65. MATCHING LOW Description The Matching Low pattern is similar to the Homing Pigeon patter, the exception being that the two days of the pattern close on their lows, at the same level. After a long downtrend, recognizing that the price has closed at the same level without going through is an indication to the bears that the bottom has been hit. Criteria 1. The body of the first candle is black; the blody of the second candle is black. 2. The downtrend has been evident for a good period. A long black candles occurs at the end of the trend. 3. The second day opens higher than the close of hte previous day and closes at the same close as the prior day. 4. For a reversal signal, further confirmation is required to indicate that the trend is moving up. Pattern Psychology After a strong downtrend has been in effect and after a long black candle, the bulls open the price higher than the previous close. The shorts get concerned and start covering. However, the bears sitll have enough control to close the price at the low of the day, the low being the same as the close of the previous day. The psychological impact for hte bears is that it couldn't close below the previous close, thus causing concern that this is a support level.