SlideShare a Scribd company logo
1 of 55
Financial Reporting Problem: Apple Inc.CT7.1 The financial
statements of Apple Inc. are presented in Appendix A. The
complete annual report, including the notes to its financial
statements, is available at the company’s website.
Instructions
Using the financial statements and reports, answer these
questions about Apple’s internal controls and cash.
a. What comments, if any, are made about cash in the “Report
of Independent Registered Public Accounting Firm”?
b. What data about cash and cash equivalents are shown in the
consolidated balance sheet (statement of financial position)?
c. What activities are identified in the consolidated statement of
cash flows as being responsible for the changes in cash during
2017?
d. How are cash equivalents defined in the Notes to
Consolidated Financial Statements?
e. Read the section of the report titled “Management’s Report
on Internal Control Over Financial Reporting.” Summarize the
statements made in that section of the report.
Journal of Vocational Rehabilitation 46 (2017) 149–158
DOI:10.3233/JVR-160851
IOS Press
149
Impairment, demographics and competitive
employment in vocational rehabilitation
John O’Neilla,∗ , Walter Kaczetowb, Joseph Pfallerc and Jay
Verkuilenb
a Kessler Foundation, East Hanover, NJ, USA
bProgram in Educational Psychology, City University of New
York Graduate Center, New York, NY, USA
cProgram in Rehabilitation Psychology, University of
Wisconsin-Madison, Madison, WI, USA
Revised/Accepted August 2016
Abstract.
BACKGROUND: There is a persistent gap in the employment
rate of working-age people with disabilities and those without
disabilities, with outcomes differing across impairment groups
and by demographics.
OBJECTIVE: Our goal is to identify differences in competitive
employment outcomes across 17 impairment groups included
in the RSA-911, including interaction effects with other
individual characteristics, among them age, gender,
race/ethnicity,
and educational attainment.
METHODS: We used logistic regression to examine differences
in competitive versus other employment closures among
vocational rehabilitation customers who were employed at
closure. The relationship between demographic variables and
type
of employment was allowed to vary by impairment.
RESULTS: Contrary to research that does not differentiate type
of employment, we find the odds of competitive employment
are lowest for VR clients who are blind or visually impaired.
They are also lower for those with mobility, orthopedic, or
mental impairments; women; older clients; and those with lower
levels of educational attainment. Interaction effects revealed
that the differences across demographic groups vary by type of
impairment.
CONCLUSION: Researchers and counselors should consider
type of employment at closure, and differences by impairment
and among demographic groups should be taken into
consideration when designing employment service programs.
Keywords: Vocational rehabilitation (VR), demographics, RSA-
911, competitive employment
1. Introduction
The benefits of employment for physical and psy-
chological health is well-documented for people with
and without disabilities (Bishop, Chapin, & Miller,
2008; Dutta, Gervey, Chan, Chou, & Ditchman,
2008). Individuals with disabilities who are employed
have lower rates of alcohol use, depression, and anxi-
ety and are found to have higher levels of self-esteem
∗ Address for correspondence: John O’Neill, Ph.D. Director,
Employment and Disability Research, Kessler Foundation,
120 Eagle Rock Ave., East Hanover, NJ 07936-3147, USA.
Tel.: +1 973 324 8387; Fax: +1 973 324 8373; E-mail:
[email protected]
and quality of life (Dutta et al., 2008). However,
individuals with disabilities have significantly lower
rates of employment compared to the general popu-
lation, with an estimated 32 percent of working-age
adults with disabilities employed compared to 73
percent of people without disabilities from 2010 to
2012 (U.S. Department of Labor, 2013). Recognizing
the importance of employment to the individual, the
state-federal vocational rehabilitation (VR) program
plays a critical role in reducing vocational disparities,
but only 60 percent of VR consumers success-
fully obtain employment. Despite poor employment
outcomes for people with disabilities overall, evi-
dence suggests that subgroups—defined by type of
1052-2263/17/$35.00 © 2017 – IOS Press and the authors. All
rights reserved
mailto:[email protected]
150 J. O’Neill et al. / Impairment, demographics and
employment in VR
impairment, educational attainment, or demographic
characteristics—have more robust employment
outcomes (Chan et al., 2016).
Furthermore, evidence suggests that competitive
employment provides the greatest benefit on a broad
range of rehabilitation outcomes for people with dis-
abilities. As a result, we undertook the current study
to utilize competitive employment as the outcome
measure since it represents the ideal VR case clo-
sure. Findings can then be more directly applied to
the state-federal VR programs in enacting the mission
of integrated employment outlined by the Workforce
Innovation and Opportunity Act (WIOA) of 2014 and
Rehabilitation Services Administration (RSA).
In this study we specifically examine differ-
ences in type of employment defined as competitive
versus not. While most studies of VR compare
closures with or without employment, recent pol-
icy changes have emphasized the importance of
employment in integrated settings. First, in 2001
RSA updated the definition of employment out-
come for the state-federal VR program to mean
work in an integrated setting (Rehabilitation Services
Administration, 2001). More recently, in 2014 WIOA
amended Title IV of the Rehabilitation Act of 1973
to emphasize competitive integrated employment at
competitive wages as a major initiative (U.S. Depart-
ment of Education, 2014).
The purpose of this study is to examine employ-
ment outcomes for 17 impairment types included
in the RSA-911. We hypothesize that differences
evident among types of impairment will vary
across personal and demographic characteristics
including age, gender, educational attainment, and
race/ethnicity. A better understanding of how impair-
ment type interacts with personal and demographic
factors can enable a greater understanding of facilita-
tors and barriers to vocational success. Moreover, this
improved understanding can be used to help direct
state-federal VR policy and intervention strategies to
improve vocational outcomes.
We find significant differences between type of
employment and impairment type, gender, age, and
education. In contrast to existing research examining
employment alone, we find competitive employment
is lowest among those who are blind or visually
impaired. Competitive employment is also lower for
those with mobility, orthopedic, or mental impair-
ments; women; older clients; and those with lower
levels of educational attainment. Notably, interaction
effects revealed that the differences across demo-
graphic groups vary by type of impairment.
2. Literature review
2.1. Impairment type
Impairment type has been found to be an important
predictor of employment outcomes in the state-
federal VR program. While the RSA-911 contains
19 impairments, research on employment outcomes
often categorize disability type into three broad cat-
egories including: (1) sensory or communicative
disabilities (e.g., visual or hearing impairments);
(2) mental impairments (e.g., serious mental ill-
ness); and (3) physical disabilities (e.g., spinal cord
injury). These studies have found that individuals
with sensory or communicative disabilities typi-
cally have better employment outcomes, followed
by individuals with physical disabilities, and then
by individuals with mental impairments (Rosenthal,
Chan, Wong, Kundu, & Dutta, 2006). Other studies
have focused exclusively on a specific impairment
population, leaving little research examining differ-
ences across the many specific impairments within
the RSA-911. Our intention with the current study is
to systematically study employment outcomes across
17 impairments included in the RSA-911. We are
not able to include two of the 19 impairments due
to limited sample size.
2.2. Gender
The role of gender in employment outcomes of
those with disabilities is mixed in the literature
and not fully understood. It is clear that women
are typically employed at a lower rate when com-
pared to men. However, many studies have failed
to demonstrate a difference in successful case clo-
sure in the state-federal VR program by gender.
While other studies have found that despite having
no impact on the rate of employment, men have sig-
nificantly higher earnings than women (Ireys, Gimm,
& Liu, 2009).
Among people with disabilities, one recent study
found, while men with disabilities are employed
at higher rates than women, the employment gap
between individuals with disabilities and those with-
out disabilities is smaller for women (35 percentage
points) than for men (37 percentage points) (Sevak,
Houtenville, Brucker, & O’Neill, 2015). Those
authors suggest that while there is no theoreti-
cal explanation for this difference, it is possible
that men with disabilities face greater obstacles to
employment. Further research is needed to under-
J. O’Neill et al. / Impairment, demographics and employment in
VR 151
stand the interaction of gender, disability type, and
other personal and demographic factors.
2.3. Race/ethnicity
The rehabilitation literature has found considerable
differences between blacks and whites in VR eligi-
bility, service provision, and employment outcomes.
However, interpretation of these finding is complex,
as the relationship between race and employment out-
comes varies. In a seminal analysis examining race
and VR outcomes, researchers found African Ameri-
cans had lower rates of receipt of VR services, training,
job placement, and wages (Atkins et al., 1980). Con-
temporary analyses continue to find evidence of such
disparities, showing that whites are more likely to
be deemed eligible for VR services (Wilson, 2002;
Wilson, Alston, Harley, & Mitchell, 2002), that
African Americans receive less vocational training
or college and university training (Boutin & Wilson,
2012), and that African Americans are less likely to
be placed in competitive employment (Capella, 2002;
Feist-Price, 1995; Rosenthal et al., 2006; Rosenthal,
Ferrin, & Wilson, 2005; Wilson, 1999).
Despite being the fastest growing segment of the
U.S. population, Latinos have not been the focus of
many studies of VR. One study found that Hispanic
clients were deemed eligible to receive services at
a higher rate than non-Hispanics (including whites,
African Americans, Asians, and Native Americans)
(Wilson & Senices, 2005). Capella (2002) reported
that Hispanics were 1.77 times more likely to be
closed with competitive employment compared to
whites. One recent study found that Latinos had a
smaller disability employment gap than non-Latinos
(Sevak et al., 2015). That study also identified a
smaller gap among Asians.
Some studies have also noted racial differences by
specific health conditions. In an analysis of RSA-911
data, African Americans with a sensory or commu-
nicative disability were 20 percent less likely to obtain
employment through VR, while Native Americans
with a physical or mental impairment were 51 per-
cent and 50 percent less likely, respectively (Dutta
et al., 2008).
2.4. Education
While individuals with disabilities have lower rates
of educational attainment compared to the general
population (Gilmore & Bose, 2005), employment out-
comes are better among people with disabilities who
have higher levels of education than among those with
less education, and the employment gap progressively
declines with higher levels of educational attainment
(Sevak et al., 2015). One study found that individu-
als with disabilities in their twenties and thirties had a
23 percent greater chance of obtaining employment if
they completed high school (Loprest & Maag, 2007),
while another estimated that people with disabilities
have a 50 percent greater chance of employment when
completing college (Gilmore & Bose, 2005). Higher
educational attainment is also associated with higher
earnings for people with disabilities (Beveridge &
Fabian, 2007). Evidence also suggests that the support
from VR program for higher education can improve
employment outcomes and job quality and is one of
the strongest predictors of earnings (Boutin & Wilson,
2009; Manyibe, 2008; Migliore, Timmons, Butter-
worth, & Lugas, 2012). The positive benefit of college
and university training has been demonstrated across
a variety of disability populations, including individu-
als with psychiatric disabilities (Boutin & Accordino,
2011) and those with chronic arthritis (Mamboleo et
al., 2015). These findings suggest that the deployment
of education and training through VR might well work
as an intervention to improve employment outcomes
for people with disabilities.
2.5. Age
An aging population, combined with extensions in
the retirement age for receipt of full Social Security
benefits, will likely increase the need for VR services
for older adults. However, the relationship of age and
VR employment outcomes is unclear.
Several studies have found that, among individ-
uals with chronic health conditions, older age was
associated with lower employment ratings (Ipsen,
2006). One recent study found that the disability
employment gap was the largest during middle age
(Sevak et al., 2015), typically the highest earning
years in an individual’s career. Authors also noted
that decline for the workforce started at age 30
for people with disabilities, compared to age 50
for the general population (Sevak et al., 2015). In
contrast, one study focused on VR clients with a
sensory or communicative disability found that those
over the age of 65 were three times more likely to
successfully obtain competitive employment com-
pared to individuals between 16 and 34. However,
the older VR clients were also more likely to be
employed at application to VR and were seeking
services to maintain employment (Dutta et al., 2008).
152 J. O’Neill et al. / Impairment, demographics and
employment in VR
An important caveat is that many in the general
population are exiting the workforce at this age, and
that the employment gap gets smaller as a result.
3. Methods
3.1. Data
We used case service data from the Rehabilita-
tion Services Administration Case Service Report
(RSA-911) from 2010 to 2013 for the analysis.
The RSA-911 details all cases closed by the state-
federal VR system in a fiscal year. The dataset
includes information about each case, including
demographic information, primary and secondary
disability, employment outcomes, and VR service
utilization. The RSA-911 provides an opportunity to
assess the efficacy of employment services provided
by the state-federal VR program and the context from
which each individual utilizes VR services, facili-
tating a greater understanding of factors that might
enhance successful employment outcomes.
Within states, vocational rehabilitation (VR) agen-
cies are administratively organized in two ways: one
general agency serving all individuals with disabili -
ties or two separate agencies, one for the blind and
one for everyone else. For this analysis, we used data
from all three kinds of agencies but nested individual
observations by state and impairment.
In addition to the data provided in the RSA-911, we
included a variety of state-level variables that could
be related to employment outcomes. These include
the yearly state unemployment rate (from the Bureau
of Labor Statistics); whether the agency was in order
of selection, which means some individuals were
placed on a wait list (from RSA-113 reports); and
the amount of federal funds allocated to the states for
VR per person with disability. The funds provided
per capita variable was calculated by dividing federal
funds provided by RSA (from RSA-113 reports) to
each state by the number of people with disabilities
in the state (from the American Community Survey).
We used single regression imputation (McKnight,
2007) to impute values when federal funds data were
incomplete.
3.2. Sample
Because our study is focused on the qual-
ity of employment outcomes, defined as having
competitive employment or not, the sample was
limited to individuals who were employed at closure.
The sample was further limited to individuals who
lived in the United States, were between the ages
of 18 to 65, were not employed at application, had
no previous closures, and had complete data on all
of the variables used in the models. Due to small
within group sample sizes, the 266 individuals who
were deaf and blind and the 1,018 individuals who
had other hearing impairments were dropped from
the study. The final sample size was 354,414.
The sample (see Table 1 Descriptive Statistics) was
63 percent white, 24 percent African American, and
10 percent Hispanic (any race). Only 1 percent of
the sample was Asian, and 2 percent of the sam-
ple was of other races or multiracial. The scarcity
of individuals in those two smaller race/ethnicity
groups made it very difficult to obtain good infer-
ences about them in the statistical model used later
Table 1
Descriptive statistics
N 354,414
Mean
Age 35.04
Gender Percent
Male 58.87
Female 41.13
Impairment
Blindness 2.53
Other visual 2.33
Deafness visual 1.47
Deafness auditory 0.49
Hearing loss visual 0.49
Hearing loss auditory 2.28
Communicative 0.83
Mobility orthopedic 4.79
Manipulation 2.01
Mobility manipulation 2.82
Other orthopedic 3.99
Respiratory 0.69
General physical 3.39
Other physical 6.56
Cognitive 28.6
Psychosocial 27.53
Other mental 9.2
Education
Less than high school 31.9
High school graduate 37.37
Some college 23.4
College graduate 7.33
Race
White 62.89
Black 23.64
Hispanic 9.75
Asian 1.27
Other 2.46
Employment
Competitively employed 95.97
Not competitively employed 4.03
Source: RSA-911 case service data from 2010 to 2013.
J. O’Neill et al. / Impairment, demographics and employment in
VR 153
in this paper. The average age of the clients was
35 years old. The most frequently observed edu-
cational outcome was a high school diploma (37
percent) followed closely by not finishing high school
(32 percent). Only 7 percent of the sample fin-
ished college. The remaining 23% had some college
or post high school educational experience. The
most frequent impairment category was cognitive
(29 percent).
3.3. Models
We estimated a sequence of five nested logistic
regression models using STATA v 14 (StataCorp,
2014). In these models the outcome variable was
lack of competitive employment. Since 96 percent of
the people in the study obtained competitive employ-
ment, only 4 percent of the sample did not.
In order to have a baseline for the subsequent
models, the null model, which only includes the inter-
cept, was fit. The first nontrivial model only fit the
state variable as a predictor. The second model added
yearly state characteristics such as unemployment
rate, order of selection, and the federal funding per
capita. The third model added the primary impair-
ment variable. The fourth model added educational
and demographic variables. The fifth model added
interactions between an individual’s primary impair-
ment and his or her educational and demographic
characteristics. Based on fit statistics, the fifth model
was chosen to be included in this article.
While our study focuses on differences by indi-
vidual characteristics and we were not primarily
interested in state variables, we did control for the
state variables described above (the unemployment
rate, the mean order of selection from 2010 to 2013,
and the federal grant per person with disability) to
isolate differences by impairment and demographics.
We also controlled for individual receipt of bene-
fits from Social Security disability benefit programs
(SSDI, SSI) because it has been shown to be closely
related to VR employment outcomes (Nord & Nye-
Lengerman, 2015; Schaller, Yang, Ji, & Zuna, 2013).
Due to space constraints, we do not present estimates
for the state variables.
4. Results
The final model contained 81 variables and 158
interacted variables. Given the large sample of
354,414, the traditional p-value of 0.05 could lead to
many false positives. In order to mitigate the poten-
tial for type 1 error, a p-value of 0.01 was used as
a threshold to determine statistical significance. The
large number of variables prohibits the reporting of
each estimate, so we largely limit our presentation of
results to those that are statistically significant. While
we discuss the main effects of variables in the text, we
note that their interpretation is limited and do not dis-
play them in tables. We do display tables and figures
of the estimated interaction effects between impair-
ment, educational attainment, and race/ethnicity.
We discuss the estimates as relative risks for ease
of interpretation. In models where one of the two out-
comes is very small, the odds ratios can be interpreted,
approximately, as the relative risk of lack of competi-
tive employment of the group relative to the reference
group (Agresti, 2013). The reference group used for
the analysis was white men from Alabama who had
hearing loss and communicated with speech and did
not graduate from high school.
4.1. Main effects
Because the model contains a series of interactions,
it is difficult to interpret the coefficients on the indi -
vidual variables, which are often called main effects.
They represent the level difference between the refer-
ence category and a group, whereas the coefficients
on the interacted variables represent the additional
differences between the reference category and a
group. To estimate the full difference in risk between
groups requires multiplying the odds ratios for each
group and its related interactions. We do this and
discuss those estimates in the next section.
Based on a comparison of the noninteracted vari-
ables for type of impairment, we find that blindness
is associated with the highest relative risk for lack
of competitive employment (θ = 7.73, p < 0.001), rel-
ative to the reference impairment group. Visual
impairment is associated with the next highest rela-
tive risk of lack of competitive employment (θ = 4.61,
p < 0.001). Mobility orthopedic impairment is asso-
ciated with the third highest relative risk of lack of
competitive employment (θ = 2.97, p < 0.001), fol-
lowed by other orthopedic impairments (θ = 2.68,
p < 0.01). Cognitive impairments and other mental
impairments were also at a higher risk for lack of com-
petitive employment (θ = 2.45, p < 0.001 and θ = 2.59,
p < 0.002). Lastly, other physical impairments and
psychosocial impairments were at higher risk for
lack of competitive employment (θ = 2.27, p < 0.012;
θ = 2.02, p < 0.015).
154 J. O’Neill et al. / Impairment, demographics and
employment in VR
The odds ratios for noninteracted demographic
variables also revealed significant differences. In gen-
der, females had a greater risk for lack of competitive
employment compared to males (θ = 2.32, p < 0.001).
Greater age was also associated with a higher risk of
lack of competitive employment (θ = 1.05, p < 0.001).
Hispanic ethnicity was associated with half the rela-
tive risk (θ = 0.44, p < 0.001) of non-Hispanic, white
race/ethnicity.
Higher educational achievement was associated
with lower relative risk of lack of competitive
employment. High school completion was associ-
ated with half the relative risk (θ = 0.53, p < 0.001)
of competitive employment relative to those who had
not completed high school. Having an associate’s
degree or some college education is associated with
four times the likelihood of competitive employment
(θ = 0.27, p < 0.001), and having a college degree is
associated with six times the likelihood of competi-
tive employment (θ = 0.17, p < 0.001).
4.2. Interaction effects
As described above, the model included interac-
tions of impairment with gender, age, race/ethnicity,
and education. We first describe findings on inter-
actions between education level and impairment. In
general these interactions revealed that the lower
relative risk associated with higher educational attain-
ment was not as dramatic for most impairment
groups relative to the reference group of hearing
loss with auditory communication. For example,
we estimate odds ratios greater than one for edu-
cational attainment indicators interacted with other
visual (θHS = 1.78, p < 0.003; θSC = 2.66, p < 0.001;
θC = 2.82, p < 0.001) and mobility and manipula-
tion impairments (θHS = 1.99, p < 0.002; θSC = 3.59,
p < 0.001; θC = 6.09, p < 0.001). Additionally, hav-
ing some postsecondary education but not having
completed a bachelor’s degree is associated with
increased relative risk of lack of competitive
employment for people with the following impair-
ments: blindness (θ = 1.78, p < 0.003), deafness
with visual communication (θ = 1.980, p < 0.008),
mobility and orthopedic (θ = 1.97, p < 0.002), respi -
ratory (θ = 3.69, p < 0.003), psychosocial (θ = 2.98,
p < 0.001), and other mental problems (θ = 2.69,
p < 0.001). Lastly, compared to those with a bache-
lor’s degree in the reference group of hearing loss with
auditory communication, risks of non-competitive
outcomes were higher for those with a bache-
lor’s degree deafness with visual communication
Table 2
Estimated relative risk of noncompetitive employment outcome,
by education and impairment
Impairment High School Some College College
Blind 0.6943 0.4844∗ 0.2183
Other visual 0.8997∗ 0.7285∗ 0.4645∗
Deafness visual 0.5386 0.5416∗ 0.5137∗
Deafness auditory 0.6151 0.2425 0.0914
Hearing loss visual 0.6641 0.4508 0.6557∗
Communicative 0.9902 0.7735 0.8330∗
Mobility orthopedic 0.8073 0.5400∗ 0.5239∗
Manipulation 0.6126 0.5404 0.3067
Mobility manipulation 1.0527∗ 0.9818∗ 1.0041∗
Other orthopedic 0.6687 0.4379 0.4479∗
Respiratory 1.9580∗ 1.0574∗ 0.6227
General physical 1.2641 0.6694∗ 0.2531∗
Other physical 0.8134 0.5878∗ 0.4754∗
Cognitive 0.7213 0.4438 0.2513
Psychosocial 0.6790 0.5740∗ 0.4171∗
Other mental 0.8316 0.7361∗ 0.5023∗
Source: Authors’ analysis of the RSA-911 case service data
from
2010 to 2013. Notes: The relative risk of closure without
compet-
itive employment by education is calculated by multiplying the
odds ratios for education group and for the interactions of
impair-
ment and education groups. The logistic regression also
controlled
for age, gender, race/ethnicity, state characteristics by year, and
interactions of these variables with impairment type. ∗ Denotes
statistically significant differences at the 0.01 level.
(θ = 3.11, p < 0.002), hearing loss with visual
communication (θ = 3.98, p < 0.01), communica-
tive (θ = 5.05, p < 0.006), mobility and orthopedic
(θ = 3.18, p < 0.001), other orthopedic (θ = 2.72,
p < 0.006), general physical (θ = 2.45, p < 0.011), psy-
chosocial (θ = 2.53, p < 0.001), and other mental
(θ = 3.05, p < 0.001) impairments.
To facilitate interpretation of the differences in rel -
ative risk by impairment and educational attainment,
in Table 2 we combine the relative risk estimated on
the noninteracted education variables and the educa-
tion variables. These risks can be interpreted relative
to the risk for the reference group hearing loss with
auditory communication with educational attainment
less than high school completion.
The difference in relative risk from one column
to the next can be interpreted as the change in rela-
tive risk by educational attainment. For people with
other visual impairments, an increase in education
from completing high school to having some col-
lege reduces the relative risk of lack of competitive
employment by 19 percent, and an increase in educa-
tion from having some college to completing college
reduces the relative risk by 37 percent. People whose
primary disability is in the mobility and orthopedic
category enjoy a relative risk decrease of 3 per-
cent if they graduate from college instead of having
J. O’Neill et al. / Impairment, demographics and employment in
VR 155
only some postsecondary education. Individuals with
mobility and manipulation impairments benefit from
a 7 percent relative risk reduction if they possess some
postsecondary education but did not earn a bachelor’s
degree. Oddly, persons with a bachelor’s degree in
this impairment category have a 1.7 percent increase
in relative risk compared to people who had only
some postsecondary education. People with a respi-
ratory impairment who possess some postsecondary
education less than a bachelor’s degree have 46 per-
cent reduction in relative risk compared to people who
only graduated high school. Persons with a bachelor’s
degree in the impairment categories general physical,
psychosocial, and other mental have a 37 percent, 27
percent, or 32 percent reduction in relative risk com-
pared to people who had some postsecondary but not
a bachelor’s degree.
Interactions between age and impairment were sta-
tistically significant for the following impairments:
deafness with visual communication (θ = 0.97,
p < 0.002), communicative (θ = 0.96, p < 0.01),
mobility and orthopedic (θ = 0.96, p < 0.001),
mobility and manipulation (θ = 0.97, p < 0.001),
other orthopedic (θ = 0.96, p < 0.001), general
physical (θ = 0.97, p < 0.00), other physical (θ = 0.96,
p < 0.001), cognitive (θ = 0.97, p < 0.001), psy-
chosocial (θ = 0.956, p < 0.001), and other mental
(θ = 0.950, p < 0.001). These estimates indicate that
the increase in relative risk of lack of competitive
employment with increased age is smaller for
these groups. At first glance, the interaction effects
may seem trivial since they are all just slightly
less than one. In reality they are not at all trivial.
Since age is a continuous predictor, the product
of its effect interacting with any variable grows
exponentially. The cumulative age effects graph
(see Fig 1) shows different impairment groups
experience different degrees of relative risk of
lack of competitive employment as they age. For
example, the relative risk of lack of competitive
employment hardly changes over time for those with
psychosocial and other mental impairments. Those
with deafness who communicate visually, however,
have almost a fourfold increase in the relative risk
of lack of competitive employment as they age. The
other five impairment groups fall somewhere in
between.
While the impairment interactions were most
notable by age and education, some additional
interactions were notable. Hispanics with cognitive
impairments were over three times as likely to not be
competitively employed as non-Hispanics if they had
Fig. 1. Estimated relative risk of noncompetitive employment
out-
come, by age and impairment. Source: Authors’ analysis of the
RSA-911 case service data from 2010 to 2013. Notes: The rel -
ative risk of closure without competitive employment by age is
calculated by combining the odds ratios for each age and for
the interaction of age with each impairment group. To simplify
the graph, similar impairment categories with similar growth
rate
were averaged. The logistic regression also controlled for age,
gen-
der, race/ethnicity, state characteristics by year, and
interactions of
these variables with impairment type.
hearing loss with primarily auditory communication
(θ = 3.270, p < 0.001). Women had a reduced relative
risk of lack of competitive employment compared to
men who had a hearing loss whose primary mode
of communication was auditory in five impairment
categories. These were general physical (θ = 0.66,
p < 0.01), other physical (θ = 0.64, p < 0.003), mobil -
ity orthopedic (θ = 0.65, p < 0.005), mobility and
manipulation (θ = 0.591, p < 0.001), and cognitive
(θθ = 0.50, p < 0.001).
While the estimated relative risks for any variable
or interaction may seem large, the predicted prob-
abilities of noncompetitive closure implied by the
model, when taking into account all estimates, were
quite similar. It is important to note two things about
predicted probabilities: (1) small absolute changes
in predicted probabilities can be very meaningful if
all of the predicted probabilities are small; and (2)
they are generated by averaging all the variables in
the model. In this sample, the overall probability of
lack of competitive employment was 4 percent, so
we expect to see the predicted probabilities being
close to 4 percent. All of the predicted probabilities
by any impairment or demographic were between
2 percent and 6 percent except those for blindness
and other visual impairments, which were 22 per-
cent and 18 percent respectively (not shown). This
is not surprising since the approximate relative risks
for those impairments were much higher than for the
other impairments.
156 J. O’Neill et al. / Impairment, demographics and
employment in VR
5. Summary and discussion
We first summarize the results for main effects
and interactions and then discuss some of the impli-
cations for policy and practice. The relative risk of
competitive employment varied across impairment
groups. Women were more likely to not be com-
petively employed than men, though this relationship
was attenuated, but not totally eliminated, for a num-
ber of impairment groups. Hispanics were more likely
to be competively employed than whites, which is
consistent with the literature (Capella, 2002); how -
ever, the relationship was opposite for Hispanics with
cognitve impairments. Increasing levels of education
contributed as much as a sixfold decrease in the risk
of not being competivel y employed, which is con-
sistent with previous research (Boutin & Accordino,
2011; Loprest & Maag, 2007; Mamboleo et al., 2015;
Sevak et al., 2015). However, these positive effects
were somewhat attenuated when we looked at edu-
cation interacting with the impairments. Consistent
with prior research (e.g., Giesen & Cavenaugh, 2013;
Ipsen, 2006), we found that increasing age is a signifi -
cant predictor of poor employment outcomes, but this
effect is substantively smaller for some impairment
groups.
Of particular interest in the findings by impairment
group is that the blind and those with other visual
impairments have a greater risk of not being compet-
itively employed. This finding shows that not all VR
clients with sensory or communicative impairments
have similar employment outcomes and suggests that
combining these groups for analysis runs the risk of
losing important details (Rosenthal et al., 2006).
Women being at greater risk of not becoming
competitively employed may be a consequence of
powerful social role expectations despite changes in
favor of more equality in the professional and domes-
tic lives of men and women (Kvam, Eide, & Vik,
2013). Vocational rehabilitation professionals as well
as family and friends can also have an influence on
women with disabilities not becoming employed by
focusing on family participation instead of employ-
ment (Kvam et al., 2013). Researchers (Doren, Gau,
& Lindstrom, 2011) have recommended that school
and agency personnel who are providing employment
and career services to yong women with disabilities
ensure that these services are free of stereotypical per -
ceptions of womens’ roles related to work and family.
More specifically, they recommend that school and
agency staff engage gender-neutral career assess-
ments and career-related learning experiences and
that young women with disablilties be exposed to
female role models with diabilities who are employed
in high-skill, high-wage jobs to expand career aspi-
rations.
We found that higher levels of educational attain-
ment were associated with significantly reduced risk
of not being competitively employed. This was true
for 12 impairment groups, and the risk reduction
ranged from 3 percent to 46 percent. The good news
is that rates of postsecondary education access are
increasing for students with disabilities, though rates
of completion remain relatively low when compared
to students without disabilities (Madaus, Grigal, &
Hughes, 2014). While our evidence is correlational,
it is consistent with research that suggests relation-
ships between students and academic advisors and
social integration in nonacademic activities while in
postsecondary educational programs may be instru-
mental for students with disabilities persisting to
degree completion (Koch, Mamiseishvili, & Higgins,
2014). These findings point to the importance of
vocational rehabilitation staff working closely with
college disability service staff to focus on more than
accommodations. There is also longitudinal research
pointing to antecedent secondary educational factors
related to completion of postsecondary education;
these factors include students with disabilities self-
advocating, participating in extracurricular activities,
and having opportunities to develop vocational skills
through work-study or paid employment (Achola,
2014). Evidence such as this provides direction to
state vocational rehabilitation agencies as they take
on additional responsibilities under WIOA devoting
15 percent of their budgets to working with special
educational students to ensure a meaningful transi-
tion from high school to postsecondary education and
ultimately competitive employment.
We found a more nuanced story for aging than is
presented in previous studies (e.g., Giesen & Cave-
naugh, 2013; Ipsen, 2006) when we look at the
interaction of age with impairment. We saw great
variation in the degree to which aging is associated
with poorer employment outcomes across impair-
ment groups. This finding is consistent with the more
general observation that older workers are remain-
ing in the labor force for longer. It is estimated that
by 2050 22 percent of the U.S. population will be
over the age of 60 and this aging population will
increase the demand for VR services considering two
factors: (1) many older adults are wanting or needing
to work well beyond the traditional retirement age;
and (2) aging brings with it related chronic illness
J. O’Neill et al. / Impairment, demographics and employment in
VR 157
and disability conditions that can benefit from reha-
bilitation services to enhance productive capacity.
Moreover, employment for older adults is a protective
factor for health and wellness, improves psychosocial
well-being, and life satisfaction (Momtaz, Hamid,
Haron, & Bagat, 2016; Wahrendorf, 2015).
This trend toward older workers staying employed
presents opportunities for vocational rehabilitation
staff to support older workers as they approach
retirement age. For example, among older work-
ers who want to stay in their current jobs either
full time or part time for psychological or finan-
cial reasons, some without disability histories will
develop age-related impairments and need services
to stay employed. In addition, there are individuals
who have had disabilities for some time and who
acquire additional age-related impairments and need
services to keep their jobs. There may also be older
workers with disabilities approaching retirement that
want to leave their current employment situation and
shift to another field of work and look to vocational
rehabilitation practitioners to assist them with career
exploration and securing meaningful employment.
Regardless of the older consumer’s employment aspi-
rations, vocational rehabilitation counselors need to
appreciate that movement into retirement is fraught
with issues related to identity disruption, decision
anxiety, loss of self-assurance, disruption of social
supports, and existential anxiety (Osborne, 2012).
Hershenson (2014) even recommends that counselors
develop an individual retirement plan in addition to an
individual plan for employment for older vocational
rehabilitation consumers.
Acknowledgments
This project was funded by the National Institute
on Disability, Independent Living, and Rehabilitation
Research (U.S. Department of Health and Human
Services) Rehabilitation and Research Training Cen-
ter on Individual Characteristics, under cooperative
agreement 90RT5017-01-01. The findings and con-
clusions are those of the authors and do not represent
the policy of HHS or NIDILRR. The authors retain
sole responsibility for any errors or omissions.
Conflict of interest
The authors have no conflict of interest to report.
References
Achola, E. (2013). Completing college: A longitudinal exam-
ination of potential antecedents of success in post-
secondary education for students with disabilities. Vir-
ginia Commonwealth University VCU Scholars Compass.
http://scholarscompass.vcu.edu/etd
Agresti, A. (2013). Categorical data analysis. Hoboken, NJ:
Wiley.
Atkins, B. J., Wright, G. N., Humphreys, R. R., Provitt, E.,
Bolton,
B., Cooper, P. G. & Cooper, P. G. (1980). Three views: Voca-
tional rehabilitation of blacks. The statement, the response, the
comment. Journal of Rehabilitation, 46(2), 40.
Beveridge, S., & Fabian, E. (2007). Vocational rehabilita-
tion outcomes: Relationship between individualized plan for
employment goals and employment outcomes. Rehabilitation
Counseling Bulletin, 50(4), 238-246.
Bishop, M., Chapin, M. H., & Miller, S. (2008). Quality of life
assessment in the measurement of rehabilitation outcome.
Journal of Rehabilitation, 74(2), 45-55.
Boutin, D. L., & Accordino, M. P. (2011). Importance of col -
legiate training for vocational rehabilitation consumers with
psychiatric disabilities. American Journal of Psychiatric Reha-
bilitation, 14(1), 76-95.
Boutin, D. L., & Wilson, K. (2009). An analysis of vocational
rehabilitation services for consumers with hearing impairments
who received college or university training. Rehabilitation
Counseling Bulletin, 52(3), 156-166.
Boutin, D. L., & Wilson, K. B. (2012). Who is going to college?
Predicting education training from pre-vr consumer character-
istics. Rehabilitation Counseling Bulletin, 55(3), 166-175.
Capella, M. E. (2002). Inequities in the VR system: Do they
still
exist? RehabilitationCounseling Bulletin, 45(3), 143-153.
Chan, F., Wang, C., Fitzgerald, S., Muller, V., Ditchman, N., &
Menz, F. (2016). Personal, environmental, and service-delivery
determinants of employment quality for state vocational
rehabilitation consumers: A multilevel analysis. Journal of
Vocational Rehabilitation, 45(1), 5-18.
Doren, B., Gau, J. M., & Lindsrom, L. (2011). The role of gen-
der in the long-term employment outcomes of young adults
with disabilities. Journal of Vocational Rehabilitation, 34,
35-42
Dutta, A., Gervey, R., Chan, F., Chou, C.-C., & Ditchman, N.
(2008). Vocational rehabilitation services and employment out-
comes for people with disabilities: A United States study.
Journal of Occupational Rehabilitation, 18(4), 326-334.
Feist-Price, S. (1995). African Americans with disabilities and
equity in vocational rehabilitation services: One state’s review.
Rehabilitation Counseling Bulletin, 39(2), 119-129.
Giesen, J. M., & Cavenaugh, B. S. (2013). Disability insurance
beneficiaries with visual impairments in vocational rehabili-
taion: Socio-demographic influences on employment. Journal
of Visual Impairment and Blindness, 107(6), 453-467.
Gilmore, D. S., & Bose, J. (2005). Trends in postsecondary
educa-
tion: Participation within the vocational rehabilitation system.
Journal of Vocational Rehabilitation, 22(1), 33-40.
Hershenson, D. B. (2014). The individual plan for retirement:
A missing part of plan development with older consumers.
Rehabilitation Counseling Bulletin, 59(1), 9-17.
Ipsen, C. (2006). Health, secondary conditions, and employment
outcomes for adults with disabilities. Journal of Disability
Policy Studies, 17(2), 77-87.
http://scholarscompass.vcu.edu/etd
158 J. O’Neill et al. / Impairment, demographics and
employment in VR
Ireys, H. T., Gimm, G., & Liu, S. (2009). The effects of state
policy
decisions on the employment and earnings of Medicaid buy-
in participants in 2006. Journal of Disability Policy Studies,
20(3), 142-154.
Koch, L. C., Mamiseishvili, K., & Higgins, K. (2014).
Persistence
to degree completion: A profile of students with psychiatric
disabilities in higher education. Journal of Vocational Reha-
bilitation, 40, 73-82.
Kvam, L., Eide. A. H., & Vik, K. (2013). Understanding expe-
riences of participation among men and women with chronic
musculoskeletal pain in vocational rehabilitation. Work, 45,
161-174.
Loprest, P., & Maag, E. (2007). The relationship between early
disability onset and education and employment. Journal of
Vocational Rehabilitation, 26(1), 49-62.
Madaus, J. W., Grigal, M., & Hughes, C. (2014). Promoting
access
to postsecondary education for low-income students with dis-
abilities. Career Development and Transition for Exceptional
Individuals, 37(1), 50-59.
Mamboleo, G., Kaya, C., Meyer, L., Kamnetz, B., Bezyak, J.,
& Chan, F. (2015). Vocational rehabilitation services and
outcomes for individuals with arthritis in the United States.
Journal of Vocational Rehabilitation, 42(2), 131-139.
Manyibe, E. O. (2008). Outcomes of individuals with spinal
cord injury served by state vocational rehabilitation services.
Unpublished doctoral dissertation, University of Arizona.
McKnight, P. E. (2007). Missing data: A gentle introduction.
New York: Guilford Press.
Migliore, A., Timmons, J., Butterworth, J., & Lugas, J. (2012).
Predictors of employment and postsecondary education of
youth with autism. Rehabilitation Counseling Bulletin, 55(3),
176-184.
Momtaz, Y. A., Hamid, T. A., Haron, S. A., & Bagat, M. F.
(2016).
Flourishing in later life. Archives of Gerontology and Geri-
atrics, 63, 85-91.
Nord, D., & Ney-Lengerman, K. (2015). The negative effects of
public benefits on individual employment: A multilevel analy-
sis of work hours. Intellectual and Developmental Disabilities,
53, 308-318.
Osborne, J. W. (2012). Psychological effects of the transition to
retirement. Canadian Journal of Counseling and Psychother-
apy, 46(1), 45-58.
Rehabilitation Services Administration (RSA). (2005). Fac-
tors state vocational rehabilitation agencies should consider
when determining whether a job position within a com-
munity rehabilitation program is deemed to be in an
“integrated setting” for purposes of the vocational reha-
bilitation program. Washington, D.C.: Retrieved from
https://www2.ed.gov/policy/speced/guid/rsa/tac-06-01.pdf
Rosenthal, D., Chan, F., Wong, D., Kundu, M., & Dutta, A.
(2006). Predicting employment outcomes based on race, gen-
der, disability, work disincentives, and vocational rehabilitation
service patterns. Journal of Rehabilitation Administration, 29,
229-244.
Rosenthal, D. A., Ferrin, J. M., & Wilson, K. (2005). Accep-
tance rates of African American versus white consumers of
vocational rehabilitation services: A meta-analysis. Journal of
Rehabilitation, 71(3), 36-44.
Schaller, J. L., Yang, N. K., Ji, E. & Zina, N. (2013). Predicting
employment outcomes with depressive/mood disorder from the
RSA data file. Journal of Applied Rehabilitation Counseling,
44, 18-28.
Sevak, P., Houtenville, A. J., Brucker, D. L., & O’Neill, J.
(2015). Individual characteristics and the disability employ-
ment gap. Journal of Disability Policy Studies, 26(2),1-9.
doi:10.1177/1044207315585823
StataCorp. 2014. Stata Statistical Software: Release 14. College
Station, TX: StataCorp LP.
U. S. Department of Education. (2014). The Workforce
Innovation
and Opportunity Act overview of Title IV: Amendments to the
Rehabilitation Act of 1973. Retrieved from https://www2.ed.
gov/about/offices/list/osers/rsa/publications/wioa-changes-to-
rehab-act.pdf/
U.S. Department of Labor (2013). Office of Disability
Employment Policy—Current disability employment statis-
tics. Retrieved from http://www.dol.gov/odep
Wahrendorf, M. (2015). Previous employment histories
and quality of life in older ages: Sequence analyses
using SHARELIFE. Ageing and Society, 35, 1928-1959.
doi:10.1017/S0144686X14000713
Wilson, K. B. (1999). Vocational rehabilitation acceptance: A
tale
of two races in a large midwestern state. Journal of Applied
Rehabilitation Counseling, 30(2), 25-31.
Wilson, K. B. (2002). Exploration of VR acceptance and
ethnicity:
A national investigation. Rehabilitation Counseling Bulletin,
45(3), 168-176.
Wilson, K. B., Alston, R. J., Harley, D. A., & Mitchell, N.
A. (2002). Predicting VR acceptance based on race, gen-
der, education, work status at application, and primary source
of support at application. Rehabilitation Counseling Bulletin,
45(3), 132-142.
Wilson, K. B., & Senices, J. (2005). Exploring the vocational
reha-
bilitation acceptance rates for Hispanics versus non-Hispanics
in the United States. Journal of Counseling and Development,
83(1), 86-96.
https://www2.ed.gov/policy/speced/guid/rsa/tac-06-01.pdf
https://www2.ed.gov/about/offices/list/osers/rsa/publications/wi
oa-changes-to-rehab-act.pdf/
https://www2.ed.gov/about/offices/list/osers/rsa/publications/wi
oa-changes-to-rehab-act.pdf/
http://www.dol.gov/odep
Copyright of Journal of Vocational Rehabilitation is the
property of IOS Press and its content
may not be copied or emailed to multiple sites or posted to a
listserv without the copyright
holder's express written permission. However, users may print,
download, or email articles for
individual use.
Annual Report on Disability Statistics
1
State Level Statistics
Lewis Kraus
Center on Disability at the Public Health Institute
1
I am Lewis Kraus from the Center on Disability at the Public
Health Institute and the lead author of the Disability Statistics
Annual Report. I wanted to review the state level data from the
Annual Report with you today. As some of you are familiar
with the Annual Report, you know that the graphical display of
data by state lends itself to a more nuanced understanding of the
data.
People with Disabilities Living in the Community as a
Percentage of the US Population, by State, 2016
Kraus, L., Lauer, E., Coleman, R., and Houtenville, A. (2018).
2017 Disability Statistics Annual Report. Durham, NH:
University of New Hampshire.
http://disabilitycompendium.org/sites/default/files/user -
uploads/2017AnnualReportSlideDeck
Data Source: 2016 American Community Survey, American
FactFinder, Table B1810
2
First, the percentage of people with disabilities.
In 2016, the state with the lowest percentage of its population
having disabilities was Utah (9.9%).
The state with the highest percentage of people with
disabilities, West Virginia, was more than twice as high with a
percentage of 20.1%. For the most part, higher percentages of
people with disabilities were clustered in the southern US,
around the lower Mississippi river region, with concentrations
also high in the states of Maine, New Mexico, Oklahoma, and
Oregon.
2
People with Disabilities Ages Under 5 Years Living in the
Community, by State, 2016
Kraus, L., Lauer, E., Coleman, R., and Houtenville, A. (2018).
2017 Disability Statistics Annual Report. Durham, NH:
University of New Hampshire.
http://disabilitycompendium.org/sites/default/files/user -
uploads/2017AnnualReportSlideDeck
Data Source: 2016 American Community Survey, FactFinder
Table B1810
3
Looking at the percentage of people with disabilities by age
group, we can see that among children under 5 years old, the
percentage of those with disabilities was very low, about 0.7%
nationally, and 2.8% or less in every state. The states with the
highest percentages were Nevada and Rhode Island. Forty states
had percentages equal to or less than 1.0%.
3
People with Disabilities Ages 5-17 Years Living in the
Community, by State, 2016
Kraus, L., Lauer, E., Coleman, R., and Houtenville, A. (2018).
2017 Disability Statistics Annual Report. Durham, NH:
University of New Hampshire.
http://disabilitycompendium.org/sites/default/files/user -
uploads/2017AnnualReportSlideDeck
Data Source: 2016 American Community Survey, FactFinder
Table B1810
4
For children ages 5-17, the percentages of those with
disabilities ranged from 3.6% in Hawaii to more than twice that
percentage in Maine at 8.3%. In general, percentages for this
age group were lower in the states around the Rockies, the
upper Great Plains, the Pacific Coast and Hawaii, and more
concentrated in the eastern and southern US.
4
People with Disabilities Ages 18-64 Years Living in the
Community, by State, 2016
Kraus, L., Lauer, E., Coleman, R., and Houtenville, A. (2018).
2017 Disability Statistics Annual Report. Durham, NH:
University of New Hampshire.
http://disabilitycompendium.org/sites/default/files/user -
uploads/2017AnnualReportSlideDeck
Data Source: 2016 American Community Survey, FactFinder
Table B1810
5
For adults ages 18-64, the highest percentages of people with
disabilities were in states in the southern US from Oklahoma to
West Virginia, and also Maine and Vermont. The percentage
was lowest in New Jersey and Hawaii (7.9%) and more than
twice as high in West Virginia (17.8%).
5
People with Disabilities Ages 65 and Over Living in the
Community, by State, 2016
Kraus, L., Lauer, E., Coleman, R., and Houtenville, A. (2018).
2017 Disability Statistics Annual Report. Durham, NH:
University of New Hampshire.
http://disabilitycompendium.org/sites/default/files/user -
uploads/2017AnnualReportSlideDeck
Data Source: 2016 American Community Survey, FactFinder
Table B1810
6
As I am sure you are aware, the highest percentages of people
with disabilities were in the US population ages 65 and over;
more than one third of the civilian population for this age group
(35.2%) had disabilities. In nine states, primarily in the South,
the percentage of people ages 65 and over with disabilities was
40% or over, or more than two in every five elderly people:
West Virginia, Kentucky, Oklahoma, Mississippi, Alabama,
Arkansas, New Mexico, Alaska, and Louisiana.
The percentages of people with disabilities were generally
lowest in the Northeast, the central Atlantic states, and some
upper Midwest states; fourteen states had disability percentages
of less than one third (33.3%) of elderly: New Hampshire,
Delaware, Vermont, Maryland, Colorado, Minnesota, Rhode
Island, Connecticut, Wisconsin, Iowa, Massachusetts, New
Jersey, Virginia, and New York.
6
People with Disabilities Living in the Community, by Age
Group and State, 2016
7
Under 5
5-17
18-64
65 and over
Kraus, L., Lauer, E., Coleman, R., and Houtenville, A.
(2018).2017 Disability Statistics Annual Report. Durham, NH:
University of New Hampshire.
http://disabilitycompendium.org/sites/default/files/user-
uploads/2017AnnualReportSlideDeck
Data Source: 2016 American Community Survey, FactFinder
Table B1810
Now if we look at them all together, you can see a pattern
emerging. As the population ages it moves from a disparate,
almost random smattering of high and low disability states for
those under 5 in the upper left map to a slow, but steady move
to the Southern states and Maine and Vermont in the working
ages, ending with a solid block of high disability percentage
states in the central southern US, along with Wyoming and
Alaska for those age 65 and over.
7
Percent Employed Among People with Disabilities, by State,
2016
Kraus, L., Lauer, E., Coleman, R., and Houtenville, A.
(2018).2017 Disability Statistics Annual Report. Durham, NH:
University of New Hampshire.
http://disabilitycompendium.org/sites/default/files/user -
uploads/2017AnnualReportSlideDeck
Data Source: 2016 American Community Survey, American
FactFinder, Table B18120
8
Now let’s turn to a familiar topic – employment. This slide
depicts how rates of employment varied by state. For people
with disabilities, employment rates ranged from a high of 54.0%
(North Dakota) to a low of 27.4% (West Virginia). But you can
see a solid block of high disability employment states in the
upper Midwest and a generally low disability employment
segment in the southeast.
8
Percent Employed Among People without Disabilities, by State,
2016
Kraus, L., Lauer, E., Coleman, R., and Houtenville, A.
(2018).2017 Disability Statistics Annual Report. Durham, NH:
University of New Hampshire.
http://disabilitycompendium.org/sites/default/files/user -
uploads/2017AnnualReportSlideDeck
Data Source: 2016 American Community Survey, American
FactFinder, Table B18120
9
This slide shows that for those without disabilities, the
employment ranged from 70.8% (West Virginia) to 84.2%
(North Dakota).
9
Kraus, L., Lauer, E., Coleman, R., and Houtenville, A.
(2018).2017 Disability Statistics Annual Report. Durham, NH:
University of New Hampshire.
http://disabilitycompendium.org/sites/default/files/user -
uploads/2017AnnualReportSlideDeck
Data Source: 2016 American Community Survey, American
FactFinder, Table B18120
10
Percent of Persons With and Without Disabilities Employed, by
State, 2016
10
With Disabilities Without Disabilities
If you now look at them side by side, you can see that the
general rates of employment follow similar patterns for those
with and without disabilities for the upper Midwest where we
see high rates of employment and the Southeast where we see
low rates of employment. So we chose to present this as a gap
to show where there may be something particular happening for
people with disabilities…[next slide]
10
Gap of Percent Employed Among People with and without
Disabilities, by State, 2016
Data Source: 2016 American Community Survey, American
FactFinder, Table B18120
11
Kraus, L., Lauer, E., Coleman, R., and Houtenville, A.
(2018).2017 Disability Statistics Annual Report. Durham, NH:
University of New Hampshire.
http://disabilitycompendium.org/sites/default/files/user -
uploads/2017AnnualReportSlideDeck
This slide shows the gap in percent employment between those
with and without disabilities by state in 2016. Now those upper
Midwest states’ high employment rates for both people with and
without disabilities change the map. What we are left with is
that states with the largest gap were concentrated generally
from Missouri eastward and California. While the states’
employment gaps narrowed from the previous year, in thirty
four (34) states, the employment percentage gap was 30
percentage points or greater. The highest gaps were in Rhode
Island (39.5 points), Maine (36.4 points), District of Columbia
(35.7 points), New York (35.6 points), Illinois (35.3 points) and
Florida (35.1 points). In only three states was the gap less than
23 percentage points - Alaska (19.8 points), and North and
South Dakota (22.4 points).
11
State Median Earnings, Past 12 Months, Ages 16 and Over with
Disability, 2016
Data Source: 2016 American Community Survey, American
FactFinder, Table B18140
12
Kraus, L., Lauer, E., Coleman, R., and Houtenville, A.
(2018).2017 Disability Statistics Annual Report. Durham, NH:
University of New Hampshire.
http://disabilitycompendium.org/si tes/default/files/user-
uploads/2017AnnualReportSlideDeck
Looking now at median earnings by state, this slide shows the
range of median earnings in states for people with disabilities in
2016 was $17,480 in West Virginia to $30,559 in Alaska. In
eleven states (Alaska, Maryland, District of Columbia, New
Jersey, Hawaii, Nevada, Virginia, Delaware, Connecticut, North
Dakota, and Washington), the median earnings for people with
disabilities was over $25,000, while six states had median
earnings for people with disabilities lower than $20,000
(Minnesota, Wisconsin, Maine, Michigan, Montana, and West
Virginia).
12
State Median Earnings, Past 12 Months, Ages 16 and Over
without Disability, 2016
Data Source: 2016 American Community Survey, American
FactFinder, Table B18140
13
Kraus, L., Lauer, E., Coleman, R., and Houtenville, A.
(2018).2017 Disability Statistics Annual Report. Durham, NH:
University of New Hampshire.
http://disabilitycompendium.org/sites/default/files/user -
uploads/2017AnnualReportSlideDec k
In comparison to the last slide, the median earnings for people
without disabilities ages 16 and over ranged from $27,431 in
Idaho to $51,302 in the District of Columbia in 2016.
13
Median Earnings Gap of People 16 Years and Over in the Past
12 Months, by State, 2016
Data Source: 2016 American Community Survey, American
FactFinder, Table B18140
14
Kraus, L., Lauer, E., Coleman, R., and Houtenville, A.
(2018).2017 Disability Statistics Annual Report. Durham, NH:
University of New Hampshire.
http://disabilitycompendium.org/sites/default/files/user -
uploads/2017AnnualReportSlideDeck
Now, using the gap map again, we can see that while states
varied widely in earnings gap – from a low of $5,242 in Idaho
to a high of $23,144 in the District of Columbia, generally,
states in the northeastern US had a higher earnings gap; states
in the southern US had a lower earnings gap
14
Poverty Percentage Gap Among People with and without
Disabilities, by State, 2016
Data Source: 2016 American Community Survey, American
FactFinder, Table B18130
15
Kraus, L., Lauer, E., Coleman, R., and Houtenville, A.
(2018).2017 Disability Statistics Annual Report. Durham, NH:
University of New Hampshire.
http://disabilitycompendium.org/sites/default/files/user -
uploads/2017AnnualReportSlideDeck
Moving on to Poverty. Here is the poverty gap between those
with and without disabilities by state in 2016. The highest
poverty gaps were seen mostly in the Northeast US, states
bordering the Great Lakes, Kentucky, Missouri, and South
Dakota. Gaps ranged from a high of 14.0 percentage points
(District of Columbia) to a low of 1.5 percentage points in New
Mexico.
15
Poverty Percentage Gap Among People
Ages 5 and Under with and without Disabilities,
by State, 2016
Data Source: 2016 American Community Survey, American
FactFinder, Table B18130
16
Kraus, L., Lauer, E., Coleman, R., and Houtenville, A.
(2018).2017 Disability Statistics Annual Report. Durham, NH:
University of New Hampshire.
http://disabilitycompendium.org/sites/default/files/user-
uploads/2017AnnualReportSlideDeck
For children under age 5, the poverty gap was highest in New
Hampshire (60.3 percentage points), Arkansas (47.2), and
Mississippi (42.6). For children ages 5 and under, fifteen states
had a negative poverty gap (a higher percentage of those
without disabilities were in poverty than those with
disabilities).
16
Poverty Percentage Gap Among People
Ages 5-17 with and without Disabilities,
by State, 2016
Data Source: 2016 American Community Survey, American
FactFinder, Table B18130
17
Kraus, L., Lauer, E., Coleman, R., and Houtenville, A.
(2018).2017 Disability Statistics Annual Report. Durham, NH:
University of New Hampshire.
http://disabilitycompendium.org/sites/default/files/user -
uploads/2017AnnualReportSlideDeck
The poverty gap for those ages 5-17 with and without
disabilities ranged from a low of 1.3 percentage points in
Hawaii to 19 points in Maine.
There are nine states with a gap of at least 15 points and 26
with a gap of at least 10 points, meaning that in those states the
poverty rates were 10-15 or more percentage points higher for
those with disabilities than for those without disabilities.
17
Poverty Percentage Gap Among People Ages 18-64 with and
without Disabilities,
by State, 2016
Data Source: 2016 American Community Survey, American
FactFinder, Table B18130
18
Kraus, L., Lauer, E., Coleman, R., and Houtenville, A.
(2018).2017 Disability Statistics Annual Report. Durham, NH:
University of New Hampshire.
http://disabilitycompendium.org/sites/default/files/user-
uploads/2017AnnualReportSlideDeck
For people in the 18-64 year old working- age, the poverty gap
between those with and without disabilities ranged from a low
of 7.4 percentage points in Delaware to a high of 24.8 poi nts in
District of Columbia. Nearly half of the states (24) had gaps of
15 points or more. All but 3 states had gaps over 10 points or
more.
18
Poverty Percentage Gap Among People
Ages 65 and Over with and without Disabilities, by State, 2016
Data Source: 2016 American Community Survey, American
FactFinder, Table B18130
19
Kraus, L., Lauer, E., Coleman, R., and Houtenville, A.
(2018).2017 Disability Statistics Annual Report. Durham, NH:
University of New Hampshire.
http://disabilitycompendium.org/si tes/default/files/user-
uploads/2017AnnualReportSlideDeck
Poverty gaps for those age 65 and over with and without
disabilities had a low of 1.7 percentage points (Nevada) to 8.6
points (South Dakota) in 2016. Three states had gaps below 3
points (Nevada, Vermont, and Delaware).
19
Smoking Percentages Gap Among People
with and without Disabilities By State, 2016
Data Source: Authors' calculations using data from the 2016
Behavioral Risk Factor Surveillance Survey BRFSS *
20
Kraus, L., Lauer, E., Coleman, R., and Houtenville, A.
(2018).2017 Disability Statistics Annual Report. Durham, NH:
University of New Hampshire.
http://disabilitycompendium.org/sites/default/files/user -
uploads/2017AnnualReportSlideDeck
Turning now to health, the gap between smokers with and
without disabilities by state in 2016 ranged from a low of 5.2
percentage points in South Dakota to a high of 16.6 points in
Missouri. Thirty six states had a gap of 10 percentage points or
higher; South Dakota was the only state to have a gap of 6
percentage points or lower.
*- Note that this data is from the Behavioral Risk Factor
Surveillance System (BRFSS), which in 2016 changed the
questions used measure disability to match those used in the
American Community Survey (ACS).
20
Obesity Percentages Gap Among People
with and without Disabilities, by State, 2016
Data Source: Authors' calculations using data from the 2016
Behavioral Risk Factor Surveillance Survey BRFSS
21
Kraus, L., Lauer, E., Coleman, R., and Houtenville, A.
(2018).2017 Disability Statistics Annual Report. Durham, NH:
University of New Hampshire.
http://disabilitycompendium.org/sites/default/files/user -
uploads/2017AnnualReportSlideDeck
This slide shows that the gap in obesity percentages for states
ranged from a high of 16.8% in Rhode Island to a low of 7.3%
in Mississippi. Nine states had a gap under 10 percentage points
while seven states had a gap of 15 points or more.
21
Binge Drinking Percentage Gap Among
People with and without Disabilities,
by State, 2016
Data Source: Authors' calculations using data from the 2016
Behavioral Risk Factor Surveillance Survey BRFSS
22
Kraus, L., Lauer, E., Coleman, R., and Houtenville, A.
(2018).2017 Disability Statistics Annual Report. Durham, NH:
University of New Hampshire.
http://disabilitycompendium.org/sites/default/files/user -
uploads/2017AnnualReportSlideDeck
This slide shows gaps in binge drinking for people with and
without disabilities by state in 2016. Gaps in binge drinking for
those ages 18 and over ranged from 11.7 points less (thus more
people without disabilities binge drinking than those with
disabilities) in District of Columbia to 1.6 points less in Utah.
Twenty one states had a gap of less than 5 points.
22
For more information
Lewis Kraus
Center on Disability at the Public Health Institute
510-285-5600
[email protected]
23
23
1187326 - Wiley US ©
Appendix A
Specimen Financial Statements: Apple
Inc.
Once each year, a corporation communicates to its stockholders
and other interested
parties by issuing a complete set of audited financial
statements. The annual report, as
this communication is called, summarizes the financial results
of the company's
operations for the year and its plans for the future. Many annual
reports are attractive,
multicolored, glossy public relations pieces, containing pictures
of corporate officers and
directors as well as photos and descriptions of new products and
new buildings. Yet the
basic function of every annual report is to report financial
information, almost all of which
is a product of the corporation's accounting system.
The content and organization of corporate annual reports have
become fairly
standardized. Excluding the public relations part of the report
(pictures, products, etc.), the
following are the traditional financial portions of the annual
report:
Financial Highlights
Letter to the Stockholders
Management's Discussion and Analysis
Financial Statements
Notes to the Financial Statements
Management's Responsibility for Financial Reporting
Management's Report on Internal Control over Financial
Reporting
Report of Independent Registered Public Accounting Firm
Selected Financial Data
The official SEC filing of the annual report is called a Form 10-
K, which often omits the
public relations pieces found in most standard annual reports.
On the following pages, we
present Apple Inc.'s financial statements taken from the
company's 2017 Form 10-K. The
complete Form 10-K, including notes to the financial
statements, is available at the
company's website.
1187326 - Wiley US ©
Financial Reporting Problem Apple Inc.CT7.1  The financial statem

More Related Content

Similar to Financial Reporting Problem Apple Inc.CT7.1 The financial statem

Draper - Emergency Influences in the United States Healthcare System - Perspe...
Draper - Emergency Influences in the United States Healthcare System - Perspe...Draper - Emergency Influences in the United States Healthcare System - Perspe...
Draper - Emergency Influences in the United States Healthcare System - Perspe...Ed Draper
 
The Effects of Unemployment Benefits on Unemployment and Labor Force Particip...
The Effects of Unemployment Benefits on Unemployment and Labor Force Particip...The Effects of Unemployment Benefits on Unemployment and Labor Force Particip...
The Effects of Unemployment Benefits on Unemployment and Labor Force Particip...Luis Taveras EMBA, MS
 
The Pay Gap Between Male and Female Employees
The Pay Gap Between Male and Female EmployeesThe Pay Gap Between Male and Female Employees
The Pay Gap Between Male and Female EmployeesESSAYSHARK.com
 
Greece youth unemployment
Greece youth unemploymentGreece youth unemployment
Greece youth unemploymentBrave Skills
 
Casual modelling in sociology carmine gelormini
Casual modelling in sociology   carmine gelorminiCasual modelling in sociology   carmine gelormini
Casual modelling in sociology carmine gelorminiCarmineGelormini
 
IMPACT OF PATERNALISTIC LEADERSHIP ON EMPLOYEE COMMITMENT AND INNOVATIVE WOR...
IMPACT OF PATERNALISTIC LEADERSHIP ON EMPLOYEE  COMMITMENT AND INNOVATIVE WOR...IMPACT OF PATERNALISTIC LEADERSHIP ON EMPLOYEE  COMMITMENT AND INNOVATIVE WOR...
IMPACT OF PATERNALISTIC LEADERSHIP ON EMPLOYEE COMMITMENT AND INNOVATIVE WOR...MehranMouzam
 
CAPE Caribbean Studies Internal Assessment
CAPE Caribbean Studies Internal AssessmentCAPE Caribbean Studies Internal Assessment
CAPE Caribbean Studies Internal AssessmentCamilla Holgate
 
Attitudinal and environmental factors as determinants of job
Attitudinal and environmental factors as determinants of jobAttitudinal and environmental factors as determinants of job
Attitudinal and environmental factors as determinants of jobAlexander Decker
 
Autism In The Workplace Assessing The Transition Needs Of Young Adults With ...
Autism In The Workplace  Assessing The Transition Needs Of Young Adults With ...Autism In The Workplace  Assessing The Transition Needs Of Young Adults With ...
Autism In The Workplace Assessing The Transition Needs Of Young Adults With ...Jeff Brooks
 
People With Disabilities
People With DisabilitiesPeople With Disabilities
People With Disabilitiesdebdolittle
 
Building a Disability-Inclusive Workplace [webinar]
Building a Disability-Inclusive Workplace [webinar] Building a Disability-Inclusive Workplace [webinar]
Building a Disability-Inclusive Workplace [webinar] eCornell
 
Disability as a Diversity Factor_Implications for HRM practices
Disability as a Diversity Factor_Implications for HRM practices Disability as a Diversity Factor_Implications for HRM practices
Disability as a Diversity Factor_Implications for HRM practices Charles Cotter, PhD
 
Defining and Measuring the Informal Sector
Defining and Measuring the Informal SectorDefining and Measuring the Informal Sector
Defining and Measuring the Informal SectorDr Lendy Spires
 
Young Adults with Disabilities in Israel--Integration into Employment
Young Adults with Disabilities in Israel--Integration into EmploymentYoung Adults with Disabilities in Israel--Integration into Employment
Young Adults with Disabilities in Israel--Integration into Employmentmjbinstitute
 
Impact of career enablers and flexible working methods on workforce participa...
Impact of career enablers and flexible working methods on workforce participa...Impact of career enablers and flexible working methods on workforce participa...
Impact of career enablers and flexible working methods on workforce participa...IAEME Publication
 

Similar to Financial Reporting Problem Apple Inc.CT7.1 The financial statem (20)

Draper - Emergency Influences in the United States Healthcare System - Perspe...
Draper - Emergency Influences in the United States Healthcare System - Perspe...Draper - Emergency Influences in the United States Healthcare System - Perspe...
Draper - Emergency Influences in the United States Healthcare System - Perspe...
 
The Effects of Unemployment Benefits on Unemployment and Labor Force Particip...
The Effects of Unemployment Benefits on Unemployment and Labor Force Particip...The Effects of Unemployment Benefits on Unemployment and Labor Force Particip...
The Effects of Unemployment Benefits on Unemployment and Labor Force Particip...
 
The Pay Gap Between Male and Female Employees
The Pay Gap Between Male and Female EmployeesThe Pay Gap Between Male and Female Employees
The Pay Gap Between Male and Female Employees
 
Workplace Gender Equality In The Construction Industry
Workplace Gender Equality In The Construction IndustryWorkplace Gender Equality In The Construction Industry
Workplace Gender Equality In The Construction Industry
 
PWTD Rec & Retention
PWTD Rec & Retention PWTD Rec & Retention
PWTD Rec & Retention
 
employer perceptions of social business
employer perceptions of social businessemployer perceptions of social business
employer perceptions of social business
 
Topic 6.pptx
Topic 6.pptxTopic 6.pptx
Topic 6.pptx
 
Essay On Unemployment In India
Essay On Unemployment In IndiaEssay On Unemployment In India
Essay On Unemployment In India
 
Greece youth unemployment
Greece youth unemploymentGreece youth unemployment
Greece youth unemployment
 
Casual modelling in sociology carmine gelormini
Casual modelling in sociology   carmine gelorminiCasual modelling in sociology   carmine gelormini
Casual modelling in sociology carmine gelormini
 
IMPACT OF PATERNALISTIC LEADERSHIP ON EMPLOYEE COMMITMENT AND INNOVATIVE WOR...
IMPACT OF PATERNALISTIC LEADERSHIP ON EMPLOYEE  COMMITMENT AND INNOVATIVE WOR...IMPACT OF PATERNALISTIC LEADERSHIP ON EMPLOYEE  COMMITMENT AND INNOVATIVE WOR...
IMPACT OF PATERNALISTIC LEADERSHIP ON EMPLOYEE COMMITMENT AND INNOVATIVE WOR...
 
CAPE Caribbean Studies Internal Assessment
CAPE Caribbean Studies Internal AssessmentCAPE Caribbean Studies Internal Assessment
CAPE Caribbean Studies Internal Assessment
 
Attitudinal and environmental factors as determinants of job
Attitudinal and environmental factors as determinants of jobAttitudinal and environmental factors as determinants of job
Attitudinal and environmental factors as determinants of job
 
Autism In The Workplace Assessing The Transition Needs Of Young Adults With ...
Autism In The Workplace  Assessing The Transition Needs Of Young Adults With ...Autism In The Workplace  Assessing The Transition Needs Of Young Adults With ...
Autism In The Workplace Assessing The Transition Needs Of Young Adults With ...
 
People With Disabilities
People With DisabilitiesPeople With Disabilities
People With Disabilities
 
Building a Disability-Inclusive Workplace [webinar]
Building a Disability-Inclusive Workplace [webinar] Building a Disability-Inclusive Workplace [webinar]
Building a Disability-Inclusive Workplace [webinar]
 
Disability as a Diversity Factor_Implications for HRM practices
Disability as a Diversity Factor_Implications for HRM practices Disability as a Diversity Factor_Implications for HRM practices
Disability as a Diversity Factor_Implications for HRM practices
 
Defining and Measuring the Informal Sector
Defining and Measuring the Informal SectorDefining and Measuring the Informal Sector
Defining and Measuring the Informal Sector
 
Young Adults with Disabilities in Israel--Integration into Employment
Young Adults with Disabilities in Israel--Integration into EmploymentYoung Adults with Disabilities in Israel--Integration into Employment
Young Adults with Disabilities in Israel--Integration into Employment
 
Impact of career enablers and flexible working methods on workforce participa...
Impact of career enablers and flexible working methods on workforce participa...Impact of career enablers and flexible working methods on workforce participa...
Impact of career enablers and flexible working methods on workforce participa...
 

More from ChereCheek752

please read the attached file cearfully before telling me you can do.docx
please read the attached file cearfully before telling me you can do.docxplease read the attached file cearfully before telling me you can do.docx
please read the attached file cearfully before telling me you can do.docxChereCheek752
 
please read my post carefully.then place handshakei have the wor.docx
please read my post carefully.then place handshakei have the wor.docxplease read my post carefully.then place handshakei have the wor.docx
please read my post carefully.then place handshakei have the wor.docxChereCheek752
 
Please read the attachment.Please write a pure Essay Paper. Plea.docx
Please read the attachment.Please write a pure Essay Paper. Plea.docxPlease read the attachment.Please write a pure Essay Paper. Plea.docx
Please read the attachment.Please write a pure Essay Paper. Plea.docxChereCheek752
 
Please read first because this Assignment is for correction.Plea.docx
Please read first because this Assignment is for correction.Plea.docxPlease read first because this Assignment is for correction.Plea.docx
Please read first because this Assignment is for correction.Plea.docxChereCheek752
 
Please read below, and write esaay.I need 3 pages.Overvi.docx
Please read below, and write esaay.I need 3 pages.Overvi.docxPlease read below, and write esaay.I need 3 pages.Overvi.docx
Please read below, and write esaay.I need 3 pages.Overvi.docxChereCheek752
 
Please Read Before RespondingI need assistance with a .docx
Please Read Before RespondingI need assistance with a .docxPlease Read Before RespondingI need assistance with a .docx
Please Read Before RespondingI need assistance with a .docxChereCheek752
 
Please provide response to the below post. Topic #1) You are an .docx
Please provide response to the below post. Topic #1) You are an .docxPlease provide response to the below post. Topic #1) You are an .docx
Please provide response to the below post. Topic #1) You are an .docxChereCheek752
 
Please provide an annotation for the two articles attached AND ide.docx
Please provide an annotation for the two articles attached AND ide.docxPlease provide an annotation for the two articles attached AND ide.docx
Please provide an annotation for the two articles attached AND ide.docxChereCheek752
 
Please provide a statement that addresses your reasons for transferr.docx
Please provide a statement that addresses your reasons for transferr.docxPlease provide a statement that addresses your reasons for transferr.docx
Please provide a statement that addresses your reasons for transferr.docxChereCheek752
 
Please provide a brief response to the following questions1) How .docx
Please provide a brief response to the following questions1) How .docxPlease provide a brief response to the following questions1) How .docx
Please provide a brief response to the following questions1) How .docxChereCheek752
 
PLEASE NOTE OF SOURCESMATERIALS ALSO INCLUDED---USE THEMT.docx
PLEASE NOTE OF SOURCESMATERIALS ALSO INCLUDED---USE THEMT.docxPLEASE NOTE OF SOURCESMATERIALS ALSO INCLUDED---USE THEMT.docx
PLEASE NOTE OF SOURCESMATERIALS ALSO INCLUDED---USE THEMT.docxChereCheek752
 
Please note that the following vignettes represent samples of the ty.docx
Please note that the following vignettes represent samples of the ty.docxPlease note that the following vignettes represent samples of the ty.docx
Please note that the following vignettes represent samples of the ty.docxChereCheek752
 
Please no plagiarism. I have attached an example to go by. The popul.docx
Please no plagiarism. I have attached an example to go by. The popul.docxPlease no plagiarism. I have attached an example to go by. The popul.docx
Please no plagiarism. I have attached an example to go by. The popul.docxChereCheek752
 
PLEASE NO PLAGIARIZE!! Have 10 hours to fullfil this work. 1page or .docx
PLEASE NO PLAGIARIZE!! Have 10 hours to fullfil this work. 1page or .docxPLEASE NO PLAGIARIZE!! Have 10 hours to fullfil this work. 1page or .docx
PLEASE NO PLAGIARIZE!! Have 10 hours to fullfil this work. 1page or .docxChereCheek752
 
Please Paraphrase the following into a more scholarly toneI f.docx
Please Paraphrase the following into a more scholarly toneI f.docxPlease Paraphrase the following into a more scholarly toneI f.docx
Please Paraphrase the following into a more scholarly toneI f.docxChereCheek752
 
Please only respond if you are familiar with raspberry piIam loo.docx
Please only respond if you are familiar with raspberry piIam loo.docxPlease only respond if you are familiar with raspberry piIam loo.docx
Please only respond if you are familiar with raspberry piIam loo.docxChereCheek752
 
Please note this is 2 ASSIGNMENTS ......Please only orginial work on.docx
Please note this is 2 ASSIGNMENTS ......Please only orginial work on.docxPlease note this is 2 ASSIGNMENTS ......Please only orginial work on.docx
Please note this is 2 ASSIGNMENTS ......Please only orginial work on.docxChereCheek752
 
PLEASE NEED TWO RESPONSES TWO HUNDRED WORDS EACHDistinguish b.docx
PLEASE NEED TWO RESPONSES TWO HUNDRED WORDS EACHDistinguish b.docxPLEASE NEED TWO RESPONSES TWO HUNDRED WORDS EACHDistinguish b.docx
PLEASE NEED TWO RESPONSES TWO HUNDRED WORDS EACHDistinguish b.docxChereCheek752
 
Please no plagiarism and make sure you are able to access all resour.docx
Please no plagiarism and make sure you are able to access all resour.docxPlease no plagiarism and make sure you are able to access all resour.docx
Please no plagiarism and make sure you are able to access all resour.docxChereCheek752
 
Please need two posts of 200 words each. Discuss the ways in whi.docx
Please need two posts of 200 words each. Discuss the ways in whi.docxPlease need two posts of 200 words each. Discuss the ways in whi.docx
Please need two posts of 200 words each. Discuss the ways in whi.docxChereCheek752
 

More from ChereCheek752 (20)

please read the attached file cearfully before telling me you can do.docx
please read the attached file cearfully before telling me you can do.docxplease read the attached file cearfully before telling me you can do.docx
please read the attached file cearfully before telling me you can do.docx
 
please read my post carefully.then place handshakei have the wor.docx
please read my post carefully.then place handshakei have the wor.docxplease read my post carefully.then place handshakei have the wor.docx
please read my post carefully.then place handshakei have the wor.docx
 
Please read the attachment.Please write a pure Essay Paper. Plea.docx
Please read the attachment.Please write a pure Essay Paper. Plea.docxPlease read the attachment.Please write a pure Essay Paper. Plea.docx
Please read the attachment.Please write a pure Essay Paper. Plea.docx
 
Please read first because this Assignment is for correction.Plea.docx
Please read first because this Assignment is for correction.Plea.docxPlease read first because this Assignment is for correction.Plea.docx
Please read first because this Assignment is for correction.Plea.docx
 
Please read below, and write esaay.I need 3 pages.Overvi.docx
Please read below, and write esaay.I need 3 pages.Overvi.docxPlease read below, and write esaay.I need 3 pages.Overvi.docx
Please read below, and write esaay.I need 3 pages.Overvi.docx
 
Please Read Before RespondingI need assistance with a .docx
Please Read Before RespondingI need assistance with a .docxPlease Read Before RespondingI need assistance with a .docx
Please Read Before RespondingI need assistance with a .docx
 
Please provide response to the below post. Topic #1) You are an .docx
Please provide response to the below post. Topic #1) You are an .docxPlease provide response to the below post. Topic #1) You are an .docx
Please provide response to the below post. Topic #1) You are an .docx
 
Please provide an annotation for the two articles attached AND ide.docx
Please provide an annotation for the two articles attached AND ide.docxPlease provide an annotation for the two articles attached AND ide.docx
Please provide an annotation for the two articles attached AND ide.docx
 
Please provide a statement that addresses your reasons for transferr.docx
Please provide a statement that addresses your reasons for transferr.docxPlease provide a statement that addresses your reasons for transferr.docx
Please provide a statement that addresses your reasons for transferr.docx
 
Please provide a brief response to the following questions1) How .docx
Please provide a brief response to the following questions1) How .docxPlease provide a brief response to the following questions1) How .docx
Please provide a brief response to the following questions1) How .docx
 
PLEASE NOTE OF SOURCESMATERIALS ALSO INCLUDED---USE THEMT.docx
PLEASE NOTE OF SOURCESMATERIALS ALSO INCLUDED---USE THEMT.docxPLEASE NOTE OF SOURCESMATERIALS ALSO INCLUDED---USE THEMT.docx
PLEASE NOTE OF SOURCESMATERIALS ALSO INCLUDED---USE THEMT.docx
 
Please note that the following vignettes represent samples of the ty.docx
Please note that the following vignettes represent samples of the ty.docxPlease note that the following vignettes represent samples of the ty.docx
Please note that the following vignettes represent samples of the ty.docx
 
Please no plagiarism. I have attached an example to go by. The popul.docx
Please no plagiarism. I have attached an example to go by. The popul.docxPlease no plagiarism. I have attached an example to go by. The popul.docx
Please no plagiarism. I have attached an example to go by. The popul.docx
 
PLEASE NO PLAGIARIZE!! Have 10 hours to fullfil this work. 1page or .docx
PLEASE NO PLAGIARIZE!! Have 10 hours to fullfil this work. 1page or .docxPLEASE NO PLAGIARIZE!! Have 10 hours to fullfil this work. 1page or .docx
PLEASE NO PLAGIARIZE!! Have 10 hours to fullfil this work. 1page or .docx
 
Please Paraphrase the following into a more scholarly toneI f.docx
Please Paraphrase the following into a more scholarly toneI f.docxPlease Paraphrase the following into a more scholarly toneI f.docx
Please Paraphrase the following into a more scholarly toneI f.docx
 
Please only respond if you are familiar with raspberry piIam loo.docx
Please only respond if you are familiar with raspberry piIam loo.docxPlease only respond if you are familiar with raspberry piIam loo.docx
Please only respond if you are familiar with raspberry piIam loo.docx
 
Please note this is 2 ASSIGNMENTS ......Please only orginial work on.docx
Please note this is 2 ASSIGNMENTS ......Please only orginial work on.docxPlease note this is 2 ASSIGNMENTS ......Please only orginial work on.docx
Please note this is 2 ASSIGNMENTS ......Please only orginial work on.docx
 
PLEASE NEED TWO RESPONSES TWO HUNDRED WORDS EACHDistinguish b.docx
PLEASE NEED TWO RESPONSES TWO HUNDRED WORDS EACHDistinguish b.docxPLEASE NEED TWO RESPONSES TWO HUNDRED WORDS EACHDistinguish b.docx
PLEASE NEED TWO RESPONSES TWO HUNDRED WORDS EACHDistinguish b.docx
 
Please no plagiarism and make sure you are able to access all resour.docx
Please no plagiarism and make sure you are able to access all resour.docxPlease no plagiarism and make sure you are able to access all resour.docx
Please no plagiarism and make sure you are able to access all resour.docx
 
Please need two posts of 200 words each. Discuss the ways in whi.docx
Please need two posts of 200 words each. Discuss the ways in whi.docxPlease need two posts of 200 words each. Discuss the ways in whi.docx
Please need two posts of 200 words each. Discuss the ways in whi.docx
 

Recently uploaded

Seal of Good Local Governance (SGLG) 2024Final.pptx
Seal of Good Local Governance (SGLG) 2024Final.pptxSeal of Good Local Governance (SGLG) 2024Final.pptx
Seal of Good Local Governance (SGLG) 2024Final.pptxnegromaestrong
 
Z Score,T Score, Percential Rank and Box Plot Graph
Z Score,T Score, Percential Rank and Box Plot GraphZ Score,T Score, Percential Rank and Box Plot Graph
Z Score,T Score, Percential Rank and Box Plot GraphThiyagu K
 
On National Teacher Day, meet the 2024-25 Kenan Fellows
On National Teacher Day, meet the 2024-25 Kenan FellowsOn National Teacher Day, meet the 2024-25 Kenan Fellows
On National Teacher Day, meet the 2024-25 Kenan FellowsMebane Rash
 
Role Of Transgenic Animal In Target Validation-1.pptx
Role Of Transgenic Animal In Target Validation-1.pptxRole Of Transgenic Animal In Target Validation-1.pptx
Role Of Transgenic Animal In Target Validation-1.pptxNikitaBankoti2
 
TỔNG ÔN TẬP THI VÀO LỚP 10 MÔN TIẾNG ANH NĂM HỌC 2023 - 2024 CÓ ĐÁP ÁN (NGỮ Â...
TỔNG ÔN TẬP THI VÀO LỚP 10 MÔN TIẾNG ANH NĂM HỌC 2023 - 2024 CÓ ĐÁP ÁN (NGỮ Â...TỔNG ÔN TẬP THI VÀO LỚP 10 MÔN TIẾNG ANH NĂM HỌC 2023 - 2024 CÓ ĐÁP ÁN (NGỮ Â...
TỔNG ÔN TẬP THI VÀO LỚP 10 MÔN TIẾNG ANH NĂM HỌC 2023 - 2024 CÓ ĐÁP ÁN (NGỮ Â...Nguyen Thanh Tu Collection
 
Making and Justifying Mathematical Decisions.pdf
Making and Justifying Mathematical Decisions.pdfMaking and Justifying Mathematical Decisions.pdf
Making and Justifying Mathematical Decisions.pdfChris Hunter
 
Python Notes for mca i year students osmania university.docx
Python Notes for mca i year students osmania university.docxPython Notes for mca i year students osmania university.docx
Python Notes for mca i year students osmania university.docxRamakrishna Reddy Bijjam
 
Application orientated numerical on hev.ppt
Application orientated numerical on hev.pptApplication orientated numerical on hev.ppt
Application orientated numerical on hev.pptRamjanShidvankar
 
ComPTIA Overview | Comptia Security+ Book SY0-701
ComPTIA Overview | Comptia Security+ Book SY0-701ComPTIA Overview | Comptia Security+ Book SY0-701
ComPTIA Overview | Comptia Security+ Book SY0-701bronxfugly43
 
Presentation by Andreas Schleicher Tackling the School Absenteeism Crisis 30 ...
Presentation by Andreas Schleicher Tackling the School Absenteeism Crisis 30 ...Presentation by Andreas Schleicher Tackling the School Absenteeism Crisis 30 ...
Presentation by Andreas Schleicher Tackling the School Absenteeism Crisis 30 ...EduSkills OECD
 
Unit-IV; Professional Sales Representative (PSR).pptx
Unit-IV; Professional Sales Representative (PSR).pptxUnit-IV; Professional Sales Representative (PSR).pptx
Unit-IV; Professional Sales Representative (PSR).pptxVishalSingh1417
 
Introduction to Nonprofit Accounting: The Basics
Introduction to Nonprofit Accounting: The BasicsIntroduction to Nonprofit Accounting: The Basics
Introduction to Nonprofit Accounting: The BasicsTechSoup
 
Holdier Curriculum Vitae (April 2024).pdf
Holdier Curriculum Vitae (April 2024).pdfHoldier Curriculum Vitae (April 2024).pdf
Holdier Curriculum Vitae (April 2024).pdfagholdier
 
Grant Readiness 101 TechSoup and Remy Consulting
Grant Readiness 101 TechSoup and Remy ConsultingGrant Readiness 101 TechSoup and Remy Consulting
Grant Readiness 101 TechSoup and Remy ConsultingTechSoup
 
General Principles of Intellectual Property: Concepts of Intellectual Proper...
General Principles of Intellectual Property: Concepts of Intellectual  Proper...General Principles of Intellectual Property: Concepts of Intellectual  Proper...
General Principles of Intellectual Property: Concepts of Intellectual Proper...Poonam Aher Patil
 
Food Chain and Food Web (Ecosystem) EVS, B. Pharmacy 1st Year, Sem-II
Food Chain and Food Web (Ecosystem) EVS, B. Pharmacy 1st Year, Sem-IIFood Chain and Food Web (Ecosystem) EVS, B. Pharmacy 1st Year, Sem-II
Food Chain and Food Web (Ecosystem) EVS, B. Pharmacy 1st Year, Sem-IIShubhangi Sonawane
 
PROCESS RECORDING FORMAT.docx
PROCESS      RECORDING        FORMAT.docxPROCESS      RECORDING        FORMAT.docx
PROCESS RECORDING FORMAT.docxPoojaSen20
 
How to Give a Domain for a Field in Odoo 17
How to Give a Domain for a Field in Odoo 17How to Give a Domain for a Field in Odoo 17
How to Give a Domain for a Field in Odoo 17Celine George
 
Class 11th Physics NEET formula sheet pdf
Class 11th Physics NEET formula sheet pdfClass 11th Physics NEET formula sheet pdf
Class 11th Physics NEET formula sheet pdfAyushMahapatra5
 

Recently uploaded (20)

Mehran University Newsletter Vol-X, Issue-I, 2024
Mehran University Newsletter Vol-X, Issue-I, 2024Mehran University Newsletter Vol-X, Issue-I, 2024
Mehran University Newsletter Vol-X, Issue-I, 2024
 
Seal of Good Local Governance (SGLG) 2024Final.pptx
Seal of Good Local Governance (SGLG) 2024Final.pptxSeal of Good Local Governance (SGLG) 2024Final.pptx
Seal of Good Local Governance (SGLG) 2024Final.pptx
 
Z Score,T Score, Percential Rank and Box Plot Graph
Z Score,T Score, Percential Rank and Box Plot GraphZ Score,T Score, Percential Rank and Box Plot Graph
Z Score,T Score, Percential Rank and Box Plot Graph
 
On National Teacher Day, meet the 2024-25 Kenan Fellows
On National Teacher Day, meet the 2024-25 Kenan FellowsOn National Teacher Day, meet the 2024-25 Kenan Fellows
On National Teacher Day, meet the 2024-25 Kenan Fellows
 
Role Of Transgenic Animal In Target Validation-1.pptx
Role Of Transgenic Animal In Target Validation-1.pptxRole Of Transgenic Animal In Target Validation-1.pptx
Role Of Transgenic Animal In Target Validation-1.pptx
 
TỔNG ÔN TẬP THI VÀO LỚP 10 MÔN TIẾNG ANH NĂM HỌC 2023 - 2024 CÓ ĐÁP ÁN (NGỮ Â...
TỔNG ÔN TẬP THI VÀO LỚP 10 MÔN TIẾNG ANH NĂM HỌC 2023 - 2024 CÓ ĐÁP ÁN (NGỮ Â...TỔNG ÔN TẬP THI VÀO LỚP 10 MÔN TIẾNG ANH NĂM HỌC 2023 - 2024 CÓ ĐÁP ÁN (NGỮ Â...
TỔNG ÔN TẬP THI VÀO LỚP 10 MÔN TIẾNG ANH NĂM HỌC 2023 - 2024 CÓ ĐÁP ÁN (NGỮ Â...
 
Making and Justifying Mathematical Decisions.pdf
Making and Justifying Mathematical Decisions.pdfMaking and Justifying Mathematical Decisions.pdf
Making and Justifying Mathematical Decisions.pdf
 
Python Notes for mca i year students osmania university.docx
Python Notes for mca i year students osmania university.docxPython Notes for mca i year students osmania university.docx
Python Notes for mca i year students osmania university.docx
 
Application orientated numerical on hev.ppt
Application orientated numerical on hev.pptApplication orientated numerical on hev.ppt
Application orientated numerical on hev.ppt
 
ComPTIA Overview | Comptia Security+ Book SY0-701
ComPTIA Overview | Comptia Security+ Book SY0-701ComPTIA Overview | Comptia Security+ Book SY0-701
ComPTIA Overview | Comptia Security+ Book SY0-701
 
Presentation by Andreas Schleicher Tackling the School Absenteeism Crisis 30 ...
Presentation by Andreas Schleicher Tackling the School Absenteeism Crisis 30 ...Presentation by Andreas Schleicher Tackling the School Absenteeism Crisis 30 ...
Presentation by Andreas Schleicher Tackling the School Absenteeism Crisis 30 ...
 
Unit-IV; Professional Sales Representative (PSR).pptx
Unit-IV; Professional Sales Representative (PSR).pptxUnit-IV; Professional Sales Representative (PSR).pptx
Unit-IV; Professional Sales Representative (PSR).pptx
 
Introduction to Nonprofit Accounting: The Basics
Introduction to Nonprofit Accounting: The BasicsIntroduction to Nonprofit Accounting: The Basics
Introduction to Nonprofit Accounting: The Basics
 
Holdier Curriculum Vitae (April 2024).pdf
Holdier Curriculum Vitae (April 2024).pdfHoldier Curriculum Vitae (April 2024).pdf
Holdier Curriculum Vitae (April 2024).pdf
 
Grant Readiness 101 TechSoup and Remy Consulting
Grant Readiness 101 TechSoup and Remy ConsultingGrant Readiness 101 TechSoup and Remy Consulting
Grant Readiness 101 TechSoup and Remy Consulting
 
General Principles of Intellectual Property: Concepts of Intellectual Proper...
General Principles of Intellectual Property: Concepts of Intellectual  Proper...General Principles of Intellectual Property: Concepts of Intellectual  Proper...
General Principles of Intellectual Property: Concepts of Intellectual Proper...
 
Food Chain and Food Web (Ecosystem) EVS, B. Pharmacy 1st Year, Sem-II
Food Chain and Food Web (Ecosystem) EVS, B. Pharmacy 1st Year, Sem-IIFood Chain and Food Web (Ecosystem) EVS, B. Pharmacy 1st Year, Sem-II
Food Chain and Food Web (Ecosystem) EVS, B. Pharmacy 1st Year, Sem-II
 
PROCESS RECORDING FORMAT.docx
PROCESS      RECORDING        FORMAT.docxPROCESS      RECORDING        FORMAT.docx
PROCESS RECORDING FORMAT.docx
 
How to Give a Domain for a Field in Odoo 17
How to Give a Domain for a Field in Odoo 17How to Give a Domain for a Field in Odoo 17
How to Give a Domain for a Field in Odoo 17
 
Class 11th Physics NEET formula sheet pdf
Class 11th Physics NEET formula sheet pdfClass 11th Physics NEET formula sheet pdf
Class 11th Physics NEET formula sheet pdf
 

Financial Reporting Problem Apple Inc.CT7.1 The financial statem

  • 1. Financial Reporting Problem: Apple Inc.CT7.1 The financial statements of Apple Inc. are presented in Appendix A. The complete annual report, including the notes to its financial statements, is available at the company’s website. Instructions Using the financial statements and reports, answer these questions about Apple’s internal controls and cash. a. What comments, if any, are made about cash in the “Report of Independent Registered Public Accounting Firm”? b. What data about cash and cash equivalents are shown in the consolidated balance sheet (statement of financial position)? c. What activities are identified in the consolidated statement of cash flows as being responsible for the changes in cash during 2017? d. How are cash equivalents defined in the Notes to Consolidated Financial Statements? e. Read the section of the report titled “Management’s Report on Internal Control Over Financial Reporting.” Summarize the statements made in that section of the report. Journal of Vocational Rehabilitation 46 (2017) 149–158 DOI:10.3233/JVR-160851 IOS Press 149 Impairment, demographics and competitive employment in vocational rehabilitation John O’Neilla,∗ , Walter Kaczetowb, Joseph Pfallerc and Jay Verkuilenb a Kessler Foundation, East Hanover, NJ, USA
  • 2. bProgram in Educational Psychology, City University of New York Graduate Center, New York, NY, USA cProgram in Rehabilitation Psychology, University of Wisconsin-Madison, Madison, WI, USA Revised/Accepted August 2016 Abstract. BACKGROUND: There is a persistent gap in the employment rate of working-age people with disabilities and those without disabilities, with outcomes differing across impairment groups and by demographics. OBJECTIVE: Our goal is to identify differences in competitive employment outcomes across 17 impairment groups included in the RSA-911, including interaction effects with other individual characteristics, among them age, gender, race/ethnicity, and educational attainment. METHODS: We used logistic regression to examine differences in competitive versus other employment closures among vocational rehabilitation customers who were employed at closure. The relationship between demographic variables and type of employment was allowed to vary by impairment. RESULTS: Contrary to research that does not differentiate type of employment, we find the odds of competitive employment are lowest for VR clients who are blind or visually impaired. They are also lower for those with mobility, orthopedic, or mental impairments; women; older clients; and those with lower levels of educational attainment. Interaction effects revealed that the differences across demographic groups vary by type of impairment. CONCLUSION: Researchers and counselors should consider type of employment at closure, and differences by impairment and among demographic groups should be taken into consideration when designing employment service programs.
  • 3. Keywords: Vocational rehabilitation (VR), demographics, RSA- 911, competitive employment 1. Introduction The benefits of employment for physical and psy- chological health is well-documented for people with and without disabilities (Bishop, Chapin, & Miller, 2008; Dutta, Gervey, Chan, Chou, & Ditchman, 2008). Individuals with disabilities who are employed have lower rates of alcohol use, depression, and anxi- ety and are found to have higher levels of self-esteem ∗ Address for correspondence: John O’Neill, Ph.D. Director, Employment and Disability Research, Kessler Foundation, 120 Eagle Rock Ave., East Hanover, NJ 07936-3147, USA. Tel.: +1 973 324 8387; Fax: +1 973 324 8373; E-mail: [email protected] and quality of life (Dutta et al., 2008). However, individuals with disabilities have significantly lower rates of employment compared to the general popu- lation, with an estimated 32 percent of working-age adults with disabilities employed compared to 73 percent of people without disabilities from 2010 to 2012 (U.S. Department of Labor, 2013). Recognizing the importance of employment to the individual, the state-federal vocational rehabilitation (VR) program plays a critical role in reducing vocational disparities, but only 60 percent of VR consumers success- fully obtain employment. Despite poor employment outcomes for people with disabilities overall, evi- dence suggests that subgroups—defined by type of 1052-2263/17/$35.00 © 2017 – IOS Press and the authors. All rights reserved
  • 4. mailto:[email protected] 150 J. O’Neill et al. / Impairment, demographics and employment in VR impairment, educational attainment, or demographic characteristics—have more robust employment outcomes (Chan et al., 2016). Furthermore, evidence suggests that competitive employment provides the greatest benefit on a broad range of rehabilitation outcomes for people with dis- abilities. As a result, we undertook the current study to utilize competitive employment as the outcome measure since it represents the ideal VR case clo- sure. Findings can then be more directly applied to the state-federal VR programs in enacting the mission of integrated employment outlined by the Workforce Innovation and Opportunity Act (WIOA) of 2014 and Rehabilitation Services Administration (RSA). In this study we specifically examine differ- ences in type of employment defined as competitive versus not. While most studies of VR compare closures with or without employment, recent pol- icy changes have emphasized the importance of employment in integrated settings. First, in 2001 RSA updated the definition of employment out- come for the state-federal VR program to mean work in an integrated setting (Rehabilitation Services Administration, 2001). More recently, in 2014 WIOA amended Title IV of the Rehabilitation Act of 1973 to emphasize competitive integrated employment at competitive wages as a major initiative (U.S. Depart-
  • 5. ment of Education, 2014). The purpose of this study is to examine employ- ment outcomes for 17 impairment types included in the RSA-911. We hypothesize that differences evident among types of impairment will vary across personal and demographic characteristics including age, gender, educational attainment, and race/ethnicity. A better understanding of how impair- ment type interacts with personal and demographic factors can enable a greater understanding of facilita- tors and barriers to vocational success. Moreover, this improved understanding can be used to help direct state-federal VR policy and intervention strategies to improve vocational outcomes. We find significant differences between type of employment and impairment type, gender, age, and education. In contrast to existing research examining employment alone, we find competitive employment is lowest among those who are blind or visually impaired. Competitive employment is also lower for those with mobility, orthopedic, or mental impair- ments; women; older clients; and those with lower levels of educational attainment. Notably, interaction effects revealed that the differences across demo- graphic groups vary by type of impairment. 2. Literature review 2.1. Impairment type Impairment type has been found to be an important predictor of employment outcomes in the state- federal VR program. While the RSA-911 contains 19 impairments, research on employment outcomes
  • 6. often categorize disability type into three broad cat- egories including: (1) sensory or communicative disabilities (e.g., visual or hearing impairments); (2) mental impairments (e.g., serious mental ill- ness); and (3) physical disabilities (e.g., spinal cord injury). These studies have found that individuals with sensory or communicative disabilities typi- cally have better employment outcomes, followed by individuals with physical disabilities, and then by individuals with mental impairments (Rosenthal, Chan, Wong, Kundu, & Dutta, 2006). Other studies have focused exclusively on a specific impairment population, leaving little research examining differ- ences across the many specific impairments within the RSA-911. Our intention with the current study is to systematically study employment outcomes across 17 impairments included in the RSA-911. We are not able to include two of the 19 impairments due to limited sample size. 2.2. Gender The role of gender in employment outcomes of those with disabilities is mixed in the literature and not fully understood. It is clear that women are typically employed at a lower rate when com- pared to men. However, many studies have failed to demonstrate a difference in successful case clo- sure in the state-federal VR program by gender. While other studies have found that despite having no impact on the rate of employment, men have sig- nificantly higher earnings than women (Ireys, Gimm, & Liu, 2009). Among people with disabilities, one recent study found, while men with disabilities are employed
  • 7. at higher rates than women, the employment gap between individuals with disabilities and those with- out disabilities is smaller for women (35 percentage points) than for men (37 percentage points) (Sevak, Houtenville, Brucker, & O’Neill, 2015). Those authors suggest that while there is no theoreti- cal explanation for this difference, it is possible that men with disabilities face greater obstacles to employment. Further research is needed to under- J. O’Neill et al. / Impairment, demographics and employment in VR 151 stand the interaction of gender, disability type, and other personal and demographic factors. 2.3. Race/ethnicity The rehabilitation literature has found considerable differences between blacks and whites in VR eligi- bility, service provision, and employment outcomes. However, interpretation of these finding is complex, as the relationship between race and employment out- comes varies. In a seminal analysis examining race and VR outcomes, researchers found African Ameri- cans had lower rates of receipt of VR services, training, job placement, and wages (Atkins et al., 1980). Con- temporary analyses continue to find evidence of such disparities, showing that whites are more likely to be deemed eligible for VR services (Wilson, 2002; Wilson, Alston, Harley, & Mitchell, 2002), that African Americans receive less vocational training or college and university training (Boutin & Wilson, 2012), and that African Americans are less likely to
  • 8. be placed in competitive employment (Capella, 2002; Feist-Price, 1995; Rosenthal et al., 2006; Rosenthal, Ferrin, & Wilson, 2005; Wilson, 1999). Despite being the fastest growing segment of the U.S. population, Latinos have not been the focus of many studies of VR. One study found that Hispanic clients were deemed eligible to receive services at a higher rate than non-Hispanics (including whites, African Americans, Asians, and Native Americans) (Wilson & Senices, 2005). Capella (2002) reported that Hispanics were 1.77 times more likely to be closed with competitive employment compared to whites. One recent study found that Latinos had a smaller disability employment gap than non-Latinos (Sevak et al., 2015). That study also identified a smaller gap among Asians. Some studies have also noted racial differences by specific health conditions. In an analysis of RSA-911 data, African Americans with a sensory or commu- nicative disability were 20 percent less likely to obtain employment through VR, while Native Americans with a physical or mental impairment were 51 per- cent and 50 percent less likely, respectively (Dutta et al., 2008). 2.4. Education While individuals with disabilities have lower rates of educational attainment compared to the general population (Gilmore & Bose, 2005), employment out- comes are better among people with disabilities who have higher levels of education than among those with less education, and the employment gap progressively
  • 9. declines with higher levels of educational attainment (Sevak et al., 2015). One study found that individu- als with disabilities in their twenties and thirties had a 23 percent greater chance of obtaining employment if they completed high school (Loprest & Maag, 2007), while another estimated that people with disabilities have a 50 percent greater chance of employment when completing college (Gilmore & Bose, 2005). Higher educational attainment is also associated with higher earnings for people with disabilities (Beveridge & Fabian, 2007). Evidence also suggests that the support from VR program for higher education can improve employment outcomes and job quality and is one of the strongest predictors of earnings (Boutin & Wilson, 2009; Manyibe, 2008; Migliore, Timmons, Butter- worth, & Lugas, 2012). The positive benefit of college and university training has been demonstrated across a variety of disability populations, including individu- als with psychiatric disabilities (Boutin & Accordino, 2011) and those with chronic arthritis (Mamboleo et al., 2015). These findings suggest that the deployment of education and training through VR might well work as an intervention to improve employment outcomes for people with disabilities. 2.5. Age An aging population, combined with extensions in the retirement age for receipt of full Social Security benefits, will likely increase the need for VR services for older adults. However, the relationship of age and VR employment outcomes is unclear. Several studies have found that, among individ- uals with chronic health conditions, older age was associated with lower employment ratings (Ipsen,
  • 10. 2006). One recent study found that the disability employment gap was the largest during middle age (Sevak et al., 2015), typically the highest earning years in an individual’s career. Authors also noted that decline for the workforce started at age 30 for people with disabilities, compared to age 50 for the general population (Sevak et al., 2015). In contrast, one study focused on VR clients with a sensory or communicative disability found that those over the age of 65 were three times more likely to successfully obtain competitive employment com- pared to individuals between 16 and 34. However, the older VR clients were also more likely to be employed at application to VR and were seeking services to maintain employment (Dutta et al., 2008). 152 J. O’Neill et al. / Impairment, demographics and employment in VR An important caveat is that many in the general population are exiting the workforce at this age, and that the employment gap gets smaller as a result. 3. Methods 3.1. Data We used case service data from the Rehabilita- tion Services Administration Case Service Report (RSA-911) from 2010 to 2013 for the analysis. The RSA-911 details all cases closed by the state- federal VR system in a fiscal year. The dataset includes information about each case, including demographic information, primary and secondary
  • 11. disability, employment outcomes, and VR service utilization. The RSA-911 provides an opportunity to assess the efficacy of employment services provided by the state-federal VR program and the context from which each individual utilizes VR services, facili- tating a greater understanding of factors that might enhance successful employment outcomes. Within states, vocational rehabilitation (VR) agen- cies are administratively organized in two ways: one general agency serving all individuals with disabili - ties or two separate agencies, one for the blind and one for everyone else. For this analysis, we used data from all three kinds of agencies but nested individual observations by state and impairment. In addition to the data provided in the RSA-911, we included a variety of state-level variables that could be related to employment outcomes. These include the yearly state unemployment rate (from the Bureau of Labor Statistics); whether the agency was in order of selection, which means some individuals were placed on a wait list (from RSA-113 reports); and the amount of federal funds allocated to the states for VR per person with disability. The funds provided per capita variable was calculated by dividing federal funds provided by RSA (from RSA-113 reports) to each state by the number of people with disabilities in the state (from the American Community Survey). We used single regression imputation (McKnight, 2007) to impute values when federal funds data were incomplete. 3.2. Sample Because our study is focused on the qual-
  • 12. ity of employment outcomes, defined as having competitive employment or not, the sample was limited to individuals who were employed at closure. The sample was further limited to individuals who lived in the United States, were between the ages of 18 to 65, were not employed at application, had no previous closures, and had complete data on all of the variables used in the models. Due to small within group sample sizes, the 266 individuals who were deaf and blind and the 1,018 individuals who had other hearing impairments were dropped from the study. The final sample size was 354,414. The sample (see Table 1 Descriptive Statistics) was 63 percent white, 24 percent African American, and 10 percent Hispanic (any race). Only 1 percent of the sample was Asian, and 2 percent of the sam- ple was of other races or multiracial. The scarcity of individuals in those two smaller race/ethnicity groups made it very difficult to obtain good infer- ences about them in the statistical model used later Table 1 Descriptive statistics N 354,414 Mean Age 35.04 Gender Percent Male 58.87 Female 41.13 Impairment
  • 13. Blindness 2.53 Other visual 2.33 Deafness visual 1.47 Deafness auditory 0.49 Hearing loss visual 0.49 Hearing loss auditory 2.28 Communicative 0.83 Mobility orthopedic 4.79 Manipulation 2.01 Mobility manipulation 2.82 Other orthopedic 3.99 Respiratory 0.69 General physical 3.39 Other physical 6.56 Cognitive 28.6 Psychosocial 27.53 Other mental 9.2 Education Less than high school 31.9 High school graduate 37.37 Some college 23.4 College graduate 7.33 Race White 62.89 Black 23.64 Hispanic 9.75 Asian 1.27 Other 2.46 Employment Competitively employed 95.97 Not competitively employed 4.03 Source: RSA-911 case service data from 2010 to 2013.
  • 14. J. O’Neill et al. / Impairment, demographics and employment in VR 153 in this paper. The average age of the clients was 35 years old. The most frequently observed edu- cational outcome was a high school diploma (37 percent) followed closely by not finishing high school (32 percent). Only 7 percent of the sample fin- ished college. The remaining 23% had some college or post high school educational experience. The most frequent impairment category was cognitive (29 percent). 3.3. Models We estimated a sequence of five nested logistic regression models using STATA v 14 (StataCorp, 2014). In these models the outcome variable was lack of competitive employment. Since 96 percent of the people in the study obtained competitive employ- ment, only 4 percent of the sample did not. In order to have a baseline for the subsequent models, the null model, which only includes the inter- cept, was fit. The first nontrivial model only fit the state variable as a predictor. The second model added yearly state characteristics such as unemployment rate, order of selection, and the federal funding per capita. The third model added the primary impair- ment variable. The fourth model added educational and demographic variables. The fifth model added interactions between an individual’s primary impair- ment and his or her educational and demographic
  • 15. characteristics. Based on fit statistics, the fifth model was chosen to be included in this article. While our study focuses on differences by indi- vidual characteristics and we were not primarily interested in state variables, we did control for the state variables described above (the unemployment rate, the mean order of selection from 2010 to 2013, and the federal grant per person with disability) to isolate differences by impairment and demographics. We also controlled for individual receipt of bene- fits from Social Security disability benefit programs (SSDI, SSI) because it has been shown to be closely related to VR employment outcomes (Nord & Nye- Lengerman, 2015; Schaller, Yang, Ji, & Zuna, 2013). Due to space constraints, we do not present estimates for the state variables. 4. Results The final model contained 81 variables and 158 interacted variables. Given the large sample of 354,414, the traditional p-value of 0.05 could lead to many false positives. In order to mitigate the poten- tial for type 1 error, a p-value of 0.01 was used as a threshold to determine statistical significance. The large number of variables prohibits the reporting of each estimate, so we largely limit our presentation of results to those that are statistically significant. While we discuss the main effects of variables in the text, we note that their interpretation is limited and do not dis- play them in tables. We do display tables and figures of the estimated interaction effects between impair- ment, educational attainment, and race/ethnicity.
  • 16. We discuss the estimates as relative risks for ease of interpretation. In models where one of the two out- comes is very small, the odds ratios can be interpreted, approximately, as the relative risk of lack of competi- tive employment of the group relative to the reference group (Agresti, 2013). The reference group used for the analysis was white men from Alabama who had hearing loss and communicated with speech and did not graduate from high school. 4.1. Main effects Because the model contains a series of interactions, it is difficult to interpret the coefficients on the indi - vidual variables, which are often called main effects. They represent the level difference between the refer- ence category and a group, whereas the coefficients on the interacted variables represent the additional differences between the reference category and a group. To estimate the full difference in risk between groups requires multiplying the odds ratios for each group and its related interactions. We do this and discuss those estimates in the next section. Based on a comparison of the noninteracted vari- ables for type of impairment, we find that blindness is associated with the highest relative risk for lack of competitive employment (θ = 7.73, p < 0.001), rel- ative to the reference impairment group. Visual impairment is associated with the next highest rela- tive risk of lack of competitive employment (θ = 4.61, p < 0.001). Mobility orthopedic impairment is asso- ciated with the third highest relative risk of lack of competitive employment (θ = 2.97, p < 0.001), fol- lowed by other orthopedic impairments (θ = 2.68, p < 0.01). Cognitive impairments and other mental
  • 17. impairments were also at a higher risk for lack of com- petitive employment (θ = 2.45, p < 0.001 and θ = 2.59, p < 0.002). Lastly, other physical impairments and psychosocial impairments were at higher risk for lack of competitive employment (θ = 2.27, p < 0.012; θ = 2.02, p < 0.015). 154 J. O’Neill et al. / Impairment, demographics and employment in VR The odds ratios for noninteracted demographic variables also revealed significant differences. In gen- der, females had a greater risk for lack of competitive employment compared to males (θ = 2.32, p < 0.001). Greater age was also associated with a higher risk of lack of competitive employment (θ = 1.05, p < 0.001). Hispanic ethnicity was associated with half the rela- tive risk (θ = 0.44, p < 0.001) of non-Hispanic, white race/ethnicity. Higher educational achievement was associated with lower relative risk of lack of competitive employment. High school completion was associ- ated with half the relative risk (θ = 0.53, p < 0.001) of competitive employment relative to those who had not completed high school. Having an associate’s degree or some college education is associated with four times the likelihood of competitive employment (θ = 0.27, p < 0.001), and having a college degree is associated with six times the likelihood of competi- tive employment (θ = 0.17, p < 0.001). 4.2. Interaction effects
  • 18. As described above, the model included interac- tions of impairment with gender, age, race/ethnicity, and education. We first describe findings on inter- actions between education level and impairment. In general these interactions revealed that the lower relative risk associated with higher educational attain- ment was not as dramatic for most impairment groups relative to the reference group of hearing loss with auditory communication. For example, we estimate odds ratios greater than one for edu- cational attainment indicators interacted with other visual (θHS = 1.78, p < 0.003; θSC = 2.66, p < 0.001; θC = 2.82, p < 0.001) and mobility and manipula- tion impairments (θHS = 1.99, p < 0.002; θSC = 3.59, p < 0.001; θC = 6.09, p < 0.001). Additionally, hav- ing some postsecondary education but not having completed a bachelor’s degree is associated with increased relative risk of lack of competitive employment for people with the following impair- ments: blindness (θ = 1.78, p < 0.003), deafness with visual communication (θ = 1.980, p < 0.008), mobility and orthopedic (θ = 1.97, p < 0.002), respi - ratory (θ = 3.69, p < 0.003), psychosocial (θ = 2.98, p < 0.001), and other mental problems (θ = 2.69, p < 0.001). Lastly, compared to those with a bache- lor’s degree in the reference group of hearing loss with auditory communication, risks of non-competitive outcomes were higher for those with a bache- lor’s degree deafness with visual communication Table 2 Estimated relative risk of noncompetitive employment outcome, by education and impairment Impairment High School Some College College
  • 19. Blind 0.6943 0.4844∗ 0.2183 Other visual 0.8997∗ 0.7285∗ 0.4645∗ Deafness visual 0.5386 0.5416∗ 0.5137∗ Deafness auditory 0.6151 0.2425 0.0914 Hearing loss visual 0.6641 0.4508 0.6557∗ Communicative 0.9902 0.7735 0.8330∗ Mobility orthopedic 0.8073 0.5400∗ 0.5239∗ Manipulation 0.6126 0.5404 0.3067 Mobility manipulation 1.0527∗ 0.9818∗ 1.0041∗ Other orthopedic 0.6687 0.4379 0.4479∗ Respiratory 1.9580∗ 1.0574∗ 0.6227 General physical 1.2641 0.6694∗ 0.2531∗ Other physical 0.8134 0.5878∗ 0.4754∗ Cognitive 0.7213 0.4438 0.2513 Psychosocial 0.6790 0.5740∗ 0.4171∗ Other mental 0.8316 0.7361∗ 0.5023∗ Source: Authors’ analysis of the RSA-911 case service data from 2010 to 2013. Notes: The relative risk of closure without compet- itive employment by education is calculated by multiplying the odds ratios for education group and for the interactions of impair- ment and education groups. The logistic regression also controlled for age, gender, race/ethnicity, state characteristics by year, and interactions of these variables with impairment type. ∗ Denotes statistically significant differences at the 0.01 level. (θ = 3.11, p < 0.002), hearing loss with visual communication (θ = 3.98, p < 0.01), communica- tive (θ = 5.05, p < 0.006), mobility and orthopedic (θ = 3.18, p < 0.001), other orthopedic (θ = 2.72, p < 0.006), general physical (θ = 2.45, p < 0.011), psy-
  • 20. chosocial (θ = 2.53, p < 0.001), and other mental (θ = 3.05, p < 0.001) impairments. To facilitate interpretation of the differences in rel - ative risk by impairment and educational attainment, in Table 2 we combine the relative risk estimated on the noninteracted education variables and the educa- tion variables. These risks can be interpreted relative to the risk for the reference group hearing loss with auditory communication with educational attainment less than high school completion. The difference in relative risk from one column to the next can be interpreted as the change in rela- tive risk by educational attainment. For people with other visual impairments, an increase in education from completing high school to having some col- lege reduces the relative risk of lack of competitive employment by 19 percent, and an increase in educa- tion from having some college to completing college reduces the relative risk by 37 percent. People whose primary disability is in the mobility and orthopedic category enjoy a relative risk decrease of 3 per- cent if they graduate from college instead of having J. O’Neill et al. / Impairment, demographics and employment in VR 155 only some postsecondary education. Individuals with mobility and manipulation impairments benefit from a 7 percent relative risk reduction if they possess some postsecondary education but did not earn a bachelor’s degree. Oddly, persons with a bachelor’s degree in this impairment category have a 1.7 percent increase
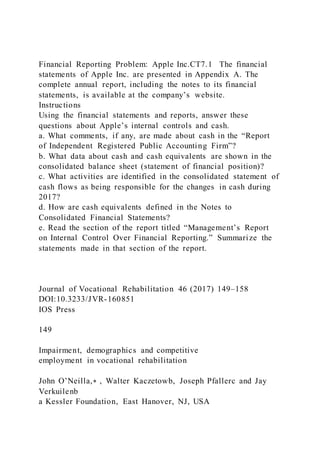
  • 21. in relative risk compared to people who had only some postsecondary education. People with a respi- ratory impairment who possess some postsecondary education less than a bachelor’s degree have 46 per- cent reduction in relative risk compared to people who only graduated high school. Persons with a bachelor’s degree in the impairment categories general physical, psychosocial, and other mental have a 37 percent, 27 percent, or 32 percent reduction in relative risk com- pared to people who had some postsecondary but not a bachelor’s degree. Interactions between age and impairment were sta- tistically significant for the following impairments: deafness with visual communication (θ = 0.97, p < 0.002), communicative (θ = 0.96, p < 0.01), mobility and orthopedic (θ = 0.96, p < 0.001), mobility and manipulation (θ = 0.97, p < 0.001), other orthopedic (θ = 0.96, p < 0.001), general physical (θ = 0.97, p < 0.00), other physical (θ = 0.96, p < 0.001), cognitive (θ = 0.97, p < 0.001), psy- chosocial (θ = 0.956, p < 0.001), and other mental (θ = 0.950, p < 0.001). These estimates indicate that the increase in relative risk of lack of competitive employment with increased age is smaller for these groups. At first glance, the interaction effects may seem trivial since they are all just slightly less than one. In reality they are not at all trivial. Since age is a continuous predictor, the product of its effect interacting with any variable grows exponentially. The cumulative age effects graph (see Fig 1) shows different impairment groups experience different degrees of relative risk of lack of competitive employment as they age. For example, the relative risk of lack of competitive employment hardly changes over time for those with
  • 22. psychosocial and other mental impairments. Those with deafness who communicate visually, however, have almost a fourfold increase in the relative risk of lack of competitive employment as they age. The other five impairment groups fall somewhere in between. While the impairment interactions were most notable by age and education, some additional interactions were notable. Hispanics with cognitive impairments were over three times as likely to not be competitively employed as non-Hispanics if they had Fig. 1. Estimated relative risk of noncompetitive employment out- come, by age and impairment. Source: Authors’ analysis of the RSA-911 case service data from 2010 to 2013. Notes: The rel - ative risk of closure without competitive employment by age is calculated by combining the odds ratios for each age and for the interaction of age with each impairment group. To simplify the graph, similar impairment categories with similar growth rate were averaged. The logistic regression also controlled for age, gen- der, race/ethnicity, state characteristics by year, and interactions of these variables with impairment type. hearing loss with primarily auditory communication (θ = 3.270, p < 0.001). Women had a reduced relative risk of lack of competitive employment compared to men who had a hearing loss whose primary mode of communication was auditory in five impairment categories. These were general physical (θ = 0.66, p < 0.01), other physical (θ = 0.64, p < 0.003), mobil - ity orthopedic (θ = 0.65, p < 0.005), mobility and
  • 23. manipulation (θ = 0.591, p < 0.001), and cognitive (θθ = 0.50, p < 0.001). While the estimated relative risks for any variable or interaction may seem large, the predicted prob- abilities of noncompetitive closure implied by the model, when taking into account all estimates, were quite similar. It is important to note two things about predicted probabilities: (1) small absolute changes in predicted probabilities can be very meaningful if all of the predicted probabilities are small; and (2) they are generated by averaging all the variables in the model. In this sample, the overall probability of lack of competitive employment was 4 percent, so we expect to see the predicted probabilities being close to 4 percent. All of the predicted probabilities by any impairment or demographic were between 2 percent and 6 percent except those for blindness and other visual impairments, which were 22 per- cent and 18 percent respectively (not shown). This is not surprising since the approximate relative risks for those impairments were much higher than for the other impairments. 156 J. O’Neill et al. / Impairment, demographics and employment in VR 5. Summary and discussion We first summarize the results for main effects and interactions and then discuss some of the impli- cations for policy and practice. The relative risk of competitive employment varied across impairment groups. Women were more likely to not be com-
  • 24. petively employed than men, though this relationship was attenuated, but not totally eliminated, for a num- ber of impairment groups. Hispanics were more likely to be competively employed than whites, which is consistent with the literature (Capella, 2002); how - ever, the relationship was opposite for Hispanics with cognitve impairments. Increasing levels of education contributed as much as a sixfold decrease in the risk of not being competivel y employed, which is con- sistent with previous research (Boutin & Accordino, 2011; Loprest & Maag, 2007; Mamboleo et al., 2015; Sevak et al., 2015). However, these positive effects were somewhat attenuated when we looked at edu- cation interacting with the impairments. Consistent with prior research (e.g., Giesen & Cavenaugh, 2013; Ipsen, 2006), we found that increasing age is a signifi - cant predictor of poor employment outcomes, but this effect is substantively smaller for some impairment groups. Of particular interest in the findings by impairment group is that the blind and those with other visual impairments have a greater risk of not being compet- itively employed. This finding shows that not all VR clients with sensory or communicative impairments have similar employment outcomes and suggests that combining these groups for analysis runs the risk of losing important details (Rosenthal et al., 2006). Women being at greater risk of not becoming competitively employed may be a consequence of powerful social role expectations despite changes in favor of more equality in the professional and domes- tic lives of men and women (Kvam, Eide, & Vik, 2013). Vocational rehabilitation professionals as well as family and friends can also have an influence on
  • 25. women with disabilities not becoming employed by focusing on family participation instead of employ- ment (Kvam et al., 2013). Researchers (Doren, Gau, & Lindstrom, 2011) have recommended that school and agency personnel who are providing employment and career services to yong women with disabilities ensure that these services are free of stereotypical per - ceptions of womens’ roles related to work and family. More specifically, they recommend that school and agency staff engage gender-neutral career assess- ments and career-related learning experiences and that young women with disablilties be exposed to female role models with diabilities who are employed in high-skill, high-wage jobs to expand career aspi- rations. We found that higher levels of educational attain- ment were associated with significantly reduced risk of not being competitively employed. This was true for 12 impairment groups, and the risk reduction ranged from 3 percent to 46 percent. The good news is that rates of postsecondary education access are increasing for students with disabilities, though rates of completion remain relatively low when compared to students without disabilities (Madaus, Grigal, & Hughes, 2014). While our evidence is correlational, it is consistent with research that suggests relation- ships between students and academic advisors and social integration in nonacademic activities while in postsecondary educational programs may be instru- mental for students with disabilities persisting to degree completion (Koch, Mamiseishvili, & Higgins, 2014). These findings point to the importance of vocational rehabilitation staff working closely with college disability service staff to focus on more than
  • 26. accommodations. There is also longitudinal research pointing to antecedent secondary educational factors related to completion of postsecondary education; these factors include students with disabilities self- advocating, participating in extracurricular activities, and having opportunities to develop vocational skills through work-study or paid employment (Achola, 2014). Evidence such as this provides direction to state vocational rehabilitation agencies as they take on additional responsibilities under WIOA devoting 15 percent of their budgets to working with special educational students to ensure a meaningful transi- tion from high school to postsecondary education and ultimately competitive employment. We found a more nuanced story for aging than is presented in previous studies (e.g., Giesen & Cave- naugh, 2013; Ipsen, 2006) when we look at the interaction of age with impairment. We saw great variation in the degree to which aging is associated with poorer employment outcomes across impair- ment groups. This finding is consistent with the more general observation that older workers are remain- ing in the labor force for longer. It is estimated that by 2050 22 percent of the U.S. population will be over the age of 60 and this aging population will increase the demand for VR services considering two factors: (1) many older adults are wanting or needing to work well beyond the traditional retirement age; and (2) aging brings with it related chronic illness J. O’Neill et al. / Impairment, demographics and employment in VR 157
  • 27. and disability conditions that can benefit from reha- bilitation services to enhance productive capacity. Moreover, employment for older adults is a protective factor for health and wellness, improves psychosocial well-being, and life satisfaction (Momtaz, Hamid, Haron, & Bagat, 2016; Wahrendorf, 2015). This trend toward older workers staying employed presents opportunities for vocational rehabilitation staff to support older workers as they approach retirement age. For example, among older work- ers who want to stay in their current jobs either full time or part time for psychological or finan- cial reasons, some without disability histories will develop age-related impairments and need services to stay employed. In addition, there are individuals who have had disabilities for some time and who acquire additional age-related impairments and need services to keep their jobs. There may also be older workers with disabilities approaching retirement that want to leave their current employment situation and shift to another field of work and look to vocational rehabilitation practitioners to assist them with career exploration and securing meaningful employment. Regardless of the older consumer’s employment aspi- rations, vocational rehabilitation counselors need to appreciate that movement into retirement is fraught with issues related to identity disruption, decision anxiety, loss of self-assurance, disruption of social supports, and existential anxiety (Osborne, 2012). Hershenson (2014) even recommends that counselors develop an individual retirement plan in addition to an individual plan for employment for older vocational rehabilitation consumers. Acknowledgments
  • 28. This project was funded by the National Institute on Disability, Independent Living, and Rehabilitation Research (U.S. Department of Health and Human Services) Rehabilitation and Research Training Cen- ter on Individual Characteristics, under cooperative agreement 90RT5017-01-01. The findings and con- clusions are those of the authors and do not represent the policy of HHS or NIDILRR. The authors retain sole responsibility for any errors or omissions. Conflict of interest The authors have no conflict of interest to report. References Achola, E. (2013). Completing college: A longitudinal exam- ination of potential antecedents of success in post- secondary education for students with disabilities. Vir- ginia Commonwealth University VCU Scholars Compass. http://scholarscompass.vcu.edu/etd Agresti, A. (2013). Categorical data analysis. Hoboken, NJ: Wiley. Atkins, B. J., Wright, G. N., Humphreys, R. R., Provitt, E., Bolton, B., Cooper, P. G. & Cooper, P. G. (1980). Three views: Voca- tional rehabilitation of blacks. The statement, the response, the comment. Journal of Rehabilitation, 46(2), 40. Beveridge, S., & Fabian, E. (2007). Vocational rehabilita- tion outcomes: Relationship between individualized plan for employment goals and employment outcomes. Rehabilitation Counseling Bulletin, 50(4), 238-246.
  • 29. Bishop, M., Chapin, M. H., & Miller, S. (2008). Quality of life assessment in the measurement of rehabilitation outcome. Journal of Rehabilitation, 74(2), 45-55. Boutin, D. L., & Accordino, M. P. (2011). Importance of col - legiate training for vocational rehabilitation consumers with psychiatric disabilities. American Journal of Psychiatric Reha- bilitation, 14(1), 76-95. Boutin, D. L., & Wilson, K. (2009). An analysis of vocational rehabilitation services for consumers with hearing impairments who received college or university training. Rehabilitation Counseling Bulletin, 52(3), 156-166. Boutin, D. L., & Wilson, K. B. (2012). Who is going to college? Predicting education training from pre-vr consumer character- istics. Rehabilitation Counseling Bulletin, 55(3), 166-175. Capella, M. E. (2002). Inequities in the VR system: Do they still exist? RehabilitationCounseling Bulletin, 45(3), 143-153. Chan, F., Wang, C., Fitzgerald, S., Muller, V., Ditchman, N., & Menz, F. (2016). Personal, environmental, and service-delivery determinants of employment quality for state vocational rehabilitation consumers: A multilevel analysis. Journal of Vocational Rehabilitation, 45(1), 5-18. Doren, B., Gau, J. M., & Lindsrom, L. (2011). The role of gen- der in the long-term employment outcomes of young adults with disabilities. Journal of Vocational Rehabilitation, 34, 35-42 Dutta, A., Gervey, R., Chan, F., Chou, C.-C., & Ditchman, N. (2008). Vocational rehabilitation services and employment out-
  • 30. comes for people with disabilities: A United States study. Journal of Occupational Rehabilitation, 18(4), 326-334. Feist-Price, S. (1995). African Americans with disabilities and equity in vocational rehabilitation services: One state’s review. Rehabilitation Counseling Bulletin, 39(2), 119-129. Giesen, J. M., & Cavenaugh, B. S. (2013). Disability insurance beneficiaries with visual impairments in vocational rehabili- taion: Socio-demographic influences on employment. Journal of Visual Impairment and Blindness, 107(6), 453-467. Gilmore, D. S., & Bose, J. (2005). Trends in postsecondary educa- tion: Participation within the vocational rehabilitation system. Journal of Vocational Rehabilitation, 22(1), 33-40. Hershenson, D. B. (2014). The individual plan for retirement: A missing part of plan development with older consumers. Rehabilitation Counseling Bulletin, 59(1), 9-17. Ipsen, C. (2006). Health, secondary conditions, and employment outcomes for adults with disabilities. Journal of Disability Policy Studies, 17(2), 77-87. http://scholarscompass.vcu.edu/etd 158 J. O’Neill et al. / Impairment, demographics and employment in VR Ireys, H. T., Gimm, G., & Liu, S. (2009). The effects of state policy decisions on the employment and earnings of Medicaid buy- in participants in 2006. Journal of Disability Policy Studies, 20(3), 142-154.
  • 31. Koch, L. C., Mamiseishvili, K., & Higgins, K. (2014). Persistence to degree completion: A profile of students with psychiatric disabilities in higher education. Journal of Vocational Reha- bilitation, 40, 73-82. Kvam, L., Eide. A. H., & Vik, K. (2013). Understanding expe- riences of participation among men and women with chronic musculoskeletal pain in vocational rehabilitation. Work, 45, 161-174. Loprest, P., & Maag, E. (2007). The relationship between early disability onset and education and employment. Journal of Vocational Rehabilitation, 26(1), 49-62. Madaus, J. W., Grigal, M., & Hughes, C. (2014). Promoting access to postsecondary education for low-income students with dis- abilities. Career Development and Transition for Exceptional Individuals, 37(1), 50-59. Mamboleo, G., Kaya, C., Meyer, L., Kamnetz, B., Bezyak, J., & Chan, F. (2015). Vocational rehabilitation services and outcomes for individuals with arthritis in the United States. Journal of Vocational Rehabilitation, 42(2), 131-139. Manyibe, E. O. (2008). Outcomes of individuals with spinal cord injury served by state vocational rehabilitation services. Unpublished doctoral dissertation, University of Arizona. McKnight, P. E. (2007). Missing data: A gentle introduction. New York: Guilford Press. Migliore, A., Timmons, J., Butterworth, J., & Lugas, J. (2012). Predictors of employment and postsecondary education of
  • 32. youth with autism. Rehabilitation Counseling Bulletin, 55(3), 176-184. Momtaz, Y. A., Hamid, T. A., Haron, S. A., & Bagat, M. F. (2016). Flourishing in later life. Archives of Gerontology and Geri- atrics, 63, 85-91. Nord, D., & Ney-Lengerman, K. (2015). The negative effects of public benefits on individual employment: A multilevel analy- sis of work hours. Intellectual and Developmental Disabilities, 53, 308-318. Osborne, J. W. (2012). Psychological effects of the transition to retirement. Canadian Journal of Counseling and Psychother- apy, 46(1), 45-58. Rehabilitation Services Administration (RSA). (2005). Fac- tors state vocational rehabilitation agencies should consider when determining whether a job position within a com- munity rehabilitation program is deemed to be in an “integrated setting” for purposes of the vocational reha- bilitation program. Washington, D.C.: Retrieved from https://www2.ed.gov/policy/speced/guid/rsa/tac-06-01.pdf Rosenthal, D., Chan, F., Wong, D., Kundu, M., & Dutta, A. (2006). Predicting employment outcomes based on race, gen- der, disability, work disincentives, and vocational rehabilitation service patterns. Journal of Rehabilitation Administration, 29, 229-244. Rosenthal, D. A., Ferrin, J. M., & Wilson, K. (2005). Accep- tance rates of African American versus white consumers of vocational rehabilitation services: A meta-analysis. Journal of Rehabilitation, 71(3), 36-44.
  • 33. Schaller, J. L., Yang, N. K., Ji, E. & Zina, N. (2013). Predicting employment outcomes with depressive/mood disorder from the RSA data file. Journal of Applied Rehabilitation Counseling, 44, 18-28. Sevak, P., Houtenville, A. J., Brucker, D. L., & O’Neill, J. (2015). Individual characteristics and the disability employ- ment gap. Journal of Disability Policy Studies, 26(2),1-9. doi:10.1177/1044207315585823 StataCorp. 2014. Stata Statistical Software: Release 14. College Station, TX: StataCorp LP. U. S. Department of Education. (2014). The Workforce Innovation and Opportunity Act overview of Title IV: Amendments to the Rehabilitation Act of 1973. Retrieved from https://www2.ed. gov/about/offices/list/osers/rsa/publications/wioa-changes-to- rehab-act.pdf/ U.S. Department of Labor (2013). Office of Disability Employment Policy—Current disability employment statis- tics. Retrieved from http://www.dol.gov/odep Wahrendorf, M. (2015). Previous employment histories and quality of life in older ages: Sequence analyses using SHARELIFE. Ageing and Society, 35, 1928-1959. doi:10.1017/S0144686X14000713 Wilson, K. B. (1999). Vocational rehabilitation acceptance: A tale of two races in a large midwestern state. Journal of Applied Rehabilitation Counseling, 30(2), 25-31. Wilson, K. B. (2002). Exploration of VR acceptance and ethnicity:
  • 34. A national investigation. Rehabilitation Counseling Bulletin, 45(3), 168-176. Wilson, K. B., Alston, R. J., Harley, D. A., & Mitchell, N. A. (2002). Predicting VR acceptance based on race, gen- der, education, work status at application, and primary source of support at application. Rehabilitation Counseling Bulletin, 45(3), 132-142. Wilson, K. B., & Senices, J. (2005). Exploring the vocational reha- bilitation acceptance rates for Hispanics versus non-Hispanics in the United States. Journal of Counseling and Development, 83(1), 86-96. https://www2.ed.gov/policy/speced/guid/rsa/tac-06-01.pdf https://www2.ed.gov/about/offices/list/osers/rsa/publications/wi oa-changes-to-rehab-act.pdf/ https://www2.ed.gov/about/offices/list/osers/rsa/publications/wi oa-changes-to-rehab-act.pdf/ http://www.dol.gov/odep Copyright of Journal of Vocational Rehabilitation is the property of IOS Press and its content may not be copied or emailed to multiple sites or posted to a listserv without the copyright holder's express written permission. However, users may print, download, or email articles for individual use. Annual Report on Disability Statistics
  • 35. 1 State Level Statistics Lewis Kraus Center on Disability at the Public Health Institute 1 I am Lewis Kraus from the Center on Disability at the Public Health Institute and the lead author of the Disability Statistics Annual Report. I wanted to review the state level data from the Annual Report with you today. As some of you are familiar with the Annual Report, you know that the graphical display of data by state lends itself to a more nuanced understanding of the data. People with Disabilities Living in the Community as a Percentage of the US Population, by State, 2016 Kraus, L., Lauer, E., Coleman, R., and Houtenville, A. (2018). 2017 Disability Statistics Annual Report. Durham, NH: University of New Hampshire. http://disabilitycompendium.org/sites/default/files/user - uploads/2017AnnualReportSlideDeck Data Source: 2016 American Community Survey, American FactFinder, Table B1810
  • 36. 2 First, the percentage of people with disabilities. In 2016, the state with the lowest percentage of its population having disabilities was Utah (9.9%). The state with the highest percentage of people with disabilities, West Virginia, was more than twice as high with a percentage of 20.1%. For the most part, higher percentages of people with disabilities were clustered in the southern US, around the lower Mississippi river region, with concentrations also high in the states of Maine, New Mexico, Oklahoma, and Oregon. 2 People with Disabilities Ages Under 5 Years Living in the Community, by State, 2016 Kraus, L., Lauer, E., Coleman, R., and Houtenville, A. (2018). 2017 Disability Statistics Annual Report. Durham, NH: University of New Hampshire. http://disabilitycompendium.org/sites/default/files/user - uploads/2017AnnualReportSlideDeck Data Source: 2016 American Community Survey, FactFinder Table B1810 3
  • 37. Looking at the percentage of people with disabilities by age group, we can see that among children under 5 years old, the percentage of those with disabilities was very low, about 0.7% nationally, and 2.8% or less in every state. The states with the highest percentages were Nevada and Rhode Island. Forty states had percentages equal to or less than 1.0%. 3 People with Disabilities Ages 5-17 Years Living in the Community, by State, 2016 Kraus, L., Lauer, E., Coleman, R., and Houtenville, A. (2018). 2017 Disability Statistics Annual Report. Durham, NH: University of New Hampshire. http://disabilitycompendium.org/sites/default/files/user - uploads/2017AnnualReportSlideDeck Data Source: 2016 American Community Survey, FactFinder Table B1810 4 For children ages 5-17, the percentages of those with disabilities ranged from 3.6% in Hawaii to more than twice that percentage in Maine at 8.3%. In general, percentages for this age group were lower in the states around the Rockies, the upper Great Plains, the Pacific Coast and Hawaii, and more concentrated in the eastern and southern US. 4 People with Disabilities Ages 18-64 Years Living in the
  • 38. Community, by State, 2016 Kraus, L., Lauer, E., Coleman, R., and Houtenville, A. (2018). 2017 Disability Statistics Annual Report. Durham, NH: University of New Hampshire. http://disabilitycompendium.org/sites/default/files/user - uploads/2017AnnualReportSlideDeck Data Source: 2016 American Community Survey, FactFinder Table B1810 5 For adults ages 18-64, the highest percentages of people with disabilities were in states in the southern US from Oklahoma to West Virginia, and also Maine and Vermont. The percentage was lowest in New Jersey and Hawaii (7.9%) and more than twice as high in West Virginia (17.8%). 5 People with Disabilities Ages 65 and Over Living in the Community, by State, 2016 Kraus, L., Lauer, E., Coleman, R., and Houtenville, A. (2018). 2017 Disability Statistics Annual Report. Durham, NH: University of New Hampshire. http://disabilitycompendium.org/sites/default/files/user - uploads/2017AnnualReportSlideDeck Data Source: 2016 American Community Survey, FactFinder Table B1810
  • 39. 6 As I am sure you are aware, the highest percentages of people with disabilities were in the US population ages 65 and over; more than one third of the civilian population for this age group (35.2%) had disabilities. In nine states, primarily in the South, the percentage of people ages 65 and over with disabilities was 40% or over, or more than two in every five elderly people: West Virginia, Kentucky, Oklahoma, Mississippi, Alabama, Arkansas, New Mexico, Alaska, and Louisiana. The percentages of people with disabilities were generally lowest in the Northeast, the central Atlantic states, and some upper Midwest states; fourteen states had disability percentages of less than one third (33.3%) of elderly: New Hampshire, Delaware, Vermont, Maryland, Colorado, Minnesota, Rhode Island, Connecticut, Wisconsin, Iowa, Massachusetts, New Jersey, Virginia, and New York. 6 People with Disabilities Living in the Community, by Age Group and State, 2016 7 Under 5
  • 40. 5-17 18-64 65 and over Kraus, L., Lauer, E., Coleman, R., and Houtenville, A. (2018).2017 Disability Statistics Annual Report. Durham, NH: University of New Hampshire. http://disabilitycompendium.org/sites/default/files/user- uploads/2017AnnualReportSlideDeck Data Source: 2016 American Community Survey, FactFinder Table B1810 Now if we look at them all together, you can see a pattern emerging. As the population ages it moves from a disparate, almost random smattering of high and low disability states for those under 5 in the upper left map to a slow, but steady move to the Southern states and Maine and Vermont in the working ages, ending with a solid block of high disability percentage states in the central southern US, along with Wyoming and Alaska for those age 65 and over. 7 Percent Employed Among People with Disabilities, by State, 2016 Kraus, L., Lauer, E., Coleman, R., and Houtenville, A. (2018).2017 Disability Statistics Annual Report. Durham, NH: University of New Hampshire. http://disabilitycompendium.org/sites/default/files/user - uploads/2017AnnualReportSlideDeck Data Source: 2016 American Community Survey, American FactFinder, Table B18120
  • 41. 8 Now let’s turn to a familiar topic – employment. This slide depicts how rates of employment varied by state. For people with disabilities, employment rates ranged from a high of 54.0% (North Dakota) to a low of 27.4% (West Virginia). But you can see a solid block of high disability employment states in the upper Midwest and a generally low disability employment segment in the southeast. 8 Percent Employed Among People without Disabilities, by State, 2016 Kraus, L., Lauer, E., Coleman, R., and Houtenville, A. (2018).2017 Disability Statistics Annual Report. Durham, NH: University of New Hampshire. http://disabilitycompendium.org/sites/default/files/user - uploads/2017AnnualReportSlideDeck Data Source: 2016 American Community Survey, American FactFinder, Table B18120 9 This slide shows that for those without disabilities, the employment ranged from 70.8% (West Virginia) to 84.2% (North Dakota).
  • 42. 9 Kraus, L., Lauer, E., Coleman, R., and Houtenville, A. (2018).2017 Disability Statistics Annual Report. Durham, NH: University of New Hampshire. http://disabilitycompendium.org/sites/default/files/user - uploads/2017AnnualReportSlideDeck Data Source: 2016 American Community Survey, American FactFinder, Table B18120 10 Percent of Persons With and Without Disabilities Employed, by State, 2016 10 With Disabilities Without Disabilities If you now look at them side by side, you can see that the general rates of employment follow similar patterns for those with and without disabilities for the upper Midwest where we see high rates of employment and the Southeast where we see low rates of employment. So we chose to present this as a gap to show where there may be something particular happening for people with disabilities…[next slide] 10 Gap of Percent Employed Among People with and without Disabilities, by State, 2016
  • 43. Data Source: 2016 American Community Survey, American FactFinder, Table B18120 11 Kraus, L., Lauer, E., Coleman, R., and Houtenville, A. (2018).2017 Disability Statistics Annual Report. Durham, NH: University of New Hampshire. http://disabilitycompendium.org/sites/default/files/user - uploads/2017AnnualReportSlideDeck This slide shows the gap in percent employment between those with and without disabilities by state in 2016. Now those upper Midwest states’ high employment rates for both people with and without disabilities change the map. What we are left with is that states with the largest gap were concentrated generally from Missouri eastward and California. While the states’ employment gaps narrowed from the previous year, in thirty four (34) states, the employment percentage gap was 30 percentage points or greater. The highest gaps were in Rhode Island (39.5 points), Maine (36.4 points), District of Columbia (35.7 points), New York (35.6 points), Illinois (35.3 points) and Florida (35.1 points). In only three states was the gap less than 23 percentage points - Alaska (19.8 points), and North and South Dakota (22.4 points). 11 State Median Earnings, Past 12 Months, Ages 16 and Over with Disability, 2016
  • 44. Data Source: 2016 American Community Survey, American FactFinder, Table B18140 12 Kraus, L., Lauer, E., Coleman, R., and Houtenville, A. (2018).2017 Disability Statistics Annual Report. Durham, NH: University of New Hampshire. http://disabilitycompendium.org/si tes/default/files/user- uploads/2017AnnualReportSlideDeck Looking now at median earnings by state, this slide shows the range of median earnings in states for people with disabilities in 2016 was $17,480 in West Virginia to $30,559 in Alaska. In eleven states (Alaska, Maryland, District of Columbia, New Jersey, Hawaii, Nevada, Virginia, Delaware, Connecticut, North Dakota, and Washington), the median earnings for people with disabilities was over $25,000, while six states had median earnings for people with disabilities lower than $20,000 (Minnesota, Wisconsin, Maine, Michigan, Montana, and West Virginia). 12 State Median Earnings, Past 12 Months, Ages 16 and Over without Disability, 2016 Data Source: 2016 American Community Survey, American FactFinder, Table B18140
  • 45. 13 Kraus, L., Lauer, E., Coleman, R., and Houtenville, A. (2018).2017 Disability Statistics Annual Report. Durham, NH: University of New Hampshire. http://disabilitycompendium.org/sites/default/files/user - uploads/2017AnnualReportSlideDec k In comparison to the last slide, the median earnings for people without disabilities ages 16 and over ranged from $27,431 in Idaho to $51,302 in the District of Columbia in 2016. 13 Median Earnings Gap of People 16 Years and Over in the Past 12 Months, by State, 2016 Data Source: 2016 American Community Survey, American FactFinder, Table B18140 14 Kraus, L., Lauer, E., Coleman, R., and Houtenville, A. (2018).2017 Disability Statistics Annual Report. Durham, NH: University of New Hampshire. http://disabilitycompendium.org/sites/default/files/user - uploads/2017AnnualReportSlideDeck Now, using the gap map again, we can see that while states varied widely in earnings gap – from a low of $5,242 in Idaho
  • 46. to a high of $23,144 in the District of Columbia, generally, states in the northeastern US had a higher earnings gap; states in the southern US had a lower earnings gap 14 Poverty Percentage Gap Among People with and without Disabilities, by State, 2016 Data Source: 2016 American Community Survey, American FactFinder, Table B18130 15 Kraus, L., Lauer, E., Coleman, R., and Houtenville, A. (2018).2017 Disability Statistics Annual Report. Durham, NH: University of New Hampshire. http://disabilitycompendium.org/sites/default/files/user - uploads/2017AnnualReportSlideDeck Moving on to Poverty. Here is the poverty gap between those with and without disabilities by state in 2016. The highest poverty gaps were seen mostly in the Northeast US, states bordering the Great Lakes, Kentucky, Missouri, and South Dakota. Gaps ranged from a high of 14.0 percentage points (District of Columbia) to a low of 1.5 percentage points in New Mexico. 15 Poverty Percentage Gap Among People Ages 5 and Under with and without Disabilities, by State, 2016
  • 47. Data Source: 2016 American Community Survey, American FactFinder, Table B18130 16 Kraus, L., Lauer, E., Coleman, R., and Houtenville, A. (2018).2017 Disability Statistics Annual Report. Durham, NH: University of New Hampshire. http://disabilitycompendium.org/sites/default/files/user- uploads/2017AnnualReportSlideDeck For children under age 5, the poverty gap was highest in New Hampshire (60.3 percentage points), Arkansas (47.2), and Mississippi (42.6). For children ages 5 and under, fifteen states had a negative poverty gap (a higher percentage of those without disabilities were in poverty than those with disabilities). 16 Poverty Percentage Gap Among People Ages 5-17 with and without Disabilities, by State, 2016 Data Source: 2016 American Community Survey, American FactFinder, Table B18130 17 Kraus, L., Lauer, E., Coleman, R., and Houtenville, A.
  • 48. (2018).2017 Disability Statistics Annual Report. Durham, NH: University of New Hampshire. http://disabilitycompendium.org/sites/default/files/user - uploads/2017AnnualReportSlideDeck The poverty gap for those ages 5-17 with and without disabilities ranged from a low of 1.3 percentage points in Hawaii to 19 points in Maine. There are nine states with a gap of at least 15 points and 26 with a gap of at least 10 points, meaning that in those states the poverty rates were 10-15 or more percentage points higher for those with disabilities than for those without disabilities. 17 Poverty Percentage Gap Among People Ages 18-64 with and without Disabilities, by State, 2016 Data Source: 2016 American Community Survey, American FactFinder, Table B18130 18 Kraus, L., Lauer, E., Coleman, R., and Houtenville, A. (2018).2017 Disability Statistics Annual Report. Durham, NH: University of New Hampshire. http://disabilitycompendium.org/sites/default/files/user- uploads/2017AnnualReportSlideDeck
  • 49. For people in the 18-64 year old working- age, the poverty gap between those with and without disabilities ranged from a low of 7.4 percentage points in Delaware to a high of 24.8 poi nts in District of Columbia. Nearly half of the states (24) had gaps of 15 points or more. All but 3 states had gaps over 10 points or more. 18 Poverty Percentage Gap Among People Ages 65 and Over with and without Disabilities, by State, 2016 Data Source: 2016 American Community Survey, American FactFinder, Table B18130 19 Kraus, L., Lauer, E., Coleman, R., and Houtenville, A. (2018).2017 Disability Statistics Annual Report. Durham, NH: University of New Hampshire. http://disabilitycompendium.org/si tes/default/files/user- uploads/2017AnnualReportSlideDeck Poverty gaps for those age 65 and over with and without disabilities had a low of 1.7 percentage points (Nevada) to 8.6 points (South Dakota) in 2016. Three states had gaps below 3 points (Nevada, Vermont, and Delaware). 19 Smoking Percentages Gap Among People with and without Disabilities By State, 2016
  • 50. Data Source: Authors' calculations using data from the 2016 Behavioral Risk Factor Surveillance Survey BRFSS * 20 Kraus, L., Lauer, E., Coleman, R., and Houtenville, A. (2018).2017 Disability Statistics Annual Report. Durham, NH: University of New Hampshire. http://disabilitycompendium.org/sites/default/files/user - uploads/2017AnnualReportSlideDeck Turning now to health, the gap between smokers with and without disabilities by state in 2016 ranged from a low of 5.2 percentage points in South Dakota to a high of 16.6 points in Missouri. Thirty six states had a gap of 10 percentage points or higher; South Dakota was the only state to have a gap of 6 percentage points or lower. *- Note that this data is from the Behavioral Risk Factor Surveillance System (BRFSS), which in 2016 changed the questions used measure disability to match those used in the American Community Survey (ACS). 20 Obesity Percentages Gap Among People with and without Disabilities, by State, 2016 Data Source: Authors' calculations using data from the 2016 Behavioral Risk Factor Surveillance Survey BRFSS
  • 51. 21 Kraus, L., Lauer, E., Coleman, R., and Houtenville, A. (2018).2017 Disability Statistics Annual Report. Durham, NH: University of New Hampshire. http://disabilitycompendium.org/sites/default/files/user - uploads/2017AnnualReportSlideDeck This slide shows that the gap in obesity percentages for states ranged from a high of 16.8% in Rhode Island to a low of 7.3% in Mississippi. Nine states had a gap under 10 percentage points while seven states had a gap of 15 points or more. 21 Binge Drinking Percentage Gap Among People with and without Disabilities, by State, 2016 Data Source: Authors' calculations using data from the 2016 Behavioral Risk Factor Surveillance Survey BRFSS 22 Kraus, L., Lauer, E., Coleman, R., and Houtenville, A. (2018).2017 Disability Statistics Annual Report. Durham, NH: University of New Hampshire. http://disabilitycompendium.org/sites/default/files/user - uploads/2017AnnualReportSlideDeck
  • 52. This slide shows gaps in binge drinking for people with and without disabilities by state in 2016. Gaps in binge drinking for those ages 18 and over ranged from 11.7 points less (thus more people without disabilities binge drinking than those with disabilities) in District of Columbia to 1.6 points less in Utah. Twenty one states had a gap of less than 5 points. 22 For more information Lewis Kraus Center on Disability at the Public Health Institute 510-285-5600 [email protected] 23 23 1187326 - Wiley US © Appendix A Specimen Financial Statements: Apple Inc. Once each year, a corporation communicates to its stockholders
  • 53. and other interested parties by issuing a complete set of audited financial statements. The annual report, as this communication is called, summarizes the financial results of the company's operations for the year and its plans for the future. Many annual reports are attractive, multicolored, glossy public relations pieces, containing pictures of corporate officers and directors as well as photos and descriptions of new products and new buildings. Yet the basic function of every annual report is to report financial information, almost all of which is a product of the corporation's accounting system. The content and organization of corporate annual reports have become fairly standardized. Excluding the public relations part of the report (pictures, products, etc.), the following are the traditional financial portions of the annual report: Financial Highlights Letter to the Stockholders Management's Discussion and Analysis Financial Statements Notes to the Financial Statements Management's Responsibility for Financial Reporting Management's Report on Internal Control over Financial Reporting
  • 54. Report of Independent Registered Public Accounting Firm Selected Financial Data The official SEC filing of the annual report is called a Form 10- K, which often omits the public relations pieces found in most standard annual reports. On the following pages, we present Apple Inc.'s financial statements taken from the company's 2017 Form 10-K. The complete Form 10-K, including notes to the financial statements, is available at the company's website. 1187326 - Wiley US © 1187326 - Wiley US © 1187326 - Wiley US © 1187326 - Wiley US © 1187326 - Wiley US ©