Home Prices Resume Upward Trend - May/June Real Estate Report
Texas Economic Indicators
1. Texas Economic Indicators
The Texas economy continues to expand, with employment growing at a 2.4 percent annual rate in June. Texas
existing-home sales and single-family permits increased in June, while housing starts decreased. Texas exports
edged down in May. Manufacturing activity in July rose at a faster rate than June, according to the Texas Manufacturing Outlook Survey.
Summary
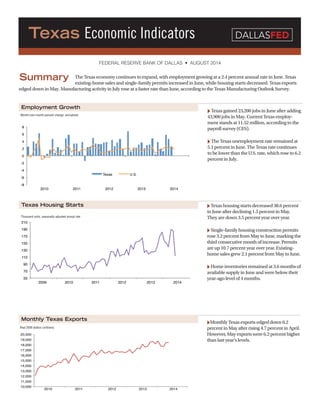
� Texas gained 23,200 jobs in June after adding
43,900 jobs in May. Current Texas employ-
ment stands at 11.52 million, according to the
payroll survey (CES).
� The Texas unemployment rate remained at
5.1 percent in June. The Texas rate continues
to be lower than the U.S. rate, which rose to 6.2
percent in July.
� Texas housing starts decreased 38.6 percent
in June after declining 1.5 percent in May.
They are down 3.5 percent year over year.
� Single-family housing construction permits
rose 3.2 percent from May to June, marking the
third consecutive month of increase. Permits
are up 10.7 percent year over year. Existing-
home sales grew 2.1 percent from May to June.
� Home inventories remained at 3.6 months of
available supply in June and were below their
year-ago level of 4 months.
�Monthly Texas exports edged down 0.2
percent in May after rising 4.7 percent in April.
However, May exports were 6.2 percent higher
than last year’s levels.
Employment Growth
Texas Housing Starts
Monthly Texas Exports
FEDERAL RESERVE BANK OF DALLAS • AUGUST 2014
-8!
-6!
-4!
-2!
0!
2!
4!
6!
8!
2010! 2011! 2012! 2013! 2014!
Texas! U.S.!
50!
70!
90!
110!
130!
150!
170!
190!
210!
2009! 2010! 2011! 2012! 2013! 2014!
10,000!
11,000!
12,000!
13,000!
14,000!
15,000!
16,000!
17,000!
18,000!
19,000!
20,000!
2010! 2011! 2012! 2013! 2014!
DALLASFED
Month-over-month percent change, annualized
Thousand units, seasonally adjusted annual rate
Real 2000 dollars (millions)
2. Crude Oil Prices Natural Gas Prices Texas Rig Count
$/barrel $/million Btu Active rigs
� The West Texas Intermediate crude oil
price fell to $103.40 per barrel in July and
was down 1.24 percent year over year.
� Natural gas prices edged down to $4.01
per million Btu in July, a 12.3 percent de-
crease from the June level. The price was
10.5 percent higher than in July 2013.
� The Texas rig count rose to 892 in July
from 891 in June and was up 6.1 percent
year over year.
� The Texas Leading Index, which uses key
economic indicators to forecast employment
growth, rose 1.3 percent from March to May.
� Texas factory activity increased again in July,
according to business executives responding
to the Texas Manufacturing Outlook Survey.
The production index, a key measure of state
manufacturing conditions, rose from 15.5 to
19.1, indicating output grew at a faster pace
than in June.
� The Dallas Fed conducts the monthly Texas
Manufacturing Outlook Survey to obtain a
timely assessment of the state’s factory activity.
Texas Leading Index with Components
Production Index –Texas Manufacturing
NOTE: Data may not match previously published numbers due to data revisions.
SOURCES: Employment: Bureau of Labor Statistics’ Current Employment Statistics (CES); Texas Workforce Commission; seasonal and other adjustments by Federal Reserve Bank of Dallas.
Housing: Multiple Listing Service; U.S. Census Bureau; Bank of Tokyo-Mitsubishi UFJ. All housing data are seasonally adjusted.
Exports: U.S. Census Bureau; World Institute for Strategic Economic Research; seasonal and other adjustments by Federal Reserve Bank of Dallas.
Energy: Wall Street Journal; Bloomberg; Henry Hub; Baker Hughes.
Texas Leading Index: Federal Reserve Bank of Dallas. Data are seasonally adjusted.
Texas Manufacturing Production Index: Federal Reserve Bank of Dallas. Data are seasonally adjusted.
Questions can be addressed to Chelsea LeHew at chelsea.lehew@dal.frb.org. Texas Economic Indicators is released on the first Wednesday of every month and can be found online at
www.dallasfed.org/research/indicators/index.cfm.
$20!
$40!
$60!
$80!
$100!
$120!
$140!
2010! 2011! 2012! 2013! 2014!
$1!
$2!
$3!
$4!
$5!
$6!
$7!
2010! 2011! 2012! 2013! 2014!
200!
400!
600!
800!
1,000!
2010! 2011! 2012! 2013! 2014!
0.16!
-0.17!
0.20!
0.13!
0.08!
0.01!
0.56!
0.30!
1.27!
-0.4! 0.0! 0.4! 0.8! 1.2! 1.6!
Average weekly hours!
Help-wanted Index!
Texas Stock Index!
New unemployment claims!
Well permits!
Real oil price!
U.S. leading index!
Texas Value of the Dollar!
Net change in Texas Leading Index!
-40!
-30!
-20!
-10!
0!
10!
20!
30!
2010! 2011! 2012! 2013! 2014!
Index
More Dallas Fed economic updates
Three-month percent change