

Recommended
More Related Content
What's hot
What's hot (20)
Similar to Ul account
Similar to Ul account (20)
More from Gordon LaFleur, LUTCF
More from Gordon LaFleur, LUTCF (20)
Recently uploaded
Recently uploaded (20)
Ul account
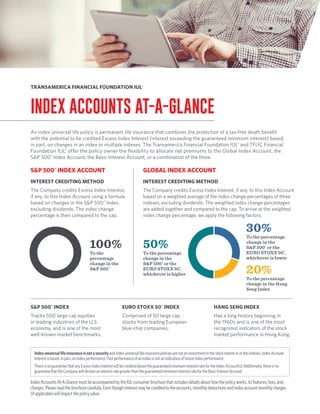
- 1. TRANSAMERICA FINANCIAL FOUNDATION IUL® INDEX ACCOUNTS AT-A-GLANCE An index universal life policy is permanent life insurance that combines the protection of a tax-free death benefit with the potential to be credited Excess Index Interest (interest exceeding the guaranteed minimum interest) based, in part, on changes in an index or multiple indexes. The Transamerica Financial Foundation IUL® and TFLIC Financial Foundation IUL® offer the policy owner the flexibility to allocate net premiums to the Global Index Account, the S&P 500® Index Account, the Basic Interest Account, or a combination of the three. S&P 500® INDEX ACCOUNT INTEREST CREDITING METHOD The Company credits Excess Index Interest, if any, to this Index Account using a formula based on changes in the S&P 500® Index, excluding dividends. The index change percentage is then compared to the cap. GLOBAL INDEX ACCOUNT INTEREST CREDITING METHOD The Company credits Excess Index Interest, if any, to this Index Account based on a weighted average of the index change percentages of three indexes, excluding dividends. The weighted index change percentages are added together and compared to the cap. To arrive at the weighted index change percentage, we apply the following factors: Index Accounts At-A-Glance must be accompanied by the IUL consumer brochure that includes details about how the policy works, its features, fees, and, charges. Please read the brochure carefully. Even though interest may be credited to the accounts, monthly deductions and index account monthly charges (if applicable) will impactthepolicyvalue. S&P 500® INDEX Tracks 500 large cap equities in leading industries of the U.S. economy, and is one of the most well-known market benchmarks. EURO STOXX 50® INDEX Comprised of 50 large cap stocks from leading European blue-chip companies. HANG SENG INDEX Has a long history beginning in the 1960s and is one of the most recognized indicators of the stock market performance in Hong Kong. 100% To the percentage change in the S&P 500® 50% To the percentage change in the S&P 500® or the EURO STOXX 50® , whichever is higher 30% To the percentage change in the S&P 500® or the EURO STOXX 50® , whichever is lower 20% To the percentage change in the Hang Seng Index Indexuniversallifeinsuranceisnotasecurityandindexuniversallifeinsurancepoliciesarenotaninvestmentinthestockmarketorintheindexes.IndexAccount Interestisbased,inpart,onindexperformance.Pastperformanceofanindexisnotanindicationoffutureindexperformance. ThereisnoguaranteethatanyExcessIndexInterestwillbecreditedabovetheguaranteedminimuminterestratefortheIndexAccount(s).Additionally,thereisno guaranteethattheCompanywilldeclareaninterestrategreaterthantheguaranteedminimuminterestratefortheBasicInterestAccount.
- 2. 2 S&P 500® INDEX ACCOUNT The S&P 500® Index Account Option will never be credited less than the guaranteed minimum interest rate, or “floor,” and has the potential to be credited with Excess Index Interest up to the current cap. 0.75% Guaranteed minimum interest rate 13.75% Current cap HISTORICAL INDEX LOOK-BACK PERIODS Thelook-backperiodsareforillustrativepurposesonly.TheIULpolicywasnotavailableduringallofthetimeperiodsshown.TheCapsaresubjecttochangeatthediscretion oftheCompanyandwillbedifferentoverdifferenttimeperiods.AlowerorhigherCapwouldproducedifferenthypotheticalresults.Further,indexchangesmeasuredon differentdateswouldproducedifferenthypotheticalresults.The“AverageIndexChange”showsthegeometricaveragesofone-yearhistoricalindexchanges(excluding dividends)endingDecember31stforeachyearduringthetimeperiodshown.“AverageIndexChangeUsingCap&Floor”showstheaveragesthatwouldhaveresultedfrom applyingthepolicy’scurrentCapandfloortotheindexchangesforthesametimeperiods. LOOK-BACK PERIOD 25-YEAR 1993-2018 20-YEAR 1998-2018 15-YEAR 2003-2018 10-YEAR 2008-2018 5-YEAR 2013-2018 1-YEAR 2017-2018 Average Index Change 6.96% 3.63% 5.57% 10.75% 6.28% -7.01% Average Index Change Using Cap & Floor 8.08% 7.36% 7.90% 8.93% 7.28% 0.75% 20 YEAR LOOK-BACK OVERVIEW CALENDAR YEAR S&P 500® INDEX CHANGE S&P 500® INDEX CHANGE USING THE FLOOR & CURRENT 13.75% CAP 1999 19.53% 13.75% 2000 -12.66% 0.75% 2001 -10.53% 0.75% 2002 -23.37% 0.75% 2003 26.38% 13.75% 2004 8.99% 8.99% 2005 4.69% 4.69% 2006 11.65% 11.65% 2007 3.65% 3.65% 2008 -38.49% 0.75% 2009 23.45% 13.75% 2010 12.78% 12.78% 2011 1.54% 1.54% 2012 11.68% 11.68% 2013 29.60% 13.75% 2014 11.39% 11.39% 2015 -0.73% 0.75% 2016 10.46% 10.46% 2017 19.40% 13.75% 2018 -7.01% 0.75% 20-YEAR AVERAGE 3.63% 7.36%
- 3. 3 GLOBAL INDEX ACCOUNT The Global Index Account option will never be credited less than the guaranteed minimum interest rate, or “floor,” and has the potential to be credited with Excess Index Interest up to the current cap. 0.75% Guaranteed minimum interest rate 15% Current cap HISTORICAL INDEX LOOK-BACK PERIODS Thelook-backperiodsareforillustrativepurposesonly.TheIULpolicywasnotavailableduringallofthetimeperiodsshown.TheCapsaresubjecttochangeatthediscretion oftheCompanyandwillbedifferentoverdifferenttimeperiods.AlowerorhigherCapwouldproducedifferenthypotheticalresults.Further,indexchangesmeasuredon differentdateswouldproducedifferenthypotheticalresults.The“AverageIndexWeightedChange”showsthegeometricaveragesofone-yearhistoricalindexchanges (excludingdividends)endingDecember31stforeachyearduringthetimeperiodshown.“AverageWeightedIndexChangeUsingCap&Floor”showstheaveragesthatwould haveresultedfromapplyingthepolicy’scurrentCapandfloortotheindexchangesforthesametimeperiods. LOOK-BACK PERIOD 25-YEAR 1993-2018 20-YEAR 1998-2018 15-YEAR 2003-2018 10-YEAR 2008-2018 5-YEAR 2013-2018 1-YEAR 2017-2018 Average Weighted Index Change 5.90% 3.26% 4.38% 7.18% 3.49% -11.31% Average Weighted Index Change Using Cap & Floor 8.74% 7.94% 8.52% 8.08% 6.02% 0.75% 20 YEAR LOOK-BACK OVERVIEW CALENDAR YEAR S&P 500® INDEX CHANGE EURO STOXX 50® INDEX CHANGE HANG SENG INDEX CHANGE WEIGHTED INDEX CHANGE WEIGHTED INDEX CHANGE USING THE FLOOR & CURRENT 15% CAP 1999 19.53% 36.86% 77.08% 39.70% 15.00% 2000 -12.66% -3.04% -14.39% -8.20% 0.75% 2001 -10.53% -20.12% -23.67% -16.04% 0.75% 2002 -23.37% -32.84% -17.49% -25.03% 0.75% 2003 26.38% 10.92% 36.69% 23.80% 15.00% 2004 8.99% 6.16% 11.22% 8.59% 8.59% 2005 4.69% 21.69% 4.97% 13.25% 13.25% 2006 11.65% 15.88% 36.59% 18.75% 15.00% 2007 3.65% 3.61% 35.01% 9.91% 9.91% 2008 -38.49% -41.55% -45.42% -40.79% 0.75% 2009 23.45% 18.98% 45.07% 26.43% 15.00% 2010 12.78% -5.91% 7.39% 6.10% 6.10% 2011 1.54% -15.83% -19.45% -7.87% 0.75% 2012 11.68% 13.45% 23.49% 14.92% 14.92% 2013 29.60% 12.86% 0.12% 18.86% 15.00% 2014 11.39% 2.60% 1.63% 6.80% 6.80% 2015 -0.73% 0.81% -10.09% -1.83% 0.75% 2016 10.46% 4.75% 3.86% 7.43% 7.43% 2017 19.40% 5.28% 37.76% 18.84% 15.00% 2018 -7.01% -14.24% -17.65% -11.31% 0.75% 20-YEAR AVERAGE 3.63% -0.84% 4.82% 3.26% 7.94%
- 4. Policy Form ICC16 IUL09, IUL09 or IUL06 NY Policy form number may vary by state. 115303 © 2019 Transamerica. All Rights Reserved. ThisisabriefoverviewoftheIndexAccountoptionsavailableintheTransamericaFinancialFoundationIUL,PolicyFormICC16IUL09orIUL09issuedbyTransamerica PremierLifeInsuranceCompany,CedarRapids,IAandtheTFLICFinancialFoundationIUL,PolicyFormIUL06NYissuedbyTransamericaFinancialLifeInsuranceCompany, Harrison,NY.TransamericaFinancialLifeInsuranceCompanyisauthorizedtoconductbusinessinNewYork.TransamericaPremierLifeInsuranceCompanyisauthorizedto conductbusinessinallotherstates.Forcompletedetailsincludingfeesandchargesassociatedwiththisproduct,pleaserefertotheconsumerbrochure. Anyguaranteesassociatedwiththispolicyarebasedontheclaims-payingabilityoftheissuinginsuranceCompany. TheS&P500IndexisaproductofS&PDowJonesIndicesLLC(“SPDJI”),andhasbeenlicensedforusebytheCompany.Standard&Poor’s® ,S&P® andS&P500® areregistered trademarksofStandard&Poor’sFinancialServicesLLC(“S&P”);DowJones® isaregisteredtrademarkofDowJonesTrademarkHoldingsLLC(“DowJones”);andthese trademarkshavebeenlicensedforusebySPDJIandsublicensedforcertainpurposesbytheCompany.Thispolicyisnotsponsored,endorsed,sold,orpromotedbySPDJI, DowJones,S&P,theirrespectiveaffiliates,andnoneofsuchpartiesmakeanyrepresentationregardingtheadvisabilityofinvestinginsuchproduct(s),nordotheyhaveany liabilityforanyerrors,omissions,orinterruptionsoftheS&P500Index. TheEUROSTOXX50® (IndexTrademark)istheintellectualproperty(includingregisteredtrademarks)ofSTOXXLimited,Zurich,Switzerland(“STOXX”),DeutscheBörse Grouportheirlicensors,whichisusedunderlicense.Thisfixedindexedlifeproduct(“LicensedProduct”)isneithersponsorednorpromoted,distributedorinanyother mannersupportedbySTOXX,DeutscheBörseGrouportheirlicensors,researchpartnersordataprovidersandSTOXX,DeutscheBörseGroupandtheirlicensors,research partnersordataprovidersdonotgiveanywarranty,andexcludeanyliability(whetherinnegligenceorotherwise)withrespecttheretogenerallyorspecificallyinrelationto anyerrors,omissions,orinterruptionsintheEUROSTOXX50® oritsdata. PleasereadthefulldisclaimerinthepolicyregardingtheHangSengIndexinrelationtothepolicy. Thismaterialisbeingprovidedforinformationalpurposesonly.ItshouldnotbeviewedasaninvestmentrecommendationbyTransamericaforcustomersor prospectivecustomers.Customersseekingadviceregardingtheirparticularinvestmentneedsshouldcontactafinancialprofessional. 3/19