SlideShare a Scribd company logo
1 of 6
Download to read offline
Iteration with purrr
Reading in many excel files in a Directory
Have come across a situation where you had to read in many excel files into R?
Luckily purrr allows you to iterate through your excel files and programmatically get them into your R
session
With a few easy steps you can easily harness the awesome power of purr
1. Method 1:
a. Saving excel files as a list
2. Method 2
a. Storing excel sheets as a nested data frame
Setup
load libraries
• tidyverse
• readxl
• fs (gives a rock solid cross-platform interface to the filesystem)
LIBRARY(TIDYVERSE)
LIBRARY(READXL)
LIBRARY(FS)
Setup (continued)
The fs::dir_info() function returns information on all files in a directory and stores it in a tibble
I wrap my expressions in parentheses to assign it to a variable AND print it to the console for example:
(x<-sum(y))
SUPPLY THE DIR_INFO FUNCTION A PATH TO YOUR EXCEL FILES DIRECTORY:
(XL_PATHS <- FS::DIR_INFO('EXCEL_SHEETS/'))
A TIBBLE: 2 X 18
PATH TYPE SIZE PERMISSIONS MODIFICATION_TIME USER GROUP
<FS::PATH> <FCT> <FS:> <FS::PERMS> <DTTM> <CHR> <CHR>
1 EXCEL_SHE~ FILE 15.8M RW- 2019-09-04 19:33:13 <NA> <NA>
2 EXCEL_SHE~ FILE 68.7K RW- 2019-09-21 23:00:40 <NA> <NA>
... WITH 11 MORE VARIABLES: DEVICE_ID <DBL>, HARD_LINKS <DBL>,
SPECIAL_DEVICE_ID <DBL>, INODE <DBL>, BLOCK_SIZE <DBL>, BLOCKS <DBL>,
FLAGS <INT>, GENERATION <DBL>, ACCESS_TIME <DTTM>, CHANGE_TIME <DTTM>,
BIRTH_TIME <DTTM>
Saving excel files as a list
Below is a method for storing all excel files that have been imported as a list
• pull the path from the xl_paths tibble using the pull function from dplyr
• This will give the paths to excel sheets you want to import as a charater vector
(XL_PATHS_CHR_VECTOR <- XL_PATHS %>%
PULL(PATH)
)
EXCEL_SHEETS/FACTORY.XLSX EXCEL_SHEETS/PREST_MEET.XLSX
USE THESE PATHS AND APPLY MAP FUNCTION IN ORDER TO ITERATE THE READ_EXCEL FUNCTION OVER THE C
HARACTER VECTOR
THERE ARE MANY METHODS FOR ACHIEVING TE SAME RESULTS BUT I WILL USE AN ANONYMOUS FUNCTION:
XL_PATHS_CHR_VECTOR %>%
MAP( ~ READ_EXCEL(.)) %>%
THIS WILL RETURN A LIST OF 2
LET'S GIVE THE SHEET THEIR ORIGINAL NAMES WITH THE SET_NAMES() FUNCTION
SET_NAMES(XL_PATHS_CHR_VECTOR)
$`EXCEL_SHEETS/FACTORY.XLSX`
A TIBBLE: 275,415 X 15
SZFROM SZTO WEIGHT TRANSDATE TRANSTIME PN
<CHR> <DBL> <DBL> <DTTM> <DTTM> <CHR>
1 <NA> NA 0 2019-09-04 00:00:00 2019-09-04 08:52:00 C340~
2 <NA> NA 0 2019-09-04 00:00:00 2019-09-04 07:45:00 C340~
3 <NA> NA 0 2019-09-04 00:00:00 2019-09-04 09:12:00 C340~
4 <NA> NA 0 2019-09-04 00:00:00 2019-09-04 08:18:00 C340~
5 <NA> NA 0 2019-09-04 00:00:00 2019-09-04 08:23:00 C340~
6 <NA> NA 0 2019-09-04 00:00:00 2019-09-04 08:10:00 C340~
7 <NA> NA 0 2019-09-04 00:00:00 2019-09-04 08:03:00 C340~
8 <NA> NA 0 2019-09-04 00:00:00 2019-09-04 07:28:00 C340~
9 <NA> NA 0 2019-09-04 00:00:00 2019-09-04 09:36:00 C340~
10 <NA> NA 0 2019-09-04 00:00:00 2019-09-04 08:20:00 C340~
... WITH 275,405 MORE ROWS, AND 9 MORE VARIABLES: PACKLINE <CHR>,
MARKETVA <CHR>, VA <CHR>, BINNO <DBL>, BG <CHR>, FC <CHR>,
`IF(BINTRANS.TRANSTIME>"06:00" AND BINTRANS.TRANSTIME<"18:30", "DAG",
"NAG")` <CHR>, `DATE (IF (TRANSTIME>="00:00" AND TRANSTIME<"06:00" ,
TRANSDATE-1,TRANSDATE) )` <DTTM>, ...15 <LGL>
$`EXCEL_SHEETS/PREST_MEET.XLSX`
A TIBBLE: 205 X 18
DATE W_DAY WEEK_NUM MONTH_NUM `LINE 1_KG` `LINE 2_KG`
<DTTM> <CHR> <DBL> <DBL> <CHR> <CHR>
1 2019-03-11 00:00:00 MON 11 3 32528.6999~ 37936.0999~
2 2019-03-12 00:00:00 TUE 11 3 40674.9999~ 56930.3999~
3 2019-03-13 00:00:00 WED 11 3 39505.1999~ 58524.5999~
4 2019-03-14 00:00:00 THU 11 3 35589.3999~ 16834.2000~
5 2019-03-15 00:00:00 FRI 11 3 22113.5999~ 12266.6000~
6 2019-03-16 00:00:00 SAT NA NA NA NA
7 2019-03-17 00:00:00 SUN NA NA NA NA
8 2019-03-18 00:00:00 MON 12 3 34105.1999~ 18727.0999~
9 2019-03-19 00:00:00 TUE 12 3 42978.0999~ 30003.3999~
10 2019-03-20 00:00:00 WED 12 3 34028.4999~ 23582.4999~
... WITH 195 MORE ROWS, AND 12 MORE VARIABLES: `LINE 3_KG` <CHR>,
STD_CARTN <CHR>, SHIFT <CHR>, WORKERS_1 <CHR>, WORKERS_2 <CHR>,
WORKERS_3 <CHR>, STD_CRTN_PACKER <CHR>, WEIGHT_WORK_HOUR <CHR>,
`STD_CRTN PER MAN_HOUR` <CHR>, L1_WEIGHT_PACKER_SHIFT <CHR>,
L2_WEIGHT_PACKER_SHIFT <CHR>, L3_WEIGHT_PACKER_SHIFT <CHR>
Storing excel sheets as a nested data frame
Admittedly, I prefer this method for two reasons:
• It’s less coding
• It keeps everything organized in a tabular fashion (Notice the type is )
XL_PATHS %>%
SELECT ONLY THE PATH COLUMN
SELECT(PATH)
A TIBBLE: 2 X 1
PATH
<FS::PATH>
1 EXCEL_SHEETS/FACTORY.XLSX
2 EXCEL_SHEETS/PREST_MEET.XLSX
XL_PATHS %>%
SELECT ONLY THE PATH COLUMN
SELECT(PATH) %>%
CREATE A NEW COLUMN CALLED DATA AND POPULATE IT WITH THE EXCEL SHEETS USING THE MAP FUNCT
ION
MUTATE(DATA = PATH %>% MAP(READ_EXCEL))
A TIBBLE: 2 X 2
PATH DATA
<FS::PATH> <LIST>
1 EXCEL_SHEETS/FACTORY.XLSX <TIBBLE [275,415 X 15]>
2 EXCEL_SHEETS/PREST_MEET.XLSX <TIBBLE [205 X 18]>
Reading every sheet of an excel file
You can also use the map function to read in every single sheet into R
LIST ALL THE SHEETS NAMES WITH READ::XLEXCEL_SHEETS()
(SHEET_NAMES <- EXCEL_SHEETS('EXCEL_SHEETS/PREST_MEET.XLSX'))
[1] "FORMULAS" "DAILY" "WEEKLY" "MONTHLY"
SHEET_NAMES %>%
MAP( ~ READ_EXCEL(PATH = 'EXCEL_SHEETS/PREST_MEET.XLSX',SHEET = .)) %>%
GIVE THE LIST THE NAMES OF THE SHEETS
SET_NAMES(SHEET_NAMES)
$FORMULAS
A TIBBLE: 205 X 18
DATE W_DAY WEEK_NUM MONTH_NUM `LINE 1_KG` `LINE 2_KG`
<DTTM> <CHR> <DBL> <DBL> <CHR> <CHR>
1 2019-03-11 00:00:00 MON 11 3 32528.6999~ 37936.0999~
2 2019-03-12 00:00:00 TUE 11 3 40674.9999~ 56930.3999~
3 2019-03-13 00:00:00 WED 11 3 39505.1999~ 58524.5999~
4 2019-03-14 00:00:00 THU 11 3 35589.3999~ 16834.2000~
5 2019-03-15 00:00:00 FRI 11 3 22113.5999~ 12266.6000~
6 2019-03-16 00:00:00 SAT NA NA NA NA
7 2019-03-17 00:00:00 SUN NA NA NA NA
8 2019-03-18 00:00:00 MON 12 3 34105.1999~ 18727.0999~
9 2019-03-19 00:00:00 TUE 12 3 42978.0999~ 30003.3999~
10 2019-03-20 00:00:00 WED 12 3 34028.4999~ 23582.4999~
... WITH 195 MORE ROWS, AND 12 MORE VARIABLES: `LINE 3_KG` <CHR>,
STD_CARTN <CHR>, SHIFT <CHR>, WORKERS_1 <CHR>, WORKERS_2 <CHR>,
WORKERS_3 <CHR>, STD_CRTN_PACKER <CHR>, WEIGHT_WORK_HOUR <CHR>,
`STD_CRTN PER MAN_HOUR` <CHR>, L1_WEIGHT_PACKER_SHIFT <CHR>,
L2_WEIGHT_PACKER_SHIFT <CHR>, L3_WEIGHT_PACKER_SHIFT <CHR>
$DAILY
A TIBBLE: 205 X 16
DATE W_DAY `LINE 1_KG` `LINE 2_KG` `LINE 3_KG` STD_CARTN
<DTTM> <CHR> <CHR> <CHR> <CHR> <CHR>
1 2019-03-11 00:00:00 MON 32528.6999~ 37936.0999~ 58170.9999~ 10291
2 2019-03-12 00:00:00 TUE 40674.9999~ 56930.3999~ 31380.5999~ 10319
3 2019-03-13 00:00:00 WED 39505.1999~ 58524.5999~ 28169.0999~ 10096
4 2019-03-14 00:00:00 THU 35589.3999~ 16834.2000~ 59225.0999~ 8932
5 2019-03-15 00:00:00 FRI 22113.5999~ 12266.6000~ 45154.3999~ 6363
6 2019-03-16 00:00:00 SAT NA NA NA NA
7 2019-03-17 00:00:00 SUN NA NA NA NA
8 2019-03-18 00:00:00 MON 34105.1999~ 18727.0999~ 58628.3999~ 8917
9 2019-03-19 00:00:00 TUE 42978.0999~ 30003.3999~ 60483.6999~ 10678
10 2019-03-20 00:00:00 WED 34028.4999~ 23582.4999~ 58484.4999~ 9288
... WITH 195 MORE ROWS, AND 10 MORE VARIABLES: SHIFT <CHR>,
WORKERS_1 <CHR>, WORKERS_2 <CHR>, WORKERS_3 <CHR>,
STD_CRTN_HOUR <CHR>, WEIGHT_WORK_HOUR <CHR>, `STD_CRTN PER
MAN_HOUR` <CHR>, L1_WEIGHT_PACKER_SHIFT <CHR>,
L2_WEIGHT_PACKER_SHIFT <CHR>, L3_WEIGHT_PACKER_SHIFT <CHR>
$WEEKLY
A TIBBLE: 25 X 15
WEEK_NUM `LINE 1_KG` `LINE 2_KG` `LINE 3_KG` STD_CARTN SHIFT WORKERS_1
<DBL> <DBL> <DBL> <DBL> <DBL> <DBL> <DBL>
1 11 170412. 182492. 222100. 46001 45 64
2 12 132911. 84820. 220912. 35093 38 58
3 13 125797. 89689. 219380. 34791 45 57
4 14 150072. 137770. 252678. 43244 45 64
5 15 143723. 118420. 275909. 43046 45 65
6 16 112790. 93831. 219896. 34122 38 56
7 17 96847. 79931. 208532. 30827 35.5 56
8 18 94577. 72048. 199143. 29263 38 61
9 19 78358. 87057. 186245. 28135 35.5 61
10 20 173836. 59652. 235529. 37524 45 71
... WITH 15 MORE ROWS, AND 8 MORE VARIABLES: WORKERS_2 <DBL>,
WORKERS_3 <DBL>, STD_CRTN_PACKER <DBL>, WEIGHT_WORK_HOUR <DBL>,
`STD_CRTN PER MAN_HOUR` <DBL>, L1_WEIGHT_PACKER_SHIFT <DBL>,
L2_WEIGHT_PACKER_SHIFT <DBL>, L3_WEIGHT_PACKER_SHIFT <DBL>
$MONTHLY
A TIBBLE: 6 X 15
MONTH_NUM `LINE 1_KG` `LINE 2_KG` `LINE 3_KG` STD_CARTN SHIFT WORKERS_1
<DBL> <DBL> <DBL> <DBL> <DBL> <DBL> <DBL>
1 3 429120. 357000. 662393. 115885 128 179
2 4 555377. 468461. 1052067. 166080 182. 270
3 5 469177. 388926. 1035392. 151491 190. 387
4 6 455030. 377497. 800238. 130631 170. 307
5 7 432560. 439760. 905410. 142227 164. 276
6 8 597778. 671961. 1162558. 194595 190. 390
... WITH 8 MORE VARIABLES: WORKERS_2 <DBL>, WORKERS_3 <DBL>,
STD_CRTN_PACKER <DBL>, WEIGHT_WORK_HOUR <DBL>, `STD_CRTN PER
MAN_HOUR` <DBL>, L1_WEIGHT_PACKER_SHIFT <DBL>,
L2_WEIGHT_PACKER_SHIFT <DBL>, L3_WEIGHT_PACKER_SHIFT <DBL>

More Related Content

Similar to How to read multiple excel files - With R

Data manipulation on r
Data manipulation on rData manipulation on r
Data manipulation on rAbhik Seal
 
Most useful queries
Most useful queriesMost useful queries
Most useful queriesSam Depp
 
OTN TOUR 2016 - DBA Commands and Concepts That Every Developer Should Know
OTN TOUR 2016 - DBA Commands and Concepts That Every Developer Should KnowOTN TOUR 2016 - DBA Commands and Concepts That Every Developer Should Know
OTN TOUR 2016 - DBA Commands and Concepts That Every Developer Should KnowAlex Zaballa
 
My sql Syntax
My sql SyntaxMy sql Syntax
My sql SyntaxReka
 
Handling missing data and outliers
Handling missing data and outliersHandling missing data and outliers
Handling missing data and outliersCasper Crause
 
Leaflet JS (GIS) and Capital MetroRail
Leaflet JS (GIS) and Capital MetroRailLeaflet JS (GIS) and Capital MetroRail
Leaflet JS (GIS) and Capital MetroRailterrafrost2
 
Computer Science Programming Assignment Help
Computer Science Programming Assignment HelpComputer Science Programming Assignment Help
Computer Science Programming Assignment HelpProgramming Homework Help
 
Data tidying with tidyr meetup
Data tidying with tidyr  meetupData tidying with tidyr  meetup
Data tidying with tidyr meetupMatthew Samelson
 
Intro To TSQL - Unit 1
Intro To TSQL - Unit 1Intro To TSQL - Unit 1
Intro To TSQL - Unit 1iccma
 
Non-Relational Postgres / Bruce Momjian (EnterpriseDB)
Non-Relational Postgres / Bruce Momjian (EnterpriseDB)Non-Relational Postgres / Bruce Momjian (EnterpriseDB)
Non-Relational Postgres / Bruce Momjian (EnterpriseDB)Ontico
 
SQL Optimization With Trace Data And Dbms Xplan V6
SQL Optimization With Trace Data And Dbms Xplan V6SQL Optimization With Trace Data And Dbms Xplan V6
SQL Optimization With Trace Data And Dbms Xplan V6Mahesh Vallampati
 
Intro to tsql unit 1
Intro to tsql   unit 1Intro to tsql   unit 1
Intro to tsql unit 1Syed Asrarali
 

Similar to How to read multiple excel files - With R (20)

Data manipulation on r
Data manipulation on rData manipulation on r
Data manipulation on r
 
Most useful queries
Most useful queriesMost useful queries
Most useful queries
 
Cassandra
CassandraCassandra
Cassandra
 
Databases with SQLite3.pdf
Databases with SQLite3.pdfDatabases with SQLite3.pdf
Databases with SQLite3.pdf
 
Sql
SqlSql
Sql
 
OTN TOUR 2016 - DBA Commands and Concepts That Every Developer Should Know
OTN TOUR 2016 - DBA Commands and Concepts That Every Developer Should KnowOTN TOUR 2016 - DBA Commands and Concepts That Every Developer Should Know
OTN TOUR 2016 - DBA Commands and Concepts That Every Developer Should Know
 
OTN TOUR 2016 - DBA Commands and Concepts That Every Developer Should Know
OTN TOUR 2016 - DBA Commands and Concepts That Every Developer Should KnowOTN TOUR 2016 - DBA Commands and Concepts That Every Developer Should Know
OTN TOUR 2016 - DBA Commands and Concepts That Every Developer Should Know
 
Sql Document in Testing
Sql Document in TestingSql Document in Testing
Sql Document in Testing
 
My sql Syntax
My sql SyntaxMy sql Syntax
My sql Syntax
 
Fdms 1st cycle exp.pdf
Fdms 1st cycle exp.pdfFdms 1st cycle exp.pdf
Fdms 1st cycle exp.pdf
 
Data Management in R
Data Management in RData Management in R
Data Management in R
 
Handling missing data and outliers
Handling missing data and outliersHandling missing data and outliers
Handling missing data and outliers
 
Leaflet JS (GIS) and Capital MetroRail
Leaflet JS (GIS) and Capital MetroRailLeaflet JS (GIS) and Capital MetroRail
Leaflet JS (GIS) and Capital MetroRail
 
Computer Science Programming Assignment Help
Computer Science Programming Assignment HelpComputer Science Programming Assignment Help
Computer Science Programming Assignment Help
 
Data tidying with tidyr meetup
Data tidying with tidyr  meetupData tidying with tidyr  meetup
Data tidying with tidyr meetup
 
Intro To TSQL - Unit 1
Intro To TSQL - Unit 1Intro To TSQL - Unit 1
Intro To TSQL - Unit 1
 
Non-Relational Postgres / Bruce Momjian (EnterpriseDB)
Non-Relational Postgres / Bruce Momjian (EnterpriseDB)Non-Relational Postgres / Bruce Momjian (EnterpriseDB)
Non-Relational Postgres / Bruce Momjian (EnterpriseDB)
 
SQL Optimization With Trace Data And Dbms Xplan V6
SQL Optimization With Trace Data And Dbms Xplan V6SQL Optimization With Trace Data And Dbms Xplan V6
SQL Optimization With Trace Data And Dbms Xplan V6
 
Intro to tsql unit 1
Intro to tsql   unit 1Intro to tsql   unit 1
Intro to tsql unit 1
 
Sqlserver 2008 r2
Sqlserver 2008 r2Sqlserver 2008 r2
Sqlserver 2008 r2
 

More from Casper Crause

Integrating R and Power BI
Integrating R and Power BIIntegrating R and Power BI
Integrating R and Power BICasper Crause
 
Company segmentation - an approach with R
Company segmentation - an approach with RCompany segmentation - an approach with R
Company segmentation - an approach with RCasper Crause
 
Storytelling By Visualization
Storytelling By Visualization Storytelling By Visualization
Storytelling By Visualization Casper Crause
 
Comparing Co2 Emissions Around The Globe
Comparing Co2 Emissions Around The GlobeComparing Co2 Emissions Around The Globe
Comparing Co2 Emissions Around The GlobeCasper Crause
 
Understanding control-flow
Understanding control-flowUnderstanding control-flow
Understanding control-flowCasper Crause
 
Levelling up your chart skills
Levelling up your chart skillsLevelling up your chart skills
Levelling up your chart skillsCasper Crause
 
Wrangling data the tidy way with the tidyverse
Wrangling data the tidy way with the tidyverseWrangling data the tidy way with the tidyverse
Wrangling data the tidy way with the tidyverseCasper Crause
 
Project portfolio for Casper Crause
Project portfolio for Casper CrauseProject portfolio for Casper Crause
Project portfolio for Casper CrauseCasper Crause
 

More from Casper Crause (8)

Integrating R and Power BI
Integrating R and Power BIIntegrating R and Power BI
Integrating R and Power BI
 
Company segmentation - an approach with R
Company segmentation - an approach with RCompany segmentation - an approach with R
Company segmentation - an approach with R
 
Storytelling By Visualization
Storytelling By Visualization Storytelling By Visualization
Storytelling By Visualization
 
Comparing Co2 Emissions Around The Globe
Comparing Co2 Emissions Around The GlobeComparing Co2 Emissions Around The Globe
Comparing Co2 Emissions Around The Globe
 
Understanding control-flow
Understanding control-flowUnderstanding control-flow
Understanding control-flow
 
Levelling up your chart skills
Levelling up your chart skillsLevelling up your chart skills
Levelling up your chart skills
 
Wrangling data the tidy way with the tidyverse
Wrangling data the tidy way with the tidyverseWrangling data the tidy way with the tidyverse
Wrangling data the tidy way with the tidyverse
 
Project portfolio for Casper Crause
Project portfolio for Casper CrauseProject portfolio for Casper Crause
Project portfolio for Casper Crause
 

Recently uploaded

SAC 25 Final National, Regional & Local Angel Group Investing Insights 2024 0...
SAC 25 Final National, Regional & Local Angel Group Investing Insights 2024 0...SAC 25 Final National, Regional & Local Angel Group Investing Insights 2024 0...
SAC 25 Final National, Regional & Local Angel Group Investing Insights 2024 0...Elaine Werffeli
 
Predictive Precipitation: Advanced Rain Forecasting Techniques
Predictive Precipitation: Advanced Rain Forecasting TechniquesPredictive Precipitation: Advanced Rain Forecasting Techniques
Predictive Precipitation: Advanced Rain Forecasting TechniquesBoston Institute of Analytics
 
sourabh vyas1222222222222222222244444444
sourabh vyas1222222222222222222244444444sourabh vyas1222222222222222222244444444
sourabh vyas1222222222222222222244444444saurabvyas476
 
Las implicancias del memorándum de entendimiento entre Codelco y SQM según la...
Las implicancias del memorándum de entendimiento entre Codelco y SQM según la...Las implicancias del memorándum de entendimiento entre Codelco y SQM según la...
Las implicancias del memorándum de entendimiento entre Codelco y SQM según la...Voces Mineras
 
如何办理(WashU毕业证书)圣路易斯华盛顿大学毕业证成绩单本科硕士学位证留信学历认证
如何办理(WashU毕业证书)圣路易斯华盛顿大学毕业证成绩单本科硕士学位证留信学历认证如何办理(WashU毕业证书)圣路易斯华盛顿大学毕业证成绩单本科硕士学位证留信学历认证
如何办理(WashU毕业证书)圣路易斯华盛顿大学毕业证成绩单本科硕士学位证留信学历认证acoha1
 
Harnessing the Power of GenAI for BI and Reporting.pptx
Harnessing the Power of GenAI for BI and Reporting.pptxHarnessing the Power of GenAI for BI and Reporting.pptx
Harnessing the Power of GenAI for BI and Reporting.pptxParas Gupta
 
In Riyadh ((+919101817206)) Cytotec kit @ Abortion Pills Saudi Arabia
In Riyadh ((+919101817206)) Cytotec kit @ Abortion Pills Saudi ArabiaIn Riyadh ((+919101817206)) Cytotec kit @ Abortion Pills Saudi Arabia
In Riyadh ((+919101817206)) Cytotec kit @ Abortion Pills Saudi Arabiaahmedjiabur940
 
Case Study 4 Where the cry of rebellion happen?
Case Study 4 Where the cry of rebellion happen?Case Study 4 Where the cry of rebellion happen?
Case Study 4 Where the cry of rebellion happen?RemarkSemacio
 
Displacement, Velocity, Acceleration, and Second Derivatives
Displacement, Velocity, Acceleration, and Second DerivativesDisplacement, Velocity, Acceleration, and Second Derivatives
Displacement, Velocity, Acceleration, and Second Derivatives23050636
 
Ranking and Scoring Exercises for Research
Ranking and Scoring Exercises for ResearchRanking and Scoring Exercises for Research
Ranking and Scoring Exercises for ResearchRajesh Mondal
 
Northern New England Tableau User Group (TUG) May 2024
Northern New England Tableau User Group (TUG) May 2024Northern New England Tableau User Group (TUG) May 2024
Northern New England Tableau User Group (TUG) May 2024patrickdtherriault
 
Jual Obat Aborsi Bandung (Asli No.1) Wa 082134680322 Klinik Obat Penggugur Ka...
Jual Obat Aborsi Bandung (Asli No.1) Wa 082134680322 Klinik Obat Penggugur Ka...Jual Obat Aborsi Bandung (Asli No.1) Wa 082134680322 Klinik Obat Penggugur Ka...
Jual Obat Aborsi Bandung (Asli No.1) Wa 082134680322 Klinik Obat Penggugur Ka...Klinik Aborsi
 
jll-asia-pacific-capital-tracker-1q24.pdf
jll-asia-pacific-capital-tracker-1q24.pdfjll-asia-pacific-capital-tracker-1q24.pdf
jll-asia-pacific-capital-tracker-1q24.pdfjaytendertech
 
Introduction to Statistics Presentation.pptx
Introduction to Statistics Presentation.pptxIntroduction to Statistics Presentation.pptx
Introduction to Statistics Presentation.pptxAniqa Zai
 
Reconciling Conflicting Data Curation Actions: Transparency Through Argument...
Reconciling Conflicting Data Curation Actions:  Transparency Through Argument...Reconciling Conflicting Data Curation Actions:  Transparency Through Argument...
Reconciling Conflicting Data Curation Actions: Transparency Through Argument...Bertram Ludäscher
 
社内勉強会資料_Object Recognition as Next Token Prediction
社内勉強会資料_Object Recognition as Next Token Prediction社内勉強会資料_Object Recognition as Next Token Prediction
社内勉強会資料_Object Recognition as Next Token PredictionNABLAS株式会社
 
如何办理英国诺森比亚大学毕业证(NU毕业证书)成绩单原件一模一样
如何办理英国诺森比亚大学毕业证(NU毕业证书)成绩单原件一模一样如何办理英国诺森比亚大学毕业证(NU毕业证书)成绩单原件一模一样
如何办理英国诺森比亚大学毕业证(NU毕业证书)成绩单原件一模一样wsppdmt
 

Recently uploaded (20)

SAC 25 Final National, Regional & Local Angel Group Investing Insights 2024 0...
SAC 25 Final National, Regional & Local Angel Group Investing Insights 2024 0...SAC 25 Final National, Regional & Local Angel Group Investing Insights 2024 0...
SAC 25 Final National, Regional & Local Angel Group Investing Insights 2024 0...
 
Predictive Precipitation: Advanced Rain Forecasting Techniques
Predictive Precipitation: Advanced Rain Forecasting TechniquesPredictive Precipitation: Advanced Rain Forecasting Techniques
Predictive Precipitation: Advanced Rain Forecasting Techniques
 
sourabh vyas1222222222222222222244444444
sourabh vyas1222222222222222222244444444sourabh vyas1222222222222222222244444444
sourabh vyas1222222222222222222244444444
 
Las implicancias del memorándum de entendimiento entre Codelco y SQM según la...
Las implicancias del memorándum de entendimiento entre Codelco y SQM según la...Las implicancias del memorándum de entendimiento entre Codelco y SQM según la...
Las implicancias del memorándum de entendimiento entre Codelco y SQM según la...
 
Abortion pills in Riyadh Saudi Arabia (+966572737505 buy cytotec
Abortion pills in Riyadh Saudi Arabia (+966572737505 buy cytotecAbortion pills in Riyadh Saudi Arabia (+966572737505 buy cytotec
Abortion pills in Riyadh Saudi Arabia (+966572737505 buy cytotec
 
如何办理(WashU毕业证书)圣路易斯华盛顿大学毕业证成绩单本科硕士学位证留信学历认证
如何办理(WashU毕业证书)圣路易斯华盛顿大学毕业证成绩单本科硕士学位证留信学历认证如何办理(WashU毕业证书)圣路易斯华盛顿大学毕业证成绩单本科硕士学位证留信学历认证
如何办理(WashU毕业证书)圣路易斯华盛顿大学毕业证成绩单本科硕士学位证留信学历认证
 
Harnessing the Power of GenAI for BI and Reporting.pptx
Harnessing the Power of GenAI for BI and Reporting.pptxHarnessing the Power of GenAI for BI and Reporting.pptx
Harnessing the Power of GenAI for BI and Reporting.pptx
 
In Riyadh ((+919101817206)) Cytotec kit @ Abortion Pills Saudi Arabia
In Riyadh ((+919101817206)) Cytotec kit @ Abortion Pills Saudi ArabiaIn Riyadh ((+919101817206)) Cytotec kit @ Abortion Pills Saudi Arabia
In Riyadh ((+919101817206)) Cytotec kit @ Abortion Pills Saudi Arabia
 
Case Study 4 Where the cry of rebellion happen?
Case Study 4 Where the cry of rebellion happen?Case Study 4 Where the cry of rebellion happen?
Case Study 4 Where the cry of rebellion happen?
 
Displacement, Velocity, Acceleration, and Second Derivatives
Displacement, Velocity, Acceleration, and Second DerivativesDisplacement, Velocity, Acceleration, and Second Derivatives
Displacement, Velocity, Acceleration, and Second Derivatives
 
Ranking and Scoring Exercises for Research
Ranking and Scoring Exercises for ResearchRanking and Scoring Exercises for Research
Ranking and Scoring Exercises for Research
 
Northern New England Tableau User Group (TUG) May 2024
Northern New England Tableau User Group (TUG) May 2024Northern New England Tableau User Group (TUG) May 2024
Northern New England Tableau User Group (TUG) May 2024
 
Jual Obat Aborsi Bandung (Asli No.1) Wa 082134680322 Klinik Obat Penggugur Ka...
Jual Obat Aborsi Bandung (Asli No.1) Wa 082134680322 Klinik Obat Penggugur Ka...Jual Obat Aborsi Bandung (Asli No.1) Wa 082134680322 Klinik Obat Penggugur Ka...
Jual Obat Aborsi Bandung (Asli No.1) Wa 082134680322 Klinik Obat Penggugur Ka...
 
jll-asia-pacific-capital-tracker-1q24.pdf
jll-asia-pacific-capital-tracker-1q24.pdfjll-asia-pacific-capital-tracker-1q24.pdf
jll-asia-pacific-capital-tracker-1q24.pdf
 
Introduction to Statistics Presentation.pptx
Introduction to Statistics Presentation.pptxIntroduction to Statistics Presentation.pptx
Introduction to Statistics Presentation.pptx
 
Reconciling Conflicting Data Curation Actions: Transparency Through Argument...
Reconciling Conflicting Data Curation Actions:  Transparency Through Argument...Reconciling Conflicting Data Curation Actions:  Transparency Through Argument...
Reconciling Conflicting Data Curation Actions: Transparency Through Argument...
 
Abortion pills in Jeddah | +966572737505 | Get Cytotec
Abortion pills in Jeddah | +966572737505 | Get CytotecAbortion pills in Jeddah | +966572737505 | Get Cytotec
Abortion pills in Jeddah | +966572737505 | Get Cytotec
 
Abortion pills in Riyadh Saudi Arabia| +966572737505 | Get Cytotec, Unwanted Kit
Abortion pills in Riyadh Saudi Arabia| +966572737505 | Get Cytotec, Unwanted KitAbortion pills in Riyadh Saudi Arabia| +966572737505 | Get Cytotec, Unwanted Kit
Abortion pills in Riyadh Saudi Arabia| +966572737505 | Get Cytotec, Unwanted Kit
 
社内勉強会資料_Object Recognition as Next Token Prediction
社内勉強会資料_Object Recognition as Next Token Prediction社内勉強会資料_Object Recognition as Next Token Prediction
社内勉強会資料_Object Recognition as Next Token Prediction
 
如何办理英国诺森比亚大学毕业证(NU毕业证书)成绩单原件一模一样
如何办理英国诺森比亚大学毕业证(NU毕业证书)成绩单原件一模一样如何办理英国诺森比亚大学毕业证(NU毕业证书)成绩单原件一模一样
如何办理英国诺森比亚大学毕业证(NU毕业证书)成绩单原件一模一样
 

How to read multiple excel files - With R

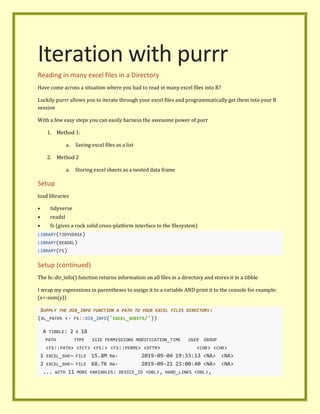
  • 1. Iteration with purrr Reading in many excel files in a Directory Have come across a situation where you had to read in many excel files into R? Luckily purrr allows you to iterate through your excel files and programmatically get them into your R session With a few easy steps you can easily harness the awesome power of purr 1. Method 1: a. Saving excel files as a list 2. Method 2 a. Storing excel sheets as a nested data frame Setup load libraries • tidyverse • readxl • fs (gives a rock solid cross-platform interface to the filesystem) LIBRARY(TIDYVERSE) LIBRARY(READXL) LIBRARY(FS) Setup (continued) The fs::dir_info() function returns information on all files in a directory and stores it in a tibble I wrap my expressions in parentheses to assign it to a variable AND print it to the console for example: (x<-sum(y)) SUPPLY THE DIR_INFO FUNCTION A PATH TO YOUR EXCEL FILES DIRECTORY: (XL_PATHS <- FS::DIR_INFO('EXCEL_SHEETS/')) A TIBBLE: 2 X 18 PATH TYPE SIZE PERMISSIONS MODIFICATION_TIME USER GROUP <FS::PATH> <FCT> <FS:> <FS::PERMS> <DTTM> <CHR> <CHR> 1 EXCEL_SHE~ FILE 15.8M RW- 2019-09-04 19:33:13 <NA> <NA> 2 EXCEL_SHE~ FILE 68.7K RW- 2019-09-21 23:00:40 <NA> <NA> ... WITH 11 MORE VARIABLES: DEVICE_ID <DBL>, HARD_LINKS <DBL>,
  • 2. SPECIAL_DEVICE_ID <DBL>, INODE <DBL>, BLOCK_SIZE <DBL>, BLOCKS <DBL>, FLAGS <INT>, GENERATION <DBL>, ACCESS_TIME <DTTM>, CHANGE_TIME <DTTM>, BIRTH_TIME <DTTM> Saving excel files as a list Below is a method for storing all excel files that have been imported as a list • pull the path from the xl_paths tibble using the pull function from dplyr • This will give the paths to excel sheets you want to import as a charater vector (XL_PATHS_CHR_VECTOR <- XL_PATHS %>% PULL(PATH) ) EXCEL_SHEETS/FACTORY.XLSX EXCEL_SHEETS/PREST_MEET.XLSX USE THESE PATHS AND APPLY MAP FUNCTION IN ORDER TO ITERATE THE READ_EXCEL FUNCTION OVER THE C HARACTER VECTOR THERE ARE MANY METHODS FOR ACHIEVING TE SAME RESULTS BUT I WILL USE AN ANONYMOUS FUNCTION: XL_PATHS_CHR_VECTOR %>% MAP( ~ READ_EXCEL(.)) %>% THIS WILL RETURN A LIST OF 2 LET'S GIVE THE SHEET THEIR ORIGINAL NAMES WITH THE SET_NAMES() FUNCTION SET_NAMES(XL_PATHS_CHR_VECTOR) $`EXCEL_SHEETS/FACTORY.XLSX` A TIBBLE: 275,415 X 15 SZFROM SZTO WEIGHT TRANSDATE TRANSTIME PN <CHR> <DBL> <DBL> <DTTM> <DTTM> <CHR> 1 <NA> NA 0 2019-09-04 00:00:00 2019-09-04 08:52:00 C340~ 2 <NA> NA 0 2019-09-04 00:00:00 2019-09-04 07:45:00 C340~ 3 <NA> NA 0 2019-09-04 00:00:00 2019-09-04 09:12:00 C340~ 4 <NA> NA 0 2019-09-04 00:00:00 2019-09-04 08:18:00 C340~ 5 <NA> NA 0 2019-09-04 00:00:00 2019-09-04 08:23:00 C340~ 6 <NA> NA 0 2019-09-04 00:00:00 2019-09-04 08:10:00 C340~ 7 <NA> NA 0 2019-09-04 00:00:00 2019-09-04 08:03:00 C340~ 8 <NA> NA 0 2019-09-04 00:00:00 2019-09-04 07:28:00 C340~ 9 <NA> NA 0 2019-09-04 00:00:00 2019-09-04 09:36:00 C340~ 10 <NA> NA 0 2019-09-04 00:00:00 2019-09-04 08:20:00 C340~ ... WITH 275,405 MORE ROWS, AND 9 MORE VARIABLES: PACKLINE <CHR>, MARKETVA <CHR>, VA <CHR>, BINNO <DBL>, BG <CHR>, FC <CHR>,
  • 3. `IF(BINTRANS.TRANSTIME>"06:00" AND BINTRANS.TRANSTIME<"18:30", "DAG", "NAG")` <CHR>, `DATE (IF (TRANSTIME>="00:00" AND TRANSTIME<"06:00" , TRANSDATE-1,TRANSDATE) )` <DTTM>, ...15 <LGL> $`EXCEL_SHEETS/PREST_MEET.XLSX` A TIBBLE: 205 X 18 DATE W_DAY WEEK_NUM MONTH_NUM `LINE 1_KG` `LINE 2_KG` <DTTM> <CHR> <DBL> <DBL> <CHR> <CHR> 1 2019-03-11 00:00:00 MON 11 3 32528.6999~ 37936.0999~ 2 2019-03-12 00:00:00 TUE 11 3 40674.9999~ 56930.3999~ 3 2019-03-13 00:00:00 WED 11 3 39505.1999~ 58524.5999~ 4 2019-03-14 00:00:00 THU 11 3 35589.3999~ 16834.2000~ 5 2019-03-15 00:00:00 FRI 11 3 22113.5999~ 12266.6000~ 6 2019-03-16 00:00:00 SAT NA NA NA NA 7 2019-03-17 00:00:00 SUN NA NA NA NA 8 2019-03-18 00:00:00 MON 12 3 34105.1999~ 18727.0999~ 9 2019-03-19 00:00:00 TUE 12 3 42978.0999~ 30003.3999~ 10 2019-03-20 00:00:00 WED 12 3 34028.4999~ 23582.4999~ ... WITH 195 MORE ROWS, AND 12 MORE VARIABLES: `LINE 3_KG` <CHR>, STD_CARTN <CHR>, SHIFT <CHR>, WORKERS_1 <CHR>, WORKERS_2 <CHR>, WORKERS_3 <CHR>, STD_CRTN_PACKER <CHR>, WEIGHT_WORK_HOUR <CHR>, `STD_CRTN PER MAN_HOUR` <CHR>, L1_WEIGHT_PACKER_SHIFT <CHR>, L2_WEIGHT_PACKER_SHIFT <CHR>, L3_WEIGHT_PACKER_SHIFT <CHR> Storing excel sheets as a nested data frame Admittedly, I prefer this method for two reasons: • It’s less coding • It keeps everything organized in a tabular fashion (Notice the type is ) XL_PATHS %>% SELECT ONLY THE PATH COLUMN SELECT(PATH) A TIBBLE: 2 X 1 PATH <FS::PATH> 1 EXCEL_SHEETS/FACTORY.XLSX 2 EXCEL_SHEETS/PREST_MEET.XLSX XL_PATHS %>% SELECT ONLY THE PATH COLUMN SELECT(PATH) %>%
  • 4. CREATE A NEW COLUMN CALLED DATA AND POPULATE IT WITH THE EXCEL SHEETS USING THE MAP FUNCT ION MUTATE(DATA = PATH %>% MAP(READ_EXCEL)) A TIBBLE: 2 X 2 PATH DATA <FS::PATH> <LIST> 1 EXCEL_SHEETS/FACTORY.XLSX <TIBBLE [275,415 X 15]> 2 EXCEL_SHEETS/PREST_MEET.XLSX <TIBBLE [205 X 18]> Reading every sheet of an excel file You can also use the map function to read in every single sheet into R LIST ALL THE SHEETS NAMES WITH READ::XLEXCEL_SHEETS() (SHEET_NAMES <- EXCEL_SHEETS('EXCEL_SHEETS/PREST_MEET.XLSX')) [1] "FORMULAS" "DAILY" "WEEKLY" "MONTHLY" SHEET_NAMES %>% MAP( ~ READ_EXCEL(PATH = 'EXCEL_SHEETS/PREST_MEET.XLSX',SHEET = .)) %>% GIVE THE LIST THE NAMES OF THE SHEETS SET_NAMES(SHEET_NAMES) $FORMULAS A TIBBLE: 205 X 18 DATE W_DAY WEEK_NUM MONTH_NUM `LINE 1_KG` `LINE 2_KG` <DTTM> <CHR> <DBL> <DBL> <CHR> <CHR> 1 2019-03-11 00:00:00 MON 11 3 32528.6999~ 37936.0999~ 2 2019-03-12 00:00:00 TUE 11 3 40674.9999~ 56930.3999~ 3 2019-03-13 00:00:00 WED 11 3 39505.1999~ 58524.5999~ 4 2019-03-14 00:00:00 THU 11 3 35589.3999~ 16834.2000~ 5 2019-03-15 00:00:00 FRI 11 3 22113.5999~ 12266.6000~ 6 2019-03-16 00:00:00 SAT NA NA NA NA 7 2019-03-17 00:00:00 SUN NA NA NA NA 8 2019-03-18 00:00:00 MON 12 3 34105.1999~ 18727.0999~ 9 2019-03-19 00:00:00 TUE 12 3 42978.0999~ 30003.3999~ 10 2019-03-20 00:00:00 WED 12 3 34028.4999~ 23582.4999~ ... WITH 195 MORE ROWS, AND 12 MORE VARIABLES: `LINE 3_KG` <CHR>, STD_CARTN <CHR>, SHIFT <CHR>, WORKERS_1 <CHR>, WORKERS_2 <CHR>, WORKERS_3 <CHR>, STD_CRTN_PACKER <CHR>, WEIGHT_WORK_HOUR <CHR>, `STD_CRTN PER MAN_HOUR` <CHR>, L1_WEIGHT_PACKER_SHIFT <CHR>, L2_WEIGHT_PACKER_SHIFT <CHR>, L3_WEIGHT_PACKER_SHIFT <CHR>
  • 5. $DAILY A TIBBLE: 205 X 16 DATE W_DAY `LINE 1_KG` `LINE 2_KG` `LINE 3_KG` STD_CARTN <DTTM> <CHR> <CHR> <CHR> <CHR> <CHR> 1 2019-03-11 00:00:00 MON 32528.6999~ 37936.0999~ 58170.9999~ 10291 2 2019-03-12 00:00:00 TUE 40674.9999~ 56930.3999~ 31380.5999~ 10319 3 2019-03-13 00:00:00 WED 39505.1999~ 58524.5999~ 28169.0999~ 10096 4 2019-03-14 00:00:00 THU 35589.3999~ 16834.2000~ 59225.0999~ 8932 5 2019-03-15 00:00:00 FRI 22113.5999~ 12266.6000~ 45154.3999~ 6363 6 2019-03-16 00:00:00 SAT NA NA NA NA 7 2019-03-17 00:00:00 SUN NA NA NA NA 8 2019-03-18 00:00:00 MON 34105.1999~ 18727.0999~ 58628.3999~ 8917 9 2019-03-19 00:00:00 TUE 42978.0999~ 30003.3999~ 60483.6999~ 10678 10 2019-03-20 00:00:00 WED 34028.4999~ 23582.4999~ 58484.4999~ 9288 ... WITH 195 MORE ROWS, AND 10 MORE VARIABLES: SHIFT <CHR>, WORKERS_1 <CHR>, WORKERS_2 <CHR>, WORKERS_3 <CHR>, STD_CRTN_HOUR <CHR>, WEIGHT_WORK_HOUR <CHR>, `STD_CRTN PER MAN_HOUR` <CHR>, L1_WEIGHT_PACKER_SHIFT <CHR>, L2_WEIGHT_PACKER_SHIFT <CHR>, L3_WEIGHT_PACKER_SHIFT <CHR> $WEEKLY A TIBBLE: 25 X 15 WEEK_NUM `LINE 1_KG` `LINE 2_KG` `LINE 3_KG` STD_CARTN SHIFT WORKERS_1 <DBL> <DBL> <DBL> <DBL> <DBL> <DBL> <DBL> 1 11 170412. 182492. 222100. 46001 45 64 2 12 132911. 84820. 220912. 35093 38 58 3 13 125797. 89689. 219380. 34791 45 57 4 14 150072. 137770. 252678. 43244 45 64 5 15 143723. 118420. 275909. 43046 45 65 6 16 112790. 93831. 219896. 34122 38 56 7 17 96847. 79931. 208532. 30827 35.5 56 8 18 94577. 72048. 199143. 29263 38 61 9 19 78358. 87057. 186245. 28135 35.5 61 10 20 173836. 59652. 235529. 37524 45 71 ... WITH 15 MORE ROWS, AND 8 MORE VARIABLES: WORKERS_2 <DBL>, WORKERS_3 <DBL>, STD_CRTN_PACKER <DBL>, WEIGHT_WORK_HOUR <DBL>, `STD_CRTN PER MAN_HOUR` <DBL>, L1_WEIGHT_PACKER_SHIFT <DBL>, L2_WEIGHT_PACKER_SHIFT <DBL>, L3_WEIGHT_PACKER_SHIFT <DBL>
  • 6. $MONTHLY A TIBBLE: 6 X 15 MONTH_NUM `LINE 1_KG` `LINE 2_KG` `LINE 3_KG` STD_CARTN SHIFT WORKERS_1 <DBL> <DBL> <DBL> <DBL> <DBL> <DBL> <DBL> 1 3 429120. 357000. 662393. 115885 128 179 2 4 555377. 468461. 1052067. 166080 182. 270 3 5 469177. 388926. 1035392. 151491 190. 387 4 6 455030. 377497. 800238. 130631 170. 307 5 7 432560. 439760. 905410. 142227 164. 276 6 8 597778. 671961. 1162558. 194595 190. 390 ... WITH 8 MORE VARIABLES: WORKERS_2 <DBL>, WORKERS_3 <DBL>, STD_CRTN_PACKER <DBL>, WEIGHT_WORK_HOUR <DBL>, `STD_CRTN PER MAN_HOUR` <DBL>, L1_WEIGHT_PACKER_SHIFT <DBL>, L2_WEIGHT_PACKER_SHIFT <DBL>, L3_WEIGHT_PACKER_SHIFT <DBL>