1. This work was supported by the National Science
Foundation
Grant #0227577, 9986821, 0425826, 1349692, 1451213
Analog Filter Design for Brain Signal Measurements
Emily O’Neill, Cardinal Spellman High School
Cameron Young, Medfield High School
Mahmoud Ayman Ahmed Ibrahim, Doctoral Student, Northeastern University
Professor Marvin Onabajo, Department of Electrical and Computer Engineering, Northeastern University
Abstract
In order to measure brain signals, filters are required to attenuate
the noise or interference from outside power sources. The goal
of the project was to develop a way to automatically calibrate the
notch of the filter by manipulating the level of capacitance in the
circuit. The Arduino microcontroller platform was chosen to
develop the software of the calibration system. A latch and
comparator were required to process the filter’s output and
produce a digital signal that the Arduino can analyze. After
researching and testing the most promising strategies, hardware
and software were realized. All of the elements were effectively
constructed, and the results showed that this system is a viable
option to automatically calibrate the filter. Based on the
evaluations, the calibration system is expected to function well
after integration with the filter, but further testing is required to
ensure proper operation.
Background
Electroencephalography (EEG) systems monitor activities in the
brain by recording electrical signals. As the only non-invasive
method for measuring brain activities, it plays an important role in
many applications. A Self-Calibrated Analog Front-End for Long
Acquisitions of Biosignals (SCAFELAB) chip approves upon EEG
systems and uses desirable dry-contact electrodes. Some
applications for this system include: Epilepsy diagnosis and seizure
alert, control of assistive robotic technologies, intent recognition for
communication assistance, and drowsiness detection for operators
of vehicles.
Fig. 1: Diagram of the SCAFELAB chip.
Since brain signals have such a low voltage, interference from a
common wall outlet makes them difficult to measure. Brain signals
of interest occur at frequencies of less than 40Hz, therefore, a
low-pass notch filter (LPNF) is used to attenuate the higher
frequencies of the wall outlet, while allowing the brain signals to
pass. In order for the signal from the wall to be completely blocked,
the notch of the LPNF must fall at 60Hz. The notch of an LPNF is
the frequency at which the filter strongly attenuates the signal.
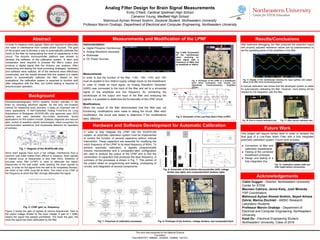
Fig. 2: LPNF gain vs. frequency.
Figure 2 shows the gain of signals at various frequencies. Gain is
the output voltage divided by the input voltage. A gain of 1 (0dB)
means the signal has passed uninhibited. The lower the gain, the
more the signal has been attenuated by the filter.
Measurements and Modification of the LPNF
Instrumentation:
● Digital Phosphor Oscilloscope
● Analog Waveform Generator
● Multimeter
● DC Power Sources
Hardware and Software Development for Automatic Calibration
Results/Conclusions
After extensive debugging, the filter produced the expected output
with properly adjusted resistance values (set by potentiometers) to
set the operating points of the amplifiers in the filter.
A manual calibration test shows that the developed system is viable
for automatically calibrating the filter. However, more testing will be
needed for full integration with the filter.
Acknowledgements
Claire Duggan - Director, Northeastern University
Center for STEM
Maureen Cabrera, Jenna Kiely, Josh Miranda -
YSP Coordinators
Mahmoud Ayman Ahmed Ibrahim, Seyed Alireza
Zahrai, Marina Zlochisti - AMSIC Research
Laboratory Students
Professor Marvin Onabajo - Department of
Electrical and Computer Engineering, Northeastern
University
Kaidi Du - Electrical Engineering Student,
Northeastern University, Class of 2016
Fig. 5: Schematic of the Low-Pass Notch Filter (LPNF).
Fig. 4: Prototype of the LPNF on a breadboard.
Each black rectangular chip houses two
Operational Transconductance Amplifiers
(OTAs).
Fig. 3 (left): Screenshot
of the oscilloscope
when receiving an
input signal with a
frequency of 60Hz and
an amplitude of 100mV.
Fig. 6: Schematic of the Arduino microcontroller (left), voltage
divider (top right), and comparator/latch (bottom right).
In order to fully integrate the LPNF into the SCAFELAB
system, an automatic calibration system must be implemented
to control the function of several capacitors without manual
intervention. These capacitors are essential for modifying the
notch frequency of the LPNF to its ideal frequency of 60Hz. To
achieve automatic calibration, a digitally programmable
Arduino microcontroller and a comparator-latch configuration
are used to analyze the output of the LPNF and to find the
combination of capacitors that produces the ideal frequency. A
summary of the processes is shown in Fig. 7. This portion of
the project relied on programming and testing, prototyping of
circuits, and integration of several components.
Measurements:
In order to test the function of the filter, +18V, -18V, +15V, and -15V
must be applied to four distinct supply voltage inputs on the breadboard.
In order to create an input signal, an Analog Waveform Generator
(AWG) was connected to the input of the filter and set to a sinusoidal
signal of low amplitude and low frequency. By connecting the
oscilloscope at the output and input of the filter and analyzing the
signals, it is possible to determine the functionality of the LPNF circuit.
Modifications:
When the output of the filter demonstrated that the filter was not
functioning, modifications were made to debug the circuit. After each
modification, the circuit was tested to determine if the modifications
were effective.
Fig. 7: Flowchart of calibration processes.
This project will require further work in order to achieve the
final goal of a Low-Pass Notch Filter with a fully integrated
automatic calibration system. Future work includes:
Future Work
● Connection of filter and
calibration breadboards
● Testing of the combined
breadboard prototype
● Design and testing of a
fully integrated chip
Fig. 8: Prototype of the Arduino, voltage dividers, and comparator/latch.
Fig. 12: Calibration system (left) and
filter (right) before connections.
Fig. 9: Display of the oscilloscope showing the input (yellow) and output
(blue) of the filter when functioning properly.
Fig. 10: Prior to manual calibration test. Fig. 11: After manual calibration test.