Recommended

Recommended
More Related Content
What's hot
What's hot (20)
Similar to Anthropometric Measurements of Philadelphia 4th Graders
Similar to Anthropometric Measurements of Philadelphia 4th Graders (20)
Recently uploaded
Recently uploaded (20)
Anthropometric Measurements of Philadelphia 4th Graders
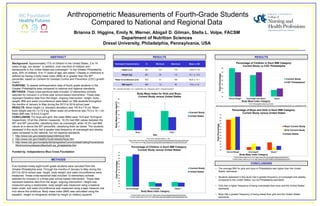
- 1. Anthropometric Measurements of Fourth-Grade Students Compared to National and Regional Data Brianna D. Higgins, Emily N. Werner, Abigail D. Gilman, Stella L. Volpe, FACSM Department of Nutrition Sciences Drexel University, Philadelphia, Pennsylvania, USA Background: Approximately 17% of children in the United States, 2 to 19 years of age, are obese1. In addition, over one-third of children and adolescents in the Unites States are overweight.2 In the Greater Philadelphia area, 20% of children, 6 to 17 years of age, are obese.3 Obesity in childhood is defined as having a body mass index (BMI) at or greater than the 95th percentile, based on Centers for Disease Control and Prevention (CDC) growth charts.1 PURPOSE: To assess anthropometric data of fourth grade students in the Greater Philadelphia area compared to national and regional standards. METHODS: These cross-sectional data included 12 elementary schools selected for inclusion in a three-year school-based intervention. These data represent baseline data from the larger, ongoing intervention. Height, body weight, BMI and waist circumference were taken on 598 students throughout the months of January to May during the 2013 to 2014 school year. RESULTS: Mean height (± standard deviation) was 140.8±7.8 cm. Mean body weight was 43.1±13.5 kg. Mean waist circumference was 70.0±14.1 cm. Mean BMI was 19.8±4.5 kg/m2. CONCLUSION: For boys and girls, the mean BMIs were 19.6 and 19.9 kg/m2, respectively. Of all the children measured, 18.3% had BMI values between the 85th and 95th percentile, classifying them as overweight; while 18.2% had BMI values at or above the 95th percentile, classifying them as obese. The students assessed in this study had a greater total frequency of overweight and obesity rates compared to the national, but not regional standards. 1. http://www.cdc.gov/obesity/data/childhood.html 2. http://www.cdc.gov/HealthyYouth/obesity/facts.htm 3. http://www.cdc.gov/nccdphp/dch/programs/CommunitiesPuttingPreventionto Work/communities/profiles/both-pa_philadelphia.htm Funded by: Independence Blue Cross Foundation Five hundred ninety-eight fourth grade students were recruited from the Greater Philadelphia area. Through the months of January to May during the 2013 to 2014 school year, height, body weight, and waist circumference were measured. These cross-sectional data included 12 elementary schools selected for inclusion in a three-year school-based intervention. These data represent baseline data from the larger, ongoing intervention. Height was measured using a stadiometer, body weight was measured using a balance beam scale, and waist circumference was measured using a tape measure one inch above the umbilicus. Body mass index (BMI) was calculated using the equation, weight (in kilograms) divided by height (in meters) squared. * ** Participant Characteristics N Minimum Maximum Mean ± SD Height (cm) 561 121 170 140.8 ± 7.6 Weight (kg) 561 20 113 43.1 ± 13.5 Waist Circumference (cm) 553 51 165 69.9 ± 14.1 BMI (kg/m2) 560 12 45 19.8 ± 4.5 SD = standard deviation; cm = centimeters; kg = kilograms; kg/m2 = kilograms/meters2 10 15 20 25 30 35 40 45 50 55 60 65 70 Normal Weight Overweight* Obese** TotalPercentage Body Mass Index Category Percentage of Boys and Girls in Each BMI Category: Current Study versus United States Boys Current Study Girls Current Study United States *United States data found from http://www.cdc.gov/obesity/data/childhood.html **United States data found from http://www.cdc.gov/HealthyYouth/obesity/facts.htm 10 12 14 16 18 20 22 24 26 Boys* Girls** BodyMassIndex(kg/m2) Sex Body Mass Index for Girls and Boys: Current Study versus United States Current Study United States Error bars represent Mean ± SD *Boys data found from http://www.cdc.gov/growthcharts/data/set1clinical/cj41l023.pdf **Girls data found http://www.cdc.gov/growthcharts/data/set1clinical/cj41l023.pdf 10 15 20 25 30 35 40 45 Normal Weight Overweight and Obese Obese TotalPercentage Body Mass Index Category Percentage of Children in Each BMI Category: Current Study vs CDC Philadelphia Current Study CDC Philadelphia* *United States data found from http://www.cdc.gov/obesity/data/childhood.html **United States data found from http://www.cdc.gov/HealthyYouth/obesity/facts.htm 10 15 20 25 30 35 40 45 50 55 60 65 70 Normal Weight Overweight* Obese** TotalPercentage Body Mass Index Category Percentage of Children in Each BMI Category: Current Study versus United States Current Study United States • The average BMI for girls and boys in Philadelphia was higher than the United States’ standards • Students assessed in this study had a greater frequency of overweight and obesity compared to the United States, but not Philadelphia standards • Girls had a higher frequency of being overweight than boys and the United States’ standards • Boys had a greater frequency of being obese than girls and the United States’ standards *CDC Philadelphia data found from http://www.cdc.gov/nccdphp/dch/programs/CommunitiesPuttingPreventiontoWork/communities/profiles/both-pa_philadelphia.htm