Assignment needs to make sure it relates to this week’s readings a.docx
How Supermarkets Can Drive Satisfaction, Spending & Loyalty
1. W
hen it comes to supermarket
shopping, people have firm
opinions on how well a store
is doing in meeting their needs,
where it may be falling short or if
it is exceeding expectations. After
all, most shoppers have numerous
choices, shop often and what is more
important than the food we eat!
The Retail Feedback Group (RFG)
conducts an annual survey, now in its
ninth year, with 1,200 supermarket
shoppers across the United States to
help provide retailers with the latest
consumer ratings.
Shoppers continue to divide their
shopping across an ever-increasing
number of different formats and
channels. As a result, many people
shop at more stores and shop less
frequently at just one supermarket.
This places enormous pressure on
growing the basket size each time a
shopper visits our stores.
For years, our study has docu-
mented that satisfied shoppers are
higher spending and display greater
loyalty to the store over time. Experi-
ence has always been important, but
is crucial in today’s environment.
Supermarket Report Card
When we look at how
supermarkets perform, we focus
on the core pillars of quality,
variety, service and value. For each
pillar there is one or more key
questions answered by shoppers,
on a five-point scale, that help us
measure performance. So how did
supermarkets fare in 2016?
The top scoring areas for
supermarkets were quality and
freshness of food and groceries,
as well as store cleanliness inside
and out, followed by item variety
and selection.
Factors with
mid-range scores
from shoppers
were associate
friendliness/attitude
and checkout speed/
efficiency.
Areas where
supermarkets
received the
lowest scores
from shoppers
were associate
helpfulness/
knowledge,value for
money spent, and
associate availability.
Satisfaction
Declinesasthe
DayProgresses
With the
exception of a slight
uptick in overall trip
satisfaction from 11
a.m. – 3 p.m., all of
the individual core
experience factors
show a decline
in ratings as the
day progresses.
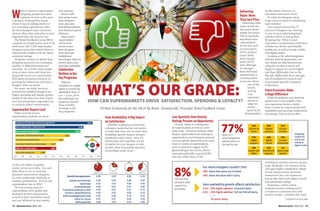
WHAT’S OUR GRADE:HOW CAN SUPERMARKETS DRIVE SATISFACTION, SPENDING & LOYALTY?
Written Exclusively for the MGA By Brian Numainville, Principal, Retail Feedback Group
Item Availability: A Big Impact
on Satisfaction
Whether it pertains to items that
a shopper wants that are not carried
or items that were out-of-stock, item
availability greatly impacts shopper
satisfaction with a store. And, if a
desired item isn’t available, it is an
invitation for your shopper to visit
another store to purchase that item
and perhaps many more!
Low Specialty ItemVariety
Ratings Present an Opportunity
Overall, variety is a strong area
for supermarkets at 4.43 on a five-
point scale. However, looking a little
deeper, supermarkets are missing an
opportunity to meet shopper demand
in some specific areas that score much
lower in variety at supermarkets,
such as natural & organic (4.09),
gluten/allergen-free (4.01), ethnic/
international/locally-sourced (4.00)
and non-GMO items (3.93).
Delivering
Value: More
Than Just Price
Delivering value
helps elevate the
discussion above
simply low prices.
This is especially
important since
supermarkets
do not fare well
on meat prices
(4.01), produce
prices (4.06),
and everyday
prices (4.07).
And, although
it’s stronger
than individual
departments or
everyday prices,
as we saw above,
one of the
lowest
scoring
core
experience
factors is
value for
money
spent (4.27).
Supermarkets
do fare better, however, on
advertised sales items (4.41).
So what are shoppers using
today when it comes to advertising/
sales vehicles?
Our research shows that 77
percent of shoppers are referring
to one or more advertising/sales
vehicles before or during their
shopping trip. What is most
important to understand is that these
vehicles are diverse and straddle
traditional, as well as social, mobile
and digital media.
Looking at the advertising/sales
vehicles used by generation, one
can clearly see that Boomers are
using the circular at home and
clipped coupons at a much higher
rate than Millennials, but on the
flip side, Millennials show stronger
use of smartphone research and
social media specials compared
to Boomers.
Store Associates Make
a Huge Difference
While friendliness and checkout
speed score in the middle of the
core experience factors, clearly
there is room for improvement with
availability and associate helpfulness/
knowledge. And we know that
excelling at customer service can pay
huge dividends. For instance, those
who gave higher satisfaction ratings
on the various service elements
measured in the core experience
factors also had much higher overall
trip satisfaction ratings.
Fostering a culture where
employees enjoy working and it
is evident to customers can yield
positive results. Consider that when
Continued on next page
12 Minnesota Grocer Winter 2016 Minnesota Grocer Winter 2016 13