2. 860
are at least partially mediated by alterations in feeding behavior and
triglyceride storage (Lee et al., 2008; Skorupa et al., 2008). The
effects of dietary composition on endurance capacity and other
parameters related to vigor have not been tested in the fly model.
Here, we exposed flies of two different genetic backgrounds to
diets of varying concentrations of sucrose and yeast. The impact of
dietary composition on induced negative geotaxis speed, fatigue
tolerance, cardiac stress resistance and feeding behavior is presented.
In addition, cardiac muscle was used as a model to detect trends in
lipid accumulation and autophagy levels during aging.
We found a general trend toward protective effects of balanced,
low-calorie diets on most parameters, while, within unbalanced diets,
diets high in sucrose promote high endurance and speed, but impair
cardiac performance.
MATERIALS AND METHODS
Fly stocks, diets and husbandry
Drosophila melanogaster (Canton S and Berlin K) larvae were
reared on a standard laboratory diet containing 10% sucrose, 10%
brewer’s yeast and 2% agar (10S/10Y). Male flies age matched
within 48h were collected under light CO2 anesthesia, allowed to
recover for 24h in vials containing standard food, and then
transferred to vials containing one of 10 experimental treatment diets
at a density of 20 flies per vial. The experimental diets were created
by manipulating the nutrient quantities from our standard laboratory
10S/10Y diet. Sucrose and yeast have been estimated to contain
roughly the same number of calories/gram (Mair et al., 2005). Diets
maintained an equal ratio of sucrose and yeast while altering total
calorie content, maintained sucrose content at 10% while varying
the amount of yeast, or maintained yeast content at 10% while
varying the amount of sucrose. Unbalanced diets that had a higher
concentration of sucrose were classified as having a ‘high
sucrose/yeast ratio’, while those with a higher concentration of yeast
were referred to as ‘low sucrose/yeast ratio’ diets. Throughout the
experimental time course, flies were kept at 25°C and 50% humidity
with a 12h:12h light/dark cycle. Vials of fresh food were provided
every 2 or 3days for the entire experimental duration.
Negative geotaxis assay
Fly climbing speed was assessed using the rapid iterative negative
geotaxis (RING) technique described previously (Gargano et al.,
2005), with a starting sample size of approximately N=100 flies.
The RING assay measures the average height climbed by a cohort
of flies in a given time period following induction of the negative
geotaxis behavior. Flies from each diet treatment were subjected to
the RING assay five times per week for a 5week time course. For
each cohort, flies were transferred to polypropylene vials in groups
of 20 per vial. The vials were quickly tapped four times to knock
flies to the bottom and induce the negative geotaxis response; a
photograph was taken after flies had been allowed to climb for 2s.
This procedure was carried out four consecutive times. The average
distance climbed by flies in a given picture was calculated by taking
the mean of the vials in that picture, and the daily average climbing
distance was calculated by averaging the four picture means
together. The images were analyzed using image processing software
and the raw data converted into quadrants using Microsoft Excel.
Each of the four vial quadrants is equivalent in height, and each fly
was assigned a score based on the quadrant ascended to after 2s.
Flies that climbed to the highest quadrant received a score of 4,
flies in the next highest quadrant received a score of 3, and so on.
Flies that did not climb off the bottom of the vial were assigned a
quadrant score of 0. The calculated daily quadrant averages were
charted to assess the decline in climbing ability with age. Negative
geotaxis results were analyzed using either one-way ANOVA
analysis with post hoc Bonferroni multiple comparison tests or
multivariate regression (supplementary material TableS1) in JMP
(SAS Institute Inc., Cary, NC, USA). Genotype comparisons were
also performed using standard least-squares regression.
The Journal of Experimental Biology 216 (5)
Timetofatigue(min)
0
100
200
300
400
500
2.5S/2.5Y
5S/5Y
10S/10Y
20S/20Y
* *
D
2.5S/10Y
5S/10Y
10S/20Y
*
E
10S/2.5Y
10S/5Y
20S/10Y
* *
F
*
B
*
C
0
100
200
300
400
500
Canton S
Berlin K * *
A
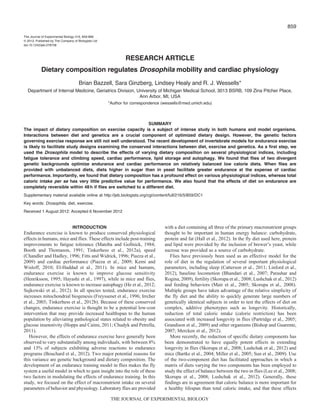
Fig.1. Dietary composition alters endurance in 3day old wild-type flies. Following eclosion, male age-matched Berlin K and Canton S flies were fed one of
10 diets for the remainder of their life. The average time to exhaustion for each cohort is presented as a histogram. Data are presented as means and
s.e.m. Berlin K (A–C) and Canton S (D–F) flies were tested for endurance on diets with an equal (A,D), low (B,E) or high (C,F) sucrose/yeast (S/Y) ratio.
Canton S flies have greater endurance than Berlin K flies, independent of diet (log-rank: P<0.0001). Regardless of genotype, flies fed balanced low calorie
diets run significantly longer than siblings fed balanced high calorie diets (log-rank analysis: asterisk indicates significant difference of P<0.05 compared with
10S/10Y). Among unbalanced diets, flies eating food with a high sucrose/yeast ratio have higher endurance than those consuming diets with a low
sucrose/yeast ratio (log-rank analysis: asterisk indicates P<0.05 for all significant differences). Average fatigue time and full statistical analyses for each diet
are presented in supplementary material TableS1. Data are also presented in ʻrunspanʼ form in supplementary material Fig.S1.
THE JOURNAL OF EXPERIMENTAL BIOLOGY
3. 861Diet regulates exercise physiology
Endurance assay
Climbing endurance was measured using the fatigue assay
described previously (Tinkerhess et al., 2012a). Eight vials of flies
from each diet treatment were subjected to the fatigue assay at
two time points: once in the first week of life (day3), and once
in the fourth week of life (day26). For each assessment, the flies
were placed on the Power Tower exercise machine (see Results)
and made to climb until they were fatigued, or no longer responded
to the negative geotaxis stimulus. Monitored at 10min intervals,
a vial of flies was visually determined to be fatigued when five
or fewer flies could climb higher than 2in (50.8mm) after four
consecutive drops. The time from the start of the assay to the time
of fatigue was recorded for each vial, and the data analyzed using
log-rank analysis in JMP; genotypes were also compared by log-
rank analysis.
Electrical pacing
Flies were subjected to electrical pacing, as described elsewhere
(Wessells et al., 2004), in order to assess heart performance in the
fourth week of life. Flies were immobilized and placed between
two electrodes lined with conductive electrolyte jelly. The hearts
were paced using a square-wave stimulator set at 40V and 6Hz for
30s, and then visually assessed for recovery or failure, defined as
either fibrillation or arrest. The percentage of fly hearts that failed
was recorded immediately after pacing. Sample sizes ranged from
N=50 hearts for Berlin K cohorts, to approximately N=100 hearts
for Canton S groups (for exact N values, see supplementary material
TableS1). Results were analyzed via standard least-squares
regression using JMP. Genotype comparisons were also performed
using standard least-squares regression.
Oil Red O staining
Four week old flies were dissected ventral side up in phosphate-
buffered saline (PBS) at room temperature. After exposing the heart
and removing any excess fat, partially dissected flies were rinsed
three times with PBS and then fixed in 4% paraformaldehyde/PBS
for 10min. Following fixation, dissected samples were rinsed three
times with PBS. Oil Red O (Sigma-Aldrich, St Louis, MO, USA),
diluted 1:100 in isopropanol, was applied to the exposed hearts for
20min at room temperature. After staining, hearts were rinsed three
times with dH2O, removed, and mounted on slides in one drop of
antifade solution (Molecular Probes, Eugene, OR, USA). Slides were
imaged on an Olympus BX41 compound fluorescence microscope
(Olympus, Center Valley, PA, USA) using a 40× objective and the
obtained images analyzed using ImageJ. A minimum of five
samples were analyzed per diet treatment. Data were analyzed by
one-way ANOVA, with post hoc Tukey–Kramer tests using Prism
(GraphPad Software, San Diego, CA, USA). Genotypes were
compared using two-way ANOVA.
LysoTracker staining
Four week old flies were dissected as for Oil Red O staining with
the following changes: following dissection in PBS, hearts and fat
bodies were rinsed three times with PBS and then immediately
stained with LysoTracker Green (Molecular Probes), diluted to
0.01mmoll–1
in PBS, for 1min. Samples were washed three times
with PBS and then removed and mounted as above. Imaging and
data analysis were performed exactly as described in the Oil Red
O protocol.
Feeding rate
Ten day old flies were lightly anesthetized with CO2 and separated
into vials of five flies, 24h before the start of the experiment. Vials
were placed in a randomized order for unbiased scoring, and allowed
to acclimatize for 30min following transfer to avoid disturbance of
the fly feeding behavior. Each vial was observed for ~3s and the
number of flies feeding was recorded. Proboscis extension into the
food accompanied by a bobbing motion was scored as a feeding
Timetofatigue(min)
0
50
100
150
200
2502.5S/2.5Y
5S/5Y
10S/10Y
20S/20Y
*
**
E FD
*
*
*
**
*
*
Canton S
Berlin K
B C
0
50
100
150
200
250 A
2.5S/10Y
5S/10Y
10S/20Y
10S/2.5Y
10S/5Y
20S/10Y
Fig.2. Effect of diet on endurance persists during aging. Experimental flies from Fig.1 were aged to 26days (3weeks) and then remeasured. The average
time to exhaustion for each cohort is presented as a histogram (A,D equal S/Y; B,E, low S/Y; C,F, high S/Y ratio). Data are presented as means and s.e.m.
Twenty-six day old Berlin K (A–C) and Canton S (D–F) flies exhibit the same trends as when they were 3days old. Flies from all cohorts declined with age.
When compared with Canton S, Berlin K flies have more endurance at advanced ages (log-rank: P=0.0123). Independent of genotype, flies fed balanced
low calorie diets continue to run longer than those fed balanced high calorie diets (log-rank analysis: asterisk indicates P<0.05 compared with 10S/10Y).
When unbalanced diets were used, flies eating food with a high sucrose/yeast ratio continue to resist fatigue better than flies eating low sucrose/yeast ratio
food (log-rank analysis: asterisk indicates P<0.05 for all significant differences). Average fatigue time and full statistical analyses for each diet are presented
in supplementary material TableS1. Data are also presented in ʻrunspanʼ form in supplementary material Fig.S2.
THE JOURNAL OF EXPERIMENTAL BIOLOGY
4. 862
event (see Wong et al., 2009). Ten trials were performed, such that
each vial was observed approximately every 2–5min. The assay
was repeated at the same time the following day. The feeding data
were expressed as the sum of feeding events divided by the sum of
feeding opportunities (number of flies in vial × number of vials in
group × number of observations) for each individual day. In order
to control for differences in bite size between the genotypes, a blue
dye feeding rate experiment was also performed. Groups of five
flies were transferred to fresh food containing 2.5% (w/v) blue food
dye (FD&C Blue no. 1, Spectrum Chemical Manufacturing Corp.,
Gardena, CA, USA); a control group was transferred to fresh food
containing 10S/10Y to account for absorbance by standard diet food.
Vials were observed according to the proboscis extension assay
procedure and then transferred to 0.5ml centrifuge tubes and flash-
frozen in liquid nitrogen. Flies were homogenized in 250μl of
distilled water and centrifuged according to a procedure outlined
previously (Vijendravarma et al., 2012). The relative amount of dye
ingested was quantified at 630nm with background optical density
subtracted. As bite sizes were not significantly different, proboscis
extension results were analyzed by one-way ANOVA, with post
hoc Tukey–Kramer tests using Prism. Genotypes were compared
using two-way ANOVA.
Relative caloric intake was calculated by multiplying the caloric
content of the food by the number of observed proboscis extensions
and the amount of dye ingested per proboscis extension (referred to
as ‘bite’ size). Multinomial regression was used to estimate the
percentage of variance that can be explained by relative caloric intake.
RESULTS
Experimental design
Flies from two different genetic backgrounds, Berlin K and Canton
S, were collected, age matched, allowed to recover for 24h, then
placed on one of 10 different diets. These two genotypes were chosen
because they represent commonly used laboratory wild-type stocks
with divergent backgrounds.
The diets chosen were selected to address two distinct issues: (1)
the role of caloric amount in the impact of diet, and (2) the role of
the distribution and composition of calories in the impact of diet.
The diets chosen can be grouped into three categories: (1) sucrose
and yeast present in equal amounts, (2) high sucrose/yeast ratio and
(3) low sucrose/yeast ratio.
Fatigue tolerance
Flies from each diet/genotype combination were aged to 3days and
then tested for fatigue tolerance. Flies were divided into groups of
20, then placed on an automated negative geotaxis-inducing
machine, known as the Power Tower (Piazza et al., 2009; Tinkerhess
et al., 2012a) until such time as fewer than five flies per vial were
able to climb above a 2in (50.8mm) mark on the machine. At this
time, the vial was considered fatigued, and removed from the
machine. Fig.1 plots the average time of removal of vials from each
cohort as a histogram.
There was a general trend for Canton S flies to run longer before
fatiguing than Berlin K flies, regardless of diet (compare Fig.1D–F
and Fig.1A–C). The reasons for higher fatigue tolerance in this
background are as yet unclear. However, the effect of diet on fatigue
tolerance within each genotype was remarkably similar. In both
backgrounds, balanced low-calorie diets promoted increased fatigue
tolerance (Fig.1A,D). In both backgrounds, diets with a high
sucrose/yeast ratio promoted higher fatigue tolerance (Fig.1C,F) than
did diets with a low sucrose/yeast ratio (Fig.1B,E). Within diets
with unbalanced calorie sources, diets with higher total caloric
content trended toward higher fatigue tolerance (Fig.1B,C,E,F).
In order to find out whether long-term effects of dietary intake
were similar to acute effects, we kept all cohorts of flies on the
same diet for 3weeks and then measured fatigue tolerance again.
Three weeks of age is old enough for wild-type flies to display a
significant age-related decline in climbing speed (Gargano et al.,
2005; Piazza et al., 2009) and in fatigue tolerance (Tinkerhess et
al., 2012a). As dietary intake has been proposed to have profound
The Journal of Experimental Biology 216 (5)
Quadrant
0
1
2
3 D
0
1
2
3 A
E
B
F
C
Canton S
Berlin K
0 10 20 30 40 0 10 20 30 40 0 10 20 30 40
Day
2.5S/2.5Y
5S/5Y
10S/10Y
20S/20Y
2.5S/10Y
5S/10Y
10S/20Y
10S/2.5Y
10S/5Y
20S/10Y
2.5S/2.5Y
5S/5Y
10S/10Y
20S/20Y
2.5S/10Y
5S/10Y
10S/20Y
10S/2.5Y
10S/5Y
20S/10Y
Fig.3. Dietary composition makes small, but significant, changes in climbing speed. Age-matched Berlin K and Canton S males were fed one of 10 diets for
their entire life (A,D, equal S/Y; B,E, low S/Y; C,F, high S/Y ratio). For each diet, the mean climbing height is expressed as the average quadrant that the
flies were able to climb to in 2s (climbing index). Climbing indexes are plotted over a 5week time course. Berlin K (A–C) and Canton S (D–F) flies fed
unbalanced diets climb slightly faster than those fed balanced diets (one-way ANOVA with post hoc Bonferroni multiple comparison tests: P<0.01). Between
genotypes, Berlin K flies climb significantly faster than Canton S flies (standard least-squares regression, P<0.0001). Full statistical analyses for each diet
are presented in supplementary material TableS1.
THE JOURNAL OF EXPERIMENTAL BIOLOGY
5. 863Diet regulates exercise physiology
effects on the rate of normal aging (Partridge et al., 2005; Simpson
and Raubenheimer, 2009), we hypothesized that diet would alter
the rate of decline in fatigue tolerance. We further hypothesized
that the best diet for acute fatigue tolerance might be different from
the best diet for long-term maintenance of function.
We found instead that the pattern of fatigue tolerance across diets
was similar at 3weeks to the findings at 1week of age (Figs1, 2).
Flies of both genotypes and across all diets showed a substantial
decline in fatigue tolerance between 1 and 3weeks (Figs1, 2).
Cohorts on low-calorie balanced diets again ran the longest
(Fig.2A,D), although the 2.5S/2.5Y diet was more protective than
the 5S/5Y diet in both genotypes (Fig.2A,D). Among flies on
unbalanced diets, those on high sucrose, low yeast diets again
performed better than those on low sucrose, high yeast diets
(Fig.2B,C,E,F). An unexpected genotype effect was observed when
comparing 1 and 3week measurements. Although Canton S flies
were clearly stronger runners at 1week across all diets than Berlin
K flies, this advantage disappeared by 3weeks of age (Figs1, 2).
This suggests that Berlin K flies have a slower rate of age-related
decline in this parameter than Canton S flies. Statistical comparisons
for every pairwise combination of cohorts are provided in
supplementary material TableS1.
Negative geotaxis
Negative geotaxis, a measure of how rapidly flies instinctively
respond to a stimulus by moving up the sides of a vial, is a standard
measure of fly vigor and mobility (Jones and Grotewiel, 2011).
Negative geotaxis speed is known to decline with age (Gargano et
al., 2005) and increase with exercise training (Piazza et al., 2009;
Tinkerhess et al., 2012a). Here, we performed longitudinal
measurements five times per week to track the changing negative
geotaxis performance of aging flies on various diets.
In general, Berlin K flies were found to climb faster than Canton
S flies, independently of diet (Fig.3). The two genotypes showed
similar trends in dietary responses, although the magnitude varied
between genotypes. Within balanced diets, negative geotaxis tended
to be slow, in comparison to unbalanced diets (Fig.3; supplementary
material TableS1). Balanced diets also showed only minor
differences in the effect on climbing in comparison to each other
(Fig.3A,D). There was little difference between the effects of the
LysoTracker
(puncta100µm–2
)
0
4
8
12
2.5S/2.5Y5S/5Y
10S/10Y
20S/20Y
2.5S/10Y5S/10Y
10S/20Y
10S/2.5Y10S/5Y
20S/10Y
* *
E
OilRedO
(puncta100µm–2
)
0
4
8
2
6
10
2.5S/2.5Y5S/5Y
10S/10Y
20S/20Y
2.5S/10Y5S/10Y
10S/20Y
10S/2.5Y10S/5Y
20S/10Y
C
50 1510 20
% Yeast (w/v)
%Sucrose(w/v)
0
5
10
15
20 B
Failure rate < 45%
45% < failure rate < 70%
Failure rate > 75%
LysoTracker
(puncta100µm–2
)
0
4
8
12
2.5S/2.5Y5S/5Y
10S/10Y
20S/20Y
2.5S/10Y5S/10Y
10S/20Y
10S/2.5Y10S/5Y
20S/10Y
*
*
D
Low sucrose/yeast ratio
Equal ratio
High sucrose/yeast ratio
Feedingrate(%)
0
5
10
15
2.5S/2.5Y5S/5Y
10S/10Y
20S/20Y
2.5S/10Y5S/10Y
10S/20Y
10S/2.5Y10S/5Y
20S/10Y
*
* *
A
Fig.4. Dietary composition alters feeding rate and cardiac function in male Berlin K flies. Data are presented as means and s.e.m. (A)Diets with low
sucrose/yeast ratio lower feeding rate compared with other diets (one-way ANOVA: P=0.0037). Key also relates to C–E. (B)Percentage of flies undergoing
cardiac fibrillation or arrest in response to temporary external electrical stress. Flies on the 5S/5Y diet had the lowest failure rate while flies on the 20S/10Y
diet had the highest. *Full diet-by-diet comparisons are presented in supplementary material TableS1. (C)Cardiac lipid levels, as detected via Oil Red O
staining, are not significantly affected by dietary make-up. (D)Flies fed low sucrose/yeast ratio food have higher cardiac LysoTracker Green staining than
those fed other diets (one-way ANOVA: P<0.0001). (E)LysoTracker Green staining of adipose tissue also reveals higher staining in flies fed low
sucrose/yeast ratio food (one-way ANOVA: P=0.0017). *Full statistical analyses for each assay are presented in supplementary material TableS1.
THE JOURNAL OF EXPERIMENTAL BIOLOGY
6. 864
different low sucrose/yeast diets at early ages. Differences began
to become evident after 20days, when flies on the 10S/20Y diet
retained a significantly higher negative geotaxis capacity in both
genotypes (Fig.3B,E).
The largest differences were observed in Berlin K flies on high
sucrose/yeast diets. These flies exhibited substantial differences at
early ages, and these differences were retained across the period of
observation. Within this group, the rank order of climbing speed
was the same as the rank order of total caloric content (Fig.3C).
This effect was not as evident in the Canton S background (Fig.3F),
and the effect of relative caloric content was not significant when
normalized to feeding rate. Relative caloric intake for each
diet/genotype cohort is provided in supplementary material TableS2.
Statistical comparisons for every pairwise combination of cohorts
are provided in supplementary material TableS1.
Feeding rate
As dietary composition has previously been reported to influence
feeding rate (Lee et al., 2008; Skorupa et al., 2008), we measured
feeding rate in both genotypes after 1week of exposure to each diet.
We found that the two genotypes displayed a similar pattern of
response (Fig.4A, Fig.5A). Diets with equal ratios of sucrose and
yeast stimulated similar feeding rates to those with high
sucrose/yeast ratio (Fig.4A, Fig.5A). Berlin K flies showed a mild
tendency toward increased feeding rate with increased total calorie
content (Fig.4A), but this tendency was not observed in Canton S
flies (Fig.5A). In both genotypes, diets with a low sucrose/yeast
ratio significantly reduced feeding rate regardless of total caloric
content (Fig.4A, Fig.5A). This is in agreement with the previously
published observation that sugar/yeast ratio is a key determinant of
feeding rate (Lee et al., 2008; Skorupa et al., 2008).
Cardiac stress resistance
Between 50 and 100 male flies of each genotype were placed on
each diet. At 3weeks of age, flies were connected to an external
pacing device and stimulated to twice their normal heart rate for
30s. Following pacing, the percentage of flies that exhibited a
fibrillation or arrest event was scored visually and recorded as failure
The Journal of Experimental Biology 216 (5)
50 1510 20
% Yeast (w/v)
%Sucrose(w/v)
0
5
10
15
20 B
Failure rate < 45%
45% < failure rate < 70%
Failure rate > 75%
Feedingrate(%)
0
5
10
15
2.5S/2.5Y5S/5Y
10S/10Y
20S/20Y
2.5S/10Y5S/10Y
10S/20Y
10S/2.5Y10S/5Y
20S/10Y
*
A Low sucrose/yeast ratio
Equal ratio
High sucrose/yeast ratio
LysoTracker
(puncta100µm–2
)
0
4
8
12
2.5S/2.5Y5S/5Y
10S/10Y
20S/20Y
2.5S/10Y5S/10Y
10S/20Y
10S/2.5Y10S/5Y
20S/10Y
E
OilRedO
(puncta100µm–2
)
0
4
8
2
6
10
2.5S/2.5Y5S/5Y
10S/10Y
20S/20Y
2.5S/10Y5S/10Y
10S/20Y
10S/2.5Y10S/5Y
20S/10Y
C
LysoTracker
(puncta100µm–2
)
0
4
8
12
2.5S/2.5Y5S/5Y
10S/10Y
20S/20Y
2.5S/10Y5S/10Y
10S/20Y
10S/2.5Y10S/5Y
20S/10Y
D
Fig.5. Dietary composition alters feeding rate and cardiac function of male Canton S flies. Data are presented as means and s.e.m. (A)Diets with low
sucrose/yeast ratio lower feeding rate compared with other diets (one-way ANOVA: P=0.0129). Key also relates to C–E. (B)Percentage of flies undergoing
cardiac fibrillation or arrest in response to temporary external electrical stress. Flies fed balanced low calorie diets have a lower pacing-induced failure rate
than those on any other diet (standard least-squares regression: P<0.02 for both). Flies fed high sucrose/yeast ratio food display an elevated pacing-induced
failure rate when compared with those on other diets (standard least-squares regression: P<0.05 in all cases). (C)Cardiac lipid levels as detected by Oil Red
O staining are not significantly affected by dietary composition. (D)LysoTracker Green staining for cardiac autophagy does not reveal a clear dietary trend in
Canton S flies. (E)LysoTracker Green staining for adipose tissue autophagy does not reveal a clear dietary trend in Canton S males. *Full statistical
analyses for each assay are presented in supplementary material TableS1.
THE JOURNAL OF EXPERIMENTAL BIOLOGY
7. 865Diet regulates exercise physiology
rate. This parameter has been previously reported to be age
dependent (Wessells et al., 2004), and to be susceptible to the effects
of extreme diets (Birse et al., 2010). Across a range of different
dietary concentrations, we found no significant difference in effect
between most diets and our typical lab diet (10S/10Y). Furthermore,
both genotypes exhibited failure rates similar to published wild-type
results from this age (Wessells et al., 2004; Wessells et al., 2009).
However, the 20S/10Y diet produced a significantly increased
cardiac failure rate in response to pacing in both genotypes (Fig.4B,
Fig.5B). By contrast, balanced low calorie diets significantly
reduced failure rates, with 5S/5Y being significantly reduced in both
genotypes, and 2.5S/2.5Y being significantly reduced only in
Canton S flies (Fig.4B, Fig.5B). Statistical comparisons for every
pairwise combination of cohorts are provided in supplementary
material TableS1.
Cardiac lipid storage
Hearts from each diet/genotype combination were dissected and
stained with Oil Red O to assess levels of lipid accumulation in
the myocardium. High myocardial lipid content has previously
been associated with impaired cardiac performance in Drosophila
(Birse et al., 2010; Sujkowski et al., 2012). Here, we found no
significant difference in effect between most diets tested (Fig.4C,
Fig.5C). However, flies on balanced, low-calorie diets showed
lower myocardial lipid levels than flies on all other diets in both
genotypes (Fig.4C, Fig.5C). Notably, these are the same diets that
promote lower cardiac failure rate in response to stress (Fig.4B,
Fig.5B).
Cardiac autophagy
Hearts from each diet/genotype combination were dissected and
stained with LysoTracker, in order to assess levels of autophagy in
the myocardium. For comparison, fat bodies were also dissected
and subjected to the same analysis. Significant genotype differences
were observed in this assay. In Berlin K, a significant trend towards
higher autophagy in both tissues was observed for all diets with a
low sucrose/yeast ratio (Fig.4D,E). By contrast, in Canton S, all
diets produced similar levels of autophagy, with no obvious trends
emerging (Fig.5D,E).
Diet switch
Many effects of diet on animal physiology are acute and can be
reversed by changing the animal’s diet. In flies, for example, the
effect of diet on age-specific mortality is known to be reversible
(Piper et al., 2005). Because dietary intake has a substantial effect
on fly endurance (Figs1, 2), we asked whether this effect was
reversible.
Four age-matched cohorts of flies were collected and placed on
one of two diets, either 2.5S/10Y or 10S/2.5Y. These diets were
chosen because they induce highly significant differences in fatigue
tolerance in both Berlin K and Canton S flies. After 5days, all four
cohorts were tested for fatigue tolerance. In both genotypes,
significant differences were observed, with flies on 10S/2.5Y
performing better than flies on 2.5S/10Y (Fig.6). These results are
in agreement with those in Fig.1.
Flies from two of the four cohorts were then switched onto the
opposite diet, allowed to habituate for 2days, and retested for fatigue
tolerance. In each case, flies exhibited fatigue tolerance characteristic
of their short-term, current diet, and never retained fatigue tolerance
associated with their previous diet (Fig.6). This was equally true
of both Berlin K and Canton S flies. We conclude that the effects
of diet on endurance are completely reversible within 48h.
Relative caloric intake
In principle, the impact of diet on the assays observed here could be
dependent on (1) total caloric intake, (2) ratio of dietary components
or (3) both. To assess the role of caloric intake, we determined the
relative caloric intake for each cohort, based on dietary content and
feeding rate (see Materials and methods). Relative caloric intake for
each cohort is listed in supplementary material TableS2. For each
physiological assay, we used regression analysis to ask whether total
caloric content had a strong predictive impact on performance. Total
caloric intake did not exhibit significant predictive value for any assay
(Fig.7). Therefore, our results are in agreement with longevity-based
findings suggesting that dietary composition is more important than
caloric intake when predicting physiological outcomes (Lee et al.,
2008; Skorupa et al., 2008; Lushchak et al., 2012).
DISCUSSION
Drosophila is emerging as an excellent model for studying the
impact of simple dietary constituents on various physiological
indices. The short lifespan and large numbers available in the fly
model make longitudinal studies of multiple non-invasive assays
practical. Here, we have focused on the impact of varying two major
Timetofatigue(min)
0
100
200
300
400
500
*
B
0
100
200
300
400
500
*
A
2.5S/10Y
no
sw
itch
10S/2.5Y
no
sw
itch
2.5S/10Y
r
10S/2.5Y
10S/2.5Y
r
2.5S/10Y
*
Day 5
Day 7
Fig.6. Effect of diet on endurance is reversible within 48h. Following
eclosion, male Berlin K (A) and Canton S (B) flies were fed either a high or
a low sucrose/yeast ratio diet. An endurance assay was performed on
day5 (means and s.e.m.). Flies fed a high sucrose/yeast ratio diet had
higher endurance than those fed a low sucrose/yeast ratio diet (log-rank
analysis: P<0.05). On day6, two groups were switched from one diet to the
other for 24h. On day7, another endurance assay was performed. Within
48h, flies that were switched displayed endurance typical of their new diet
rather than of their previous diet. *Full statistical analyses are presented in
supplementary material TableS1. Data are also presented in ʻrunspanʼ form
in supplementary material Fig.S3.
THE JOURNAL OF EXPERIMENTAL BIOLOGY
8. 866
dietary components on locomotion, endurance capacity and cardiac
performance.
When comparing relative rank orders from all assays presented
(Fig.8), several clear trends emerge. First, the two genetic
backgrounds have similar rank order responses to most assays, but
the magnitude of the difference is generally higher in Berlin K flies.
The reason for the greater plasticity in dietary response in this
background is presently unclear.
Some commonalities in diets that lead to an improvement in
results for multiple assays are also evident. In particular, balanced,
low-calorie diets appear to provide strong beneficial effects to both
endurance and cardiac physiology. These benefits are especially
apparent at later ages, where a substantial age-related decline has
already occurred in these parameters. This correlates well with
previous results associating such diets with extended longevity
(Partridge et al., 2005; Bhandari et al., 2007; Grandison et al., 2009).
These commonalities raise the question of whether the benefits
to longevity, endurance and cardiac performance all stem from
similar physiological mechanisms. One proposed mechanism by
which the interventions collectively known as dietary restriction
improve healthspan and longevity is by increasing levels of
autophagy (Bjedov et al., 2010; Partridge et al., 2011). Genetic
interventions in regulators of autophagy, such as target of rapamycin
(TOR) and eukaryotic initiation factor 4e binding protein (4eBP),
have previously been shown to preserve aging cardiac function
(Luong et al., 2006; Wessells et al., 2009) and negative geotaxis
during aging (Demontis and Perrimon, 2010). In rodent models,
exercise-induced autophagy is a key component necessary for the
benefits of exercise (He et al., 2012). However, increases in baseline
autophagy associated with diets high in saturated fatty acids
(comparable to the low sucrose/yeast ratio diet in this study) have
been linked with increased pathological cardiac hypertrophy (Russo
et al., 2012). We found no evidence in this study that cardiac baseline
autophagy levels are consistently altered by diets that improve
endurance or cardiac function.
By contrast, we found a strong correlation between low cardiac
lipid accumulation and improved endurance/cardiac function. For
example, the diets that lead to accumulation of the lowest levels of
cardiac lipid, 2.5S/2.5Y and 5S/5Y, are also the diets resulting in
the lowest cardiac failure rate during pacing (Fig.8). The same diets
also promote the highest endurance, though not necessarily the
highest speed (Fig.8). It has been previously observed that a
The Journal of Experimental Biology 216 (5)
Timetofatigue(min)
0
0.2
0.4
0.6
G
LysoTracker(puncta100µm–2
)
OilRedO(puncta100µm–2
)
Quadrant0 200 400 600
Relative caloric intake
0.8
0
2
4
6
D
0 200 400 600
0
100
200
300
400
500 A
0 200 400 600
0
50
100
150
200
250 B
0 200 400 600
8
1.0
Failurerate
0
5
10
15 E
0 200 400 600
0
5
10
15 F
0 200 400 600
Relative caloric intake
1.0
1.2
1.4
1.6
1.8
2.0 C
0 200 400 600
Fig.7. Caloric intake does not sufficiently predict the variance observed in Drosophila mobility and cardiac assays. In order to determine whether caloric
intake was a driving factor behind the observed trends, the ʻrelative caloric intakeʼ of each genotype/diet treatment was determined by measuring the total
caloric content of each diet, and then multiplying it by the product of the number of bites per observation and the amount ingested per bite for each cohort.
The following physiological assays were plotted against relative caloric intake and a linear regression was performed: (A) week1 average fatigue, (B) week4
average fatigue, (C) average RING quadrant, (D) average cardiac lipid levels, (E) average cardiac autophagy levels, (F) average fat autophagy levels and
(G) cardiac failure rate. In no case was caloric intake found to be a statistically significant predictor of physiological performance (R2
≤0.1227 for all assays).
Full relative caloric intake calculations for each genotype/diet are presented in supplementary material TableS2.
THE JOURNAL OF EXPERIMENTAL BIOLOGY
9. 867Diet regulates exercise physiology
reduction in TOR signaling both reduces triglyceride storage and
protects aging cardiac performance in Drosophila (Luong et al.,
2006; Wessells et al., 2009). Conversely, flies fed a high-fat diet
(Birse et al., 2010) or flies with genetic mutations that increase lipid
storage in the myocardium have decreased cardiac performance (Lim
et al., 2011; Sujkowski et al., 2012). Taken together, these results
are all consistent with the hypothesis that reduced lipid storage in
cardiac or other muscle may be an important mechanism by which
balanced, low-calorie diets protect endurance and cardiac
performance. Further work using flies to dissect the downstream
genetics induced by dietary changes will be necessary to resolve
this question with more certainty.
In the case of unbalanced diets, we found a divergence between
diets that benefit endurance and those that benefit cardiac
performance. Diets high in sugar/yeast ratio generally benefit
endurance, but have a negative impact on cardiac performance. This
may indicate a difference in energy requirements between the beating
heart and the various neuromotor functions involved in endurance
running. As sugars are preferentially used during endurance
behaviors, especially in untrained animals (Martin and Klein, 1998;
Graham and Adamo, 1999), extra dietary sugar may provide greater
access to quick sources of glucose for ATP production in muscle.
The mechanism by which such a diet impairs cardiac performance
in flies is unclear.
In contrast to the profound effects of dietary content on endurance,
the effects of diet on climbing speed were statistically significant,
but small in magnitude. The most significant effects were always
seen in the Berlin K background, whereas negative geotaxis in
Canton S flies was less clearly influenced by diet. No strong trends
emerged when comparing the slope of decline across time of
climbing speed, suggesting that diet does not strongly affect the
age-related decline of negative geotaxis, in agreement with previous
observations (Bhandari et. al., 2007).
The experiments here focus on the effect of diet on acute
measures of mobile capacity. The effect of diet on the long-term
improvement in climbing speed following a training regimen has
previously been measured. In that context, variation of sucrose
had little effect, whereas the magnitude of improvement following
training was closely associated with the amount of yeast in the
diet, independent of sucrose (Piazza et al., 2009). Taken together,
these results clearly indicate that flies have substantially different
requirements for acute energy expenditure versus long-term
physiological responses to training. This should be taken into
account in comparing and interpreting varying results from
different experimental protocols.
Lastly, we found that the effects of diet on endurance are
completely reversible within 48h of switching animals to a new
diet. These findings are consistent with the acute ability of diet to
alter mortality rates within the same time scale (Mair et al., 2005).
Flies should serve as an excellent model for future longitudinal
studies more thoroughly dissecting the long-term and acute roles
of various dietary constituents on endurance and exercise response.
ACKNOWLEDGEMENTS
The authors would like to thank Scott Pletcher (University of Michigan) for sharing
image analysis software he developed. We would also like to thank anonymous
reviewers and editors for their comments, which helped improve this manuscript.
FUNDING
This research was supported by the National Heart, Lung, and Blood Institute
(NHLBI), a division of the National Institutes of Health (NIH) [grant no. NIH/NHLBI
5R21 HL104262-02]. Deposited in PMC for release after 12 months.
REFERENCES
Bartke, A., Peluso, M. R., Moretz, N., Wright, C., Bonkowski, M., Winters, T. A.,
Shanahan, M. F., Kopchick, J. J. and Banz, W. J. (2004). Effects of soy-derived
diets on plasma and liver lipids, glucose tolerance, and longevity in normal, long-
lived and short-lived mice. Horm. Metab. Res. 36, 550-558.
Bhandari, P., Jones, M. A., Martin, I. and Grotewiel, M. S. (2007). Dietary restriction
alters demographic but not behavioral aging in Drosophila. Aging Cell 6, 631-637.
Birse, R. T., Choi, J., Reardon, K., Rodriguez, J., Graham, S., Diop, S., Ocorr, K.,
Bodmer, R. and Oldham, S. (2010). High-fat-diet-induced obesity and heart
dysfunction are regulated by the TOR pathway in Drosophila. Cell Metab. 12, 533-
544.
Bishop, N. A. and Guarente, L. (2007). Genetic links between diet and lifespan:
shared mechanisms from yeast to humans. Nat. Rev. Genet. 8, 835-844.
Bjedov, I., Toivonen, J. M., Kerr, F., Slack, C., Jacobson, J., Foley, A. and
Partridge, L. (2010). Mechanisms of life span extension by rapamycin in the fruit fly
Drosophila melanogaster. Cell Metab. 11, 35-46.
Booth, F. W. and Thomason, D. B. (1991). Molecular and cellular adaptation of
muscle in response to exercise: perspectives of various models. Physiol. Rev. 71,
541-585.
Bouchard, C., Blair, S. N., Church, T. S., Earnest, C. P., Hagberg, J. M., Häkkinen,
K., Jenkins, N. T., Karavirta, L., Kraus, W. E., Leon, A. S. et al. (2012). Adverse
metabolic response to regular exercise: is it a rare or common occurrence? PLoS
ONE 7, e37887.
Catterson, J. H., Knowles-Barley, S., James, K., Heck, M. M. S., Harmar, A. J. and
Hartley, P. S. (2010). Dietary modulation of Drosophila sleep-wake behaviour. PLoS
ONE 5, e12062.
Chandler, J. M. and Hadley, E. C. (1996). Exercise to improve physiologic and
functional performance in old age. Clin. Geriatr. Med. 12, 761-784.
Chudyk, A. and Petrella, R. J. (2011). Effects of exercise on cardiovascular risk
factors in type 2 diabetes: a meta-analysis. Diabetes Care 34, 1228-1237.
Demontis, F. and Perrimon, N. (2010). FOXO/4E-BP signaling in Drosophila muscles
regulates organism-wide proteostasis during aging. Cell 143, 813-825.
Performancecomparedwith10S/10Y
0
0.5
A B
2.5S/2.5Y
5S/5Y
20S/20Y
2.5S/10Y
5S/10Y
10S/20Y
10S/2.5Y
10S/5Y
20S/10Y
1.0
1.5
2.0
–1.0
–0.5
R
IN
G
Fatigue,w
eek
1
Fatigue,w
eek
4
C
ardiac
pacing
C
ardiac
fatlevels
C
ardiac
autophagy
Feeding
rate
R
IN
G
Fatigue,w
eek
1
Fatigue,w
eek
4
C
ardiac
pacing
C
ardiac
fatlevels
C
ardiac
autophagy
Feeding
rate
Fig.8. Rank order summary of dietary effects on
Drosophila mobility and cardiac phenotypes, relative
to the standard 10S/10Y diet for Berlin K (A) and
Canton S (B) flies. Between genotypes, dietary trends
are very similar. In general, flies on balanced low-
calorie diets have higher endurance across ages,
lower pacing-induced cardiac failure and lower levels
of cardiac lipid. Among unbalanced diets, those with
a high sucrose/yeast ratio led to higher endurance
but also higher pacing-induced cardiac failure than
low sucrose/yeast ratio diets.
THE JOURNAL OF EXPERIMENTAL BIOLOGY
10. 868
El-Haddad, H., Champion, H. C., Danner, T. A., Rao, S. S., Mulhearn, T. J., Haile,
A., Gebska, M., Hemnes, A., Hager, M., Breton, M. et al. (2011). Exercise training
improves cardiac function and restores nuclear localization of pAKT in aged mice.
Circulation 124, A8264.
Fitts, R. H. and Widrick, J. J. (1996). Muscle mechanics: adaptations with exercise-
training. Exerc. Sport Sci. Rev. 24, 427-473.
Freyssenet, D., Berthon, P. and Denis, C. (1996). Mitochondrial biogenesis in skeletal
muscle in response to endurance exercises. Arch. Physiol. Biochem. 104, 129-141.
Gargano, J. W., Martin, I., Bhandari, P. and Grotewiel, M. S. (2005). Rapid iterative
negative geotaxis (RING): a new method for assessing age-related locomotor
decline in Drosophila. Exp. Gerontol. 40, 386-395.
Graham, T. E. and Adamo, K. B. (1999). Dietary carbohydrate and its effects on
metabolism and substrate stores in sedentary and active individuals. Can. J. Appl.
Physiol. 24, 393-415.
Grandison, R. C., Wong, R., Bass, T. M., Partridge, L. and Piper, M. D. W. (2009).
Effect of a standardised dietary restriction protocol on multiple laboratory strains of
Drosophila melanogaster. PLoS ONE 4, e4067.
Hall, K. D., Heymsfield, S. B., Kemnitz, J. W., Klein, S., Schoeller, D. A. and
Speakman, J. R. (2012). Energy balance and its components: implications for body
weight regulation. Am. J. Clin. Nutr. 95, 989-994.
Hayashi, T., Wojtaszewski, J. F. P. and Goodyear, L. J. (1997). Exercise regulation
of glucose transport in skeletal muscle. Am. J. Physiol. 273, E1039-E1051.
He, C. C., Bassik, M. C., Moresi, V., Sun, K., Wei, Y. J., Zou, Z. J., An, Z., Loh, J.,
Fisher, J., Sun, Q. et al. (2012). Exercise-induced BCL2-regulated autophagy is
required for muscle glucose homeostasis. Nature 481, 511-515.
Henriksson, J. (1995). Influence of exercise on insulin sensitivity. J. Cardiovasc. Risk
2, 303-309.
Hopps, E. and Caimi, G. (2011). Exercise in obesity management. J. Sports Med.
Phys. Fitness 51, 275-282.
Irrcher, I., Adhihetty, P. J., Joseph, A. M., Ljubicic, V. and Hood, D. A. (2003).
Regulation of mitochondrial biogenesis in muscle by endurance exercise. Sports
Med. 33, 783-793.
Jones, M. A. and Grotewiel, M. (2011). Drosophila as a model for age-related
impairment in locomotor and other behaviors. Exp. Gerontol. 46, 320-325.
Kemi, O. J. and Wisloff, U. (2010). High-intensity aerobic exercise training improves
the heart in health and disease. J. Cardiopulm. Rehabil. Prev. 30, 2-11.
Lee, K. P., Simpson, S. J., Clissold, F. J., Brooks, R., Ballard, J. W. O., Taylor, P.
W., Soran, N. and Raubenheimer, D. (2008). Lifespan and reproduction in
Drosophila: new insights from nutritional geometry. Proc. Natl. Acad. Sci. USA 105,
2498-2503.
Lim, H. Y., Wang, W. D., Wessells, R. J., Ocorr, K. and Bodmer, R. (2011).
Phospholipid homeostasis regulates lipid metabolism and cardiac function through
SREBP signaling in Drosophila. Genes Dev. 25, 189-200.
Linford, N. J., Chan, T. P. and Pletcher, S. D. (2012). Re-patterning sleep
architecture in Drosophila through gustatory perception and nutritional quality. PLoS
Genet. 8, e1002668.
Luong, N., Davies, C. R., Wessells, R. J., Graham, S. M., King, M. T., Veech, R.,
Bodmer, R. and Oldham, S. M. (2006). Activated FOXO-mediated insulin
resistance is blocked by reduction of TOR activity. Cell Metab. 4, 133-142.
Lushchak, O. V., Gospodaryov, D. V., Rovenko, B. M., Glovyak, A. D., Yurkevych,
I. S., Klyuba, V. P., Shcherbij, M. V. and Lushchak, V. I. (2012). Balance between
macronutrients affects life span and functional senescence in fruit fly Drosophila
melanogaster. J. Gerontol. A Biol. Sci. Med. Sci. 67A, 118-125.
Mair, W., Piper, M. D. and Partridge, L. (2005). Calories do not explain extension of
life span by dietary restriction in Drosophila. PLoS Biol. 3, e223.
Martin, W. H. 3rd and Klein, S. (1998). Use of endogenous carbohydrate and fat as
fuels during exercise. Proc. Nutr. Soc. 57, 49-54.
Matoba, H. and Gollnick, P. D. (1984). Response of skeletal muscle to training.
Sports Med. 1, 240-251.
Mercken, E. M., Carboneau, B. A., Krzysik-Walker, S. M. and de Cabo, R. (2012).
Of mice and men: the benefits of caloric restriction, exercise, and mimetics. Ageing
Res. Rev. 11, 390-398.
Miller, R. A., Buehner, G., Chang, Y., Harper, J. M., Sigler, R. and Smith-
Wheelock, M. (2005). Methionine-deficient diet extends mouse lifespan, slows
immune and lens aging, alters glucose, T4, IGF-I and insulin levels, and increases
hepatocyte MIF levels and stress resistance. Aging Cell 4, 119-125.
Parashar, V. and Rogina, B. (2009). dSir2 mediates the increased spontaneous
physical activity in flies on calorie restriction. Aging (Albany NY) 1, 529-541.
Partridge, L., Piper, M. D. W. and Mair, W. (2005). Dietary restriction in Drosophila.
Mech. Ageing Dev. 126, 938-950.
Partridge, L., Alic, N., Bjedov, I. and Piper, M. D. W. (2011). Ageing in Drosophila:
the role of the insulin/Igf and TOR signalling network. Exp. Gerontol. 46, 376-381.
Piazza, N., Gosangi, B., Devilla, S., Arking, R. and Wessells, R. (2009). Exercise-
training in young Drosophila melanogaster reduces age-related decline in mobility
and cardiac performance. PLoS ONE 4, e5886.
Piper, M. D. W., Mair, W. and Partridge, L. (2005). Counting the calories: the role of
specific nutrients in extension of life span by food restriction. J. Gerontol. A Biol. Sci.
Med. Sci. 60A, 549-555.
Russo, S. B., Baicu, C. F., Van Laer, A., Geng, T., Kasiganesan, H., Zile, M. R. and
Cowart, L. A. (2012). Ceramide synthase 5 mediates lipid-induced autophagy and
hypertrophy in cardiomyocytes. J. Clin. Invest. 122, 3919-3930.
Simpson, S. J. and Raubenheimer, D. (2009). Macronutrient balance and lifespan.
Aging (Albany NY) 1, 875-880.
Skorupa, D. A., Dervisefendic, A., Zwiener, J. and Pletcher, S. D. (2008). Dietary
composition specifies consumption, obesity, and lifespan in Drosophila
melanogaster. Aging Cell 7, 478-490.
Sujkowski, A., Saunders, S., Tinkerhess, M., Piazza, N., Jennens, J., Healy, L.,
Zheng, L. and Wessells, R. (2012). dFatp regulates nutrient distribution and long-
term physiology in Drosophila. Aging Cell 11, 921-932.
Sun, L., Sadighi Akha, A. A., Miller, R. A. and Harper, J. M. (2009). Life-span
extension in mice by preweaning food restriction and by methionine restriction in
middle age. J. Gerontol. A Biol. Sci. Med. Sci. 64A, 711-722.
Tinkerhess, M. J., Ginzberg, S., Piazza, N. and Wessells, R. J. (2012a). Endurance
training protocol and longitudinal performance assays for Drosophila melanogaster.
J. Vis. Exp. 61, e3786.
Tinkerhess, M. J., Healy, L., Morgan, M., Sujkowski, A., Matthys, E., Zheng, L. and
Wessells, R. J. (2012b). The Drosophila PGC-1α homolog spargel modulates the
physiological effects of endurance exercise. PLoS ONE 7, e31633.
Vijendravarma, R. K., Narasimha, S. and Kawecki, T. J. (2012). Adaptation to
abundant low quality food improves the ability to compete for limited rich food in
Drosophila melanogaster. PLoS ONE 7, e30650.
Wessells, R. J., Fitzgerald, E., Cypser, J. R., Tatar, M. and Bodmer, R. (2004).
Insulin regulation of heart function in aging fruit flies. Nat. Genet. 36, 1275-1281.
Wessells, R., Fitzgerald, E., Piazza, N., Ocorr, K., Morley, S., Davies, C., Lim, H.
Y., Elmén, L., Hayes, M., Oldham, S. et al. (2009). d4eBP acts downstream of both
dTOR and dFoxo to modulate cardiac functional aging in Drosophila. Aging Cell 8,
542-552.
Wong, R., Piper, M. D. W., Wertheim, B. and Partridge, L. (2009). Quantification of
food intake in Drosophila. PLoS ONE 4, e6063.
The Journal of Experimental Biology 216 (5)
THE JOURNAL OF EXPERIMENTAL BIOLOGY