A Multiset Rule Based Petri net Algorithm for the Synthesis and Secretary Pat...
Brandon_poster_pdf
1. CONFOCAL IMAGE ANALYSIS
Brandon Ringlstetter, Computer Science, California State University San Bernardino
Renuka Shenoy, Prof. Kenneth Rose, Prof. B.S. Manjunath, Electrical and Computer Engineering
These images are obtained by photographing a slice of rabbit retina that
has been previously stained with various macro-molecule and micro-
molecule markers that when excited by the lasers in the Confocal
microscope distinguish different cell types in the retina.
The Microscope is useful in this scope because of its ability to look into
individual optical slices of the retina, allowing the analysis of cell statistics
throughout the section of retina.
Project Scope
Confocal Images
Mean-shift Segmentation
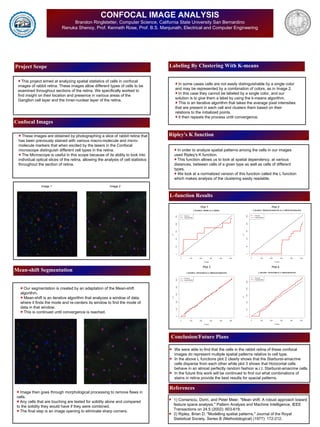
We were able to find that the cells in the rabbit retina of these confocal
images do represent multiple spatial patterns relative to cell type.
In the above L functions plot 2 clearly shows that the Starburst-amacrine
cells disperse from each other while plot 3 shows that Horizontal cells
behave in an almost perfectly random fashion w.r.t. Starburst-amacrine cells.
In the future this work will be continued to find out what combinations of
stains in retina provide the best results for spacial patterns.
Conclusion/Future Plans
Labeling By Clustering With K-means
Ripley's K function
Image then goes through morphological processing to remove flaws in
cells.
Any cells that are touching are tested for solidity alone and compared
to the solidity they would have if they were combined.
The final step is an image opening to eliminate sharp corners.
In some cases cells are not easily distinguishable by a single color
and may be represented by a combination of colors, as in Image 2.
In this case they cannot be labeled by a single color, and our
solution is to give them a label by using the k-means algorithm.
This is an iterative algorithm that takes the average pixel intensities
that are present in each cell and clusters them based on their
relations to the initialized points.
It then repeats the process until convergence.
Image 1 Image 2
This project aimed at analyzing spatial statistics of cells in confocal
images of rabbit retina. These images allow different types of cells to be
examined throughout sections of the retina. We specifically worked to
find insight on their location and presence in various areas of the
Ganglion cell layer and the Inner-nuclear layer of the retina.
Our segmentation is created by an adaptation of the Mean-shift
algorithm.
Mean-shift is an iterative algorithm that analyzes a window of data,
where it finds the mode and re-centers its window to find the mode of
data in that window.
This is continued until convergence is reached.
In order to analyze spatial patterns among the cells in our images
used Ripley's K function.
This function allows us to look at spatial dependency, at various
distances, between cells of a given type as well as cells of different
types.
We look at a normalized version of this function called the L function
which makes analysis of the clustering easily readable.
L-function Results
1) Comaniciu, Dorin, and Peter Meer. "Mean shift: A robust approach toward
feature space analysis." Pattern Analysis and Machine Intelligence, IEEE
Transactions on 24.5 (2002): 603-619.
2) Ripley, Brian D. "Modelling spatial patterns." Journal of the Royal
Statistical Society. Series B (Methodological) (1977): 172-212.
References
Plot 3 Plot 4
Plot 1 Plot 2