More Related Content
Similar to Opf0417feature2
Similar to Opf0417feature2 (20)
Opf0417feature2
- 1. 16 Opflow April 2017 www.awwa.org/opflow
2017 © American Water Works Association
Disinfection
The most reliable chloramination control method is to monitor the target
disinfectant, monochloramine, as well as free and total ammonia. Other water
quality parameters, such as free chlorine, may serve an auxiliary role and
provide valuable information for process and instrumentation troubleshooting.
BY VADIM B. MALKOV
Use Process Control as the Basis
for Efficient Chloramination
T
http://dx.doi.org/10.5991/OPF.2017.43.0022
Vadim B. Malkov is a product applications manager
with Hach (www.hach.com), Loveland, Colo.
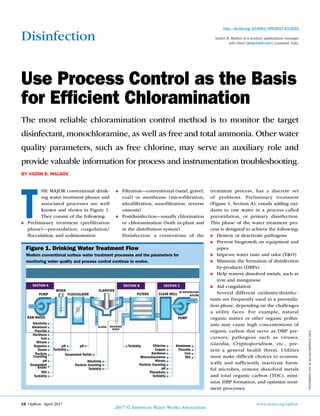
HE MAJOR conventional drink-
ing water treatment phases and
associated processes are well
known and shown in Figure 1.
They consist of the following:
■■ Preliminary treatment (prefiltration
phase)—preoxidation, coagulation/
flocculation, and sedimentation
■■ Filtration—conventional (sand, gravel,
coal) or membrane (microfiltration,
ultrafiltration, nanofiltration, reverse
osmosis)
■■ Postdisinfection—usually chlorination
or chloramination (both in-plant and
in the distribution system)
Disinfection, a cornerstone of the
treatment process, has a discrete set
of problems. Preliminary treatment
(Figure 1, Section A), entails adding oxi-
dants to raw water in a process called
preoxidation, or primary disinfection.
This phase of the water treatment pro-
cess is designed to achieve the following:
■■ Destroy or deactivate pathogens
■■ Prevent biogrowth on equipment and
pipes
■■ Improve water taste and odor (T&O)
■■ Minimize the formation of disinfection
by-products (DBPs)
■■ Help remove dissolved metals, such as
iron and manganese
■■ Aid coagulation
Several different oxidants/disinfec-
tants are frequently used in a preoxida-
tion phase, depending on the challenges
a utility faces. For example, natural
organic matter or other organic pollut-
ants may cause high concentrations of
organic carbon that serve as DBP pre-
cursors; pathogens such as viruses,
Giardia, Cryptosporidium, etc., pre-
sent a general health threat. Utilities
must make difficult choices to econom-
ically and sufficiently inactivate harm-
ful microbes, remove dissolved metals
and total organic carbon (TOC), mini-
mize DBP formation, and optimize treat-
ment processes.
PHOTOGRAPH:CITYOFDALLAS/GRAPHICS:HACH
Alkalinity
Aluminum
Fluoride
Hardness
Iron
Nitrate
Organics
Ozone
Particle
Counting
pH
TOC
Turbidity
Chlorine
Copper
Hardness
Monochloramine
Nitrate
Particle Counting
pH
Phosphate
Turbidity
PUMP
RAW WATER
MIXER
FLOCCULATOR
CLARIFIER
SLUDGE
FILTERS CLEAR WELL
TO DISTRIBUTION
SYSTEM
PUMP
Suspended
Solids
pH
Turbidity
pH
Suspended Solids
Alkalinity
Particle Counting
Turbidity
Turbidity Aluminum
Fluoride
Iron
TOC
SECTION A SECTION B SECTION C
BACKWASH
WATER
Figure 1. Drinking Water Treatment Flow
Modern conventional surface water treatment processes and the parameters for
monitoring water quality and process control continue to evolve.
- 2. www.awwa.org/opflow April 2017 Opflow 17
2017 © American Water Works Association
The Bachman Water Treatment Plant in Dallas controls chloramination
by measuring monochloramine (as a main part of total chlorine)
and free ammonia instead of free chlorine. The plant implemented
chloramination control protocols requiring online monitoring of key
parameters and regular grab sample analyses for verification.
Usually chlorine is used in the preox-
idation phase if the source water is min-
imally contaminated with organics or the
source water contains a low concentra-
tion of difficult-to-treat microorganisms
such as Giardia or Cryptosporidium. If
the source water is more contaminated
and challenging, ozone, chlorine dioxide,
or chloramine are used for primary dis-
infection and oxidation. There are also
situations when chemical treatment is
combined with ultraviolet light and sev-
eral oxidants, but such advanced oxida-
tion processes are beyond the scope of
this article. Other aspects of preoxidation
that shouldn’t be underestimated help
operators aid coagulation, keep filters
operating longer by preventing exces-
sive biogrowth, and remove dissolved
metals (e.g., manganese) to prevent fil-
ter contamination and aesthetic issues
downstream.
Secondary or postfilter disinfection
(Figure 1, Section C) requires operators
to maintain sufficient disinfectant resid-
ual beyond point of entry, which in the
United States is the last control and regula-
tory reporting point before the first tap or
customer in the distribution network, and
throughout the distribution system. Parts
of the water distribution network may be
in remote locations, and delivering safe tap
water can be challenging. Therefore, water
utilities must choose the right disinfectant,
and the choice may vary with seasons and
events affecting source water quality.
Table 1 shows various oxidants and
their advantages and disadvantages,
which may differ for primary and sec-
ondary disinfection. The focus here is
on chlorine and chloramine disinfection,
the most commonly used oxidants in
Disinfectant
Primary Disinfectiona Secondary Disinfectiona
Positive Negative Positive Negative
Chlorine gasb Strong,
inexpensive
High DBP,
safety/security
Strong,
inexpensive
Taste and odor
(T&O), DBP, safety
Monochloramine Less DBP Cost, process
control
Longer living,
less DBP
Nitrification, T&O
Chlorine dioxide
Kills Giardia,
oocyst,
less DBP
Cost, safety Long living,
active
Chlorite/chlorate,
cost
Ozone Strong,
less DBP
Bromate, little
residual, cost NA No residual
Hydrogen
peroxide/PAAc
Strong, easy
to handle
Bromate, no
residual, cost NA No residual
Permanganate Strong, easy
to handle
MnOx (staining) NA MnOx
(staining, etc.)
UV Strong,
no DBP Cost, no residual NA No residual
a Disinfectant activity comparison is based on CT values.
b Hypochlorite is frequently used as an alternative to reduce risk of gaseous chlorine leaks and simplify application.
c Hydrogen peroxide is often used in mixture with peroxyacetic acid (PAA) to increase the oxidant’s stability and efficiency.
Table 1. Disinfection Techniques Commonly Used in
Drinking Water Preparation
The pros and cons of various oxidants may vary for primary and secondary disinfection.
- 3. 18 Opflow April 2017 www.awwa.org/opflow
2017 © American Water Works Association
primary and secondary disinfection. If
chloramination is selected, its specifics
and requirements must be well under-
stood. It’s important to focus on forma-
tion, monitoring, and control of the target
disinfectant, monochloramine, while
optimizing the entire process. Table 2
highlights the main characteristics of
chloramination.
Chloramines have lower reactivity
compared with free chlorine, and they
react less intensely with various impu-
rities in raw water, particularly organic
substances. This results in the formation
of fewer DBPs, primarily trihalometh-
anes (THMs) with carcinogenic proper-
ties. This is one of the most important
factors contributing to the demand for
replacing chlorination with chloramina-
tion. Also, because of reduced oxidizing
power, chloramine creates a substantially
smaller disinfectant demand, which sig-
nificantly reduces chlorine consumption
to maintain a desired total chlorine resid-
ual in the water, which lowers the treat-
ment cost.
As shown in Table 2, one of the main dif-
ferentiators in chloramination monitoring is
measuring total chlorine concentration ver-
sus the free chlorine residual in regular
chlorination processes. According to simpli-
fied chemistry, Total Chlorine (TC) = Free
Chlorine (FC) + Combined Chlorine (CC).
Although this equation may seem correct,
don’t forget the target disinfectant in chlo-
ramination is monochloramine, not com-
bined chlorine. To understand the basics, it’s
necessary to review the chemistry behind
free and total chlorine formation and
nuances of the analysis. Figure 2 presents the
chemical reactions leading to the for-
mation of major free and total chlorine
species. Special attention should be paid
to the monochloramine-formation step and
that these reactions are reversible; equilib-
rium between the species depends on water
pH and temperature.
If the TC = FC + CC concept is fol-
lowed, the differentiation between free
and total chlorine seems to be simple—
one can just measure free and total chlo-
rine with appropriate analytical methods,
and the difference should give mono-
chloramine concentration. However, the
reality isn’t that simple.
As can be concluded from the chemical
reactions presented in Figure 2, monochlo-
ramine can be formed either by adding
free chlorine to ammonia or the other way
around. Both ways are equally important
and used in the water industry, especially
if there’s naturally occurring ammonia in
the source water. As explained by the
breakpoint chlorination curve shown in
Figure 3, when chlorinating water with
ammonia present (moving left to right
along the chart), the measured concentra-
tion of total chlorine undergoes strange
and seemingly illogical swings as the chlo-
rination proceeds (red line). This happens
because chlorine demand is satisfied first,
and then chloramines are formed accord-
ing to the chemical reactions presented in
Figure 2.
In general, the processes presented in
Figure 3 correlate with the reactions in Fig-
ure 2, and the chloramination process can
be narrowed down to the following simpli-
fied equation: Free Chlorine + Ammonia =
Combined Chlorine.
However, results of the predominant
chemical reactions shown in Figure 3’s three
regions are different and can be illustrated
by the following:
Region I. Cl2:N < 5:1 – NH3 + HOCl
↔ H2O + NH2Cl – monochloramine
Region II. Cl2:N > 5:1 – NH2Cl + HOCl
↔ H2O + NHCl2 – dichloramine
Region III. Cl2:N > 9:1 – NHCl2 + HOCl
↔ H2O + NCl3 – nitrogen trichloride
(trichloramine) => decomposes with for-
mation of free chlorine and nitrogen gas
Advantages Disadvantages
Main Monitoring
Requirements
■■ Reduced DBP
formation
■■ Reduced taste-and-
odor issues
■■ Prolonged useful
life of disinfectant
(monochloramine)
■■ Monochloramine is a
weaker disinfectant
than free chlorine and
requires longer CT
■■ Risk of nitrification in
the distribution system
■■ Total chlorine analysis
■■ Tighter process control
■■ Multiparameter monitoring
Table 2. Main Traits of Chloramination for Water Disinfection
Operators who work with chloramination should focus on monochloramine formation,
monitoring, and control.
Figure 2. Common Disinfection Equations
A set of basic chemical reactions describe the formation of chlorine species classified as
free, total, and combined chlorine.
Disinfection
Free chlorine (strong disinfectant):
Cl2 + H2O ↔ HOCl + OCl– (hypochlorous acid + hypochlorite ion)
Chloramines (combined chlorine):
NH3 + HOCl ↔ H2O + NH2Cl (monochloramine) – TARGET!
NH2Cl + HOCl ↔ H2O + NHCl2 (dichloramine)
NHCl2 + HOCl ↔ H2O + NCl3 (nitrogen trichloride – unstable)
Organic chloramines (very weak disinfectants):
Org-NH + HOCl ↔ Org N-Cl
Major source of
“chlorine” taste
and odor
- 4. www.awwa.org/opflow April 2017 Opflow 19
2017 © American Water Works Association
Thus, the following substances can
be observed in the process of drink-
ing water chloramination: chloramines,
free and total ammonia (sum of mono-
chloramine and free ammonia concen-
trations) and free chlorine. Basically, all
chlorine species can be present in the
water during chlorination/chloramina-
tion. The question is, which species are
present sustainably and which are mostly
equilibrial (short-living, transitional spe-
cies) in each region?
The transitional concentrations can be
measured, but such analysis would reflect
only a momentary state of the equilib-
rial reaction. This can be illustrated as a
series of snapshots of a dynamic process.
Some of the compounds (with stable con-
centrations) are shown on all the pho-
tographs with a constant image quality,
whereas others are shown in only some
of the photographs, and the image quality
may vary (transitional, unstable spe-
cies). The reality of the situation can be
determined from a relatively simple anal-
ysis of each reaction, based on statistical
factors and knowledge of the analytical
methods, as summarized in Table 3.
By understanding the dynamics of the
transformation of chlorine- and nitrogen-
containing compounds in the described
processes, operators can establish key
monitoring parameters needed to keep
chloramination and chlorination under
control. Table 4 shows key monitoring
parameters for chloramination.
FREE CHLORINE OR FREE AMMONIA?
Because successful chloramination is
based on sustainable monochloramine
formation from free chlorine and ammo-
nium/ammonia, the process requires
strict control to prevent unintended con-
sequences such as nitrification in the
water distribution system. To achieve the
necessary control and optimize water
treatment processes, operators must care-
fully monitor the chloramination process.
In doing so, they often rely on monitor-
ing the concentration of free ammonia or
free chlorine as the primary index. Both
approaches have supporters, and the best
method is widely debated in the indus-
try—measuring free and total chlorine
versus measuring total chlorine and free
ammonia. The latter method should be
positioned as measuring monochloramine
Region I Region II Region III
Cl2: N < 5:1
NH3 + HOCl ↔ H2O + NH2Cl
monochloramine formation
Cl2: N > 5:1 and < 9:1
NH2Cl + HOCl ↔ H2O + NHCl2
dichloramine formation
Cl2: N > 9:1
NHCl2 + HOCl ↔ H2O + NCl3
Stable compounds:
Monochloramine, total and free
ammonia
Transitional: Free chlorine
Measured concentrations: Total chlorine
is slightly above monochloramine;
total ammonia > monochloramine,
difference = free ammonia.
Stable compounds:
Monochloramine and total ammonia
Transitional: Free chlorine
Measured concentrations:
Total chlorine > measured monochloramine;
monochloramine = total ammonia, no free
ammonia.
Unstable trichloramine (nitrogen
trichloride) formation and release of
free chlorine
Stable compounds: Free chlorine
Measured concentrations:
Total chlorine = free chlorine;
no monochloramine or any ammonia is
detected.
Table 3. Transitional Concentrations
Chlorine speciation can be determined from a relatively simple analysis of each reaction.
Overall, comprehensive and accurate in-plant chloramination
control helps operators maintain water quality at point of entry
and avoid unwanted consequences in the distribution system.
TotalandFreeAmmonia
Chlorine Added
TotalResidualChlorine
Monochloramine
Formation
Free Ammonia
Total Ammonia Dichloramine
Formation
Free Residual
Chlorine
Breakpoint Curve for Chlorination and Chloramination
Breakpoint
Region I Region II Region III
Cl2
:N < 5:1 Cl2
:N > 5:1 Cl2
:N > 9:1
Figure 3. Breakpoint Chlorination Curve
A breakpoint chlorination curve illustrates the phases of water chlorination in the presence
of ammonia (regions I, II, and III) and the behavior of the main analytical parameters
- 5. 20 Opflow April 2017 www.awwa.org/opflow
2017 © American Water Works Association
and free ammonia, because this combina-
tion is more specific and therefore pro-
vides better process control.
The theoretical analysis of chemical
reactions describing the formation of var-
ious chlorine species and their sustain-
ability calls for more experimental data
to support one approach or another. Fig-
ure 4 shows data collected recently when
monitoring the chloramination process
from Region I to II at sample pH of 8–8.5
and temperature around 20˚C. The results
show the specificity that measuring free
ammonia has in demonstrating the tran-
sition between Region I and II, while the
measured free chlorine concentrations
were more erratic during the same transi-
tion. The low absolute levels of free chlo-
rine, along with its transitional nature in
the chloramination process, make it dif-
ficult to pinpoint the moment of the tar-
get change, whereas this change is much
clearer when measuring free ammonia, as
shown in Figure 4.
Based on years of research and the
results of many field studies presented
at water conferences (e.g., see Chlorami-
nation Process Control: Comparing Mon-
itoring Technologies and Techniques
at www.awwa.org/chloramination), the
most reliable way to control chlorami-
nation is by monitoring the target disin-
fectant, monochloramine, as well as free
and total ammonia. Other water quality
parameters, such as free chlorine, etc.,
may serve an auxiliary role and provide
valuable information for process and
instrumentation troubleshooting.
Directly measuring key parameters
with a colorimetric method allows oper-
ators to effectively control monochlora-
mine formation. Implementing online
instrumentation has demonstrated more
efficient process control compared with
intermittent laboratory measurements.
Also, process analyzers built on colo-
rimetric technology deliver accurate,
real-time information to ensure reliable
chloramination control. Overall, compre-
hensive and accurate in-plant chlorami-
nation control helps operators maintain
water quality at point of entry and avoid
unwanted consequences in the distribu-
tion system.
Acknowledgments: The author would
like to express gratitude to Hach col-
leagues for their support and personally
to Luke Johnson for his help with labora-
tory experiments.
Primary Parameters Secondary Parameters Additional Control*
■■ Total residual chlorine (regulatory
reporting)
■■ Monochloramine (process control)
■■ Free ammonia (process control)
■■ Free residual chlorine (process control)
■■ Total ammonia (process control)
■■ pH (process and nitrification control)
■■ Nitrite (nitrification control)
■■ ATP (nitrification control)
■■ Dissolved oxygen (nitrification
control)
Table 4. Key Monitoring Parameters
Analytical parameters for chloramination monitoring and control should be considered for the plant and the water distribution system.
* These monitoring parameters become very important to control nitrification in the distribution system that may occur with formation of extra ammonium in the water, especially in warmer climates that can promote biogrowth.
Disinfection
0.00
0.05
0.10
0.15
0.20
0.25
0.30
0.00
0.50
1.00
1.50
2.00
2.50
3.00
FA,FC—ppm
TC,TA,Mono—ppm
Chloramination—Lab Test (all parameters)
Monochloramine
Total Ammonia
Total Chlorine
Free Ammonia
Free Chlorine
Region I Region II
NH4
+
+Cl2
NH4
+
+ Cl2
(excess)
Figure 4. Lab Results
A recent chloramination study revealed an increasing Cl2:N ratio and exemplifies
multiparameter monitoring.