
Recommended
More Related Content
Similar to Daily Market Insight- 24 june.pdf
Similar to Daily Market Insight- 24 june.pdf (20)
More from BluechipInvestment
More from BluechipInvestment (20)
Recently uploaded
Recently uploaded (20)
Daily Market Insight- 24 june.pdf
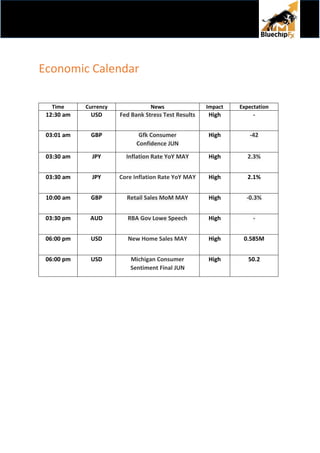
- 1. Economic Calendar Time Currency News Impact Expectation 12:30 am USD Fed Bank Stress Test Results High - 03:01 am GBP Gfk Consumer Confidence JUN High -42 03:30 am JPY Inflation Rate YoY MAY High 2.3% 03:30 am JPY Core Inflation Rate YoY MAY High 2.1% 10:00 am GBP Retail Sales MoM MAY High -0.3% 03:30 pm AUD RBA Gov Lowe Speech High - 06:00 pm USD New Home Sales MAY High 0.585M 06:00 pm USD Michigan Consumer Sentiment Final JUN High 50.2
- 2. AUD/USD TREND: BEARISH Technical Outlook: On the daily chart, the AUD/USD trades near 0.6910 with modest gains. However, we expect a very limited price action as no clear directional bias. Indicators Daily chart Status RSI 40 Bearish STOCHASTIC 12.99 Bearish MACD Below midline Bearish 200 EMA 0.7250 Bearish Outlook Bearish Strategy Action Entry Target 1 Target 2 Stop Loss SELL 0.6910 0.6880 0.6850 0.6940
- 3. NZD/USD TREND: BEARISH Technical Outlook: On the daily chart, NZD/USD pair trades higher on the last trading week as it reclaims 0.6300 mark. Some bounce back is expected in the spot. Indicators Daily chart Status RSI 41 Bearish STOCHASTIC 31 Bearish MACD Below midline Bearish 200 EMA 0.6700 Bearish Outlook Bearish Strategy Action Entry Target 1 Target 2 Stop Loss BUY 0.6305 0.6335 0.6365 0.6275
- 4. EUR/USD TREND: BEARISH Technical Outlook: EUR/USD trades near 1.0550 mark with modest gains. A daily close above-mentioned level will bring more gains. Indicators Daily chart Status RSI 46 Bearish STOCHASTIC 41 Bearish MACD Below midline Bearish 200 EMA 1.1068 Bearish Outlook Bearish Strategy Action Entry Target 1 Target 2 Stop Loss SELL 1.0550 1.0520 1.0490 1.0580 .
- 5. GBP/USD TREND: NEUTRAL Technical Outlook: The GBP/USD pair continues to trade in familiar range with upside capped near 1.2300 level. A sell on rise opportunity to traders. Indicators Daily chart Status RSI 44 Bearish STOCHASTIC 50 Bullish MACD Below midline Bearish 200 EMA 1.3057 Bearish Outlook Neutral Strategy Action Entry Target 1 Target 2 Stop Loss SELL 1.2280 1.2250 1.2220 1.2310
- 6. USD/JPY TREND: BULLISH Technical Outlook: On the daily Chart, USD/JPY find some vital support near 134.50 on the daily chart. A bounce back could happen if the pair trades above 134.80 level. Indicators Daily chart Status RSI 59 Bullish STOCHASTIC 61 Bullish MACD Above midline Bullish 200 EMA 121.18 Bullish Outlook Bullish Strategy Action Entry Target 1 Target 2 Stop Loss BUY 134.80 135.10 135.40 134.50
- 7. USD/CAD TREND: BULLISH Technical Outlook: USD/CAD failed to capitalise on the previous session gains as it trades below 1.3000 level. However, the downside risk is limited in the spot. Indicators Daily chart Status RSI 60 Bullish STOCHASTIC 82 Bullish MACD Above midline Bullish 200 EMA 1.2648 Bullish Outlook BULLISH Strategy Action Entry Target 1 Target 2 Stop Loss BUY 1.2980 1.3010 1.3040 1.2950
- 8. USD/CHF TREND: BEARISH Technical Outlook: USD/CHF on the daily chart takes support near 0.9600 for the past two-session. We expect a range bound price action between 0.9600-0.9650 level. Indicators Daily chart Status RSI 41 Bearish STOCHASTIC 9 Bearish MACD Below midline Bearish 200 EMA 0.9426 Bearish Outlook Bearish Strategy Action Entry Target 1 Target 2 Stop Loss BUY 0.9610 0.9640 0.9670 0.9580
- 9. GOLD TREND: BEARISH Technical Outlook: On the daily chart, XAU/USD trades below the vital support of $1,830 with a negative bias. A selling opportunity for traders in the precious metal below $1,820 level. Indicators Daily chart Status RSI 44 Bearish STOCHASTIC 28 Bearish MACD Below midline Bearish 200 EMA $1,853 Bearish Outlook BEARISH Strategy Action Entry Target 1 Target 2 Stop Loss SELL $1,825 $1,815 $1,805 $1,835