
Recommended
More Related Content
Similar to Daily market Insight-27 June.pdf
Similar to Daily market Insight-27 June.pdf (20)
More from BluechipInvestment
More from BluechipInvestment (20)
Recently uploaded
Recently uploaded (20)
Daily market Insight-27 June.pdf
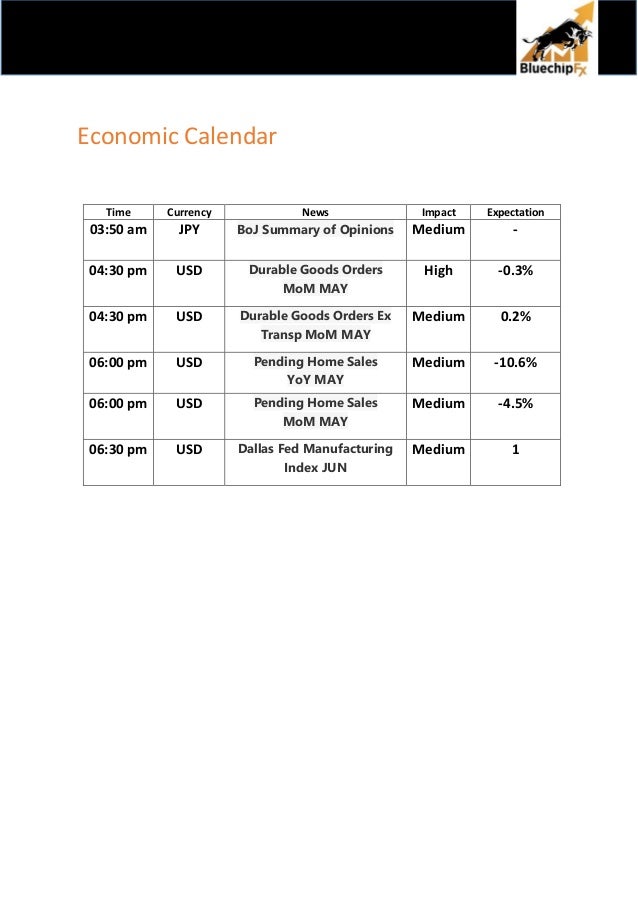
- 1. Economic Calendar Time Currency News Impact Expectation 03:50 am JPY BoJ Summary of Opinions Medium - 04:30 pm USD Durable Goods Orders MoM MAY High -0.3% 04:30 pm USD Durable Goods Orders Ex Transp MoM MAY Medium 0.2% 06:00 pm USD Pending Home Sales YoY MAY Medium -10.6% 06:00 pm USD Pending Home Sales MoM MAY Medium -4.5% 06:30 pm USD Dallas Fed Manufacturing Index JUN Medium 1
- 2. AUD/USD TREND: BEARISH Technical Outlook: On the daily chart, the AUD/USD started the new week on a lower note. The spot trades below 0.6950 psychological level with a negative bias. We expect a range bound session. Indicators Daily chart Status RSI 41 Bearish STOCHASTIC 19 Bearish MACD Below midline Bearish 200 EMA 0.7250 Bearish Outlook BEARISH Strategy Action Entry Target 1 Target 2 Stop Loss SELL 0.6920 0.6890 0.6860 0.6950
- 3. NZD/USD TREND: BEARISH Technical Outlook: NZD/USD trades in a symmetrical triangle pattern, which is a neutral formation. A breakout on either side set the new directional bias. We expect it to trade lower following Aussie. Indicators Daily chart Status RSI 43 Bearish STOCHASTIC 41 Bearish MACD Below midline Bearish 200 EMA 0.6695 Bearish Outlook BEARISH Strategy Action Entry Target 1 Target 2 Stop Loss SELL 0.6310 0.6280 0.6250 0.6340
- 4. EUR/USD TREND: BEARISH Technical Outlook: On the daily chart, the EUR/USD pair trades in an ascending channel. But faces strong resistance in the 1.0570-1.0590 zone. Indicators Daily chart Status RSI 48 Bearish STOCHASTIC 47 Bearish MACD Below midline Bearish 200 EMA 1.1058 Bearish Outlook Bearish Strategy Action Entry Target 1 Target 2 Stop Loss SELL 1.0580 1.0550 1.0520 1.0610 .
- 5. GBP/USD TREND: NEUTRAL Technical Outlook: GBP/USD continuous to exhibits range bound moves with no clear directional bias. The 1.2300 level remains critical to trade as it is a multiple resistance zone. Indicators Daily chart Status RSI 44 Bearish STOCHASTIC 54 Bullish MACD Below midline Bearish 200 EMA 1.3042 Bearish Outlook NEUTRAL Strategy Action Entry Target 1 Target 2 Stop Loss SELL 1.2790 1.2760 1.2730 1.2820
- 6. USD/JPY TREND: BULLISH Technical Outlook: On the first trading day of the week, USD/JPY prints losses as it trades below the crucial 135.0 level. A reliable support placed around 134.50 level. Indicators Daily chart Status RSI 59 Bullish STOCHASTIC 63 Bullish MACD Above midline Bullish 200 EMA 121.46 Bullish Outlook Bullish Strategy Action Entry Target 1 Target 2 Stop Loss BUY 134.50 134.80 135.10 134.20
- 7. USD/CAD TREND: BULLISH Technical Outlook: On the daily chart, the USD/CAD forms an ‘Inverted hammer’ candlestick pattern, a bullish formation. Traders can open long position from lower levels. Indicators Daily chart Status RSI 52 Bullish STOCHASTIC 61 Bullish MACD Above midline Bullish 200 EMA 1.2705 Bullish Outlook Bullish Strategy Action Entry Target 1 Target 2 Stop Loss BUY 1.2850 1.2880 1.2910 1.2820
- 8. USD/CHF TREND: NEUTRAL Technical Outlook: USD/CHF trades in a very tight range of 0.9565-0.9585 in Asian session. A break of the range will decide the further direction for the spot. Indicators Daily chart Status RSI 41 Bearish STOCHASTIC 9 Bearish MACD Below midline Bearish 200 EMA 0.9426 Bullish Outlook NEUTRAL Strategy Action Entry Target 1 Target 2 Stop Loss BUY 0.9560 0.9590 0.9620 0.9530
- 9. GOLD TREND: BEARISH Technical Outlook: On the daily chart, the precious metal shows familiar trading range of $1,830 - $1,840. Trades should follow strict stop-loss while opening position. Indicators Daily chart Status RSI 47 Bearish STOCHASTIC 42 Bearish MACD Below midline Bearish 200 EMA $1,853 Bearish Outlook BEARISH Strategy Action Entry Target 1 Target 2 Stop Loss SELL $1,830 $1,820 $1,810 $1,840 Alternative Strategy Action Entry Target 1 Target 2 Stop Loss BUY $1,840 $1,850 $1,860 $1,830