1. Innovative Government
The City of Baltimore
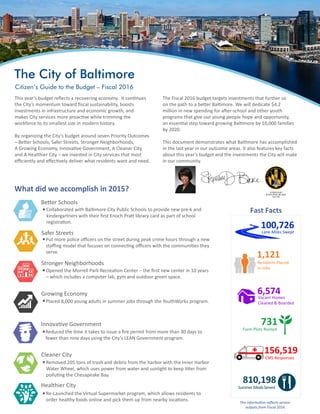
Citizen’s Guide to the Budget – Fiscal 2016
What did we accomplish in 2015?
This information reflects service
outputs from Fiscal 2014.
This year’s budget reflects a recovering economy. It continues
the City’s momentum toward fiscal sustainability, boosts
investments in infrastructure and economic growth, and
makes City services more proactive while trimming the
workforce to its smallest size in modern history.
By organizing the City’s budget around seven Priority Outcomes
– Better Schools, Safer Streets, Stronger Neighborhoods,
A Growing Economy, Innovative Government, A Cleaner City,
and A Healthier City – we invested in City services that most
efficiently and effectively deliver what residents want and need.
The Fiscal 2016 budget targets investments that further us
on the path to a better Baltimore. We will dedicate $4.2
million in new spending for after-school and other youth
programs that give our young people hope and opportunity,
an essential step toward growing Baltimore by 10,000 families
by 2020.
This document demonstrates what Baltimore has accomplished
in the last year in our outcome areas. It also features key facts
about this year’s budget and the investments the City will make
in our community.
Better Schools
Collaborated with Baltimore City Public Schools to provide new pre-k and
kindergartners with their first Enoch Pratt library card as part of school
registration.
Safer Streets
Put more police officers on the street during peak crime hours through a new
staffing model that focuses on connecting officers with the communities they
serve.
Stronger Neighborhoods
Opened the Morrell Park Recreation Center – the first new center in 10 years
– which includes a computer lab, gym and outdoor green space.
Growing Economy
Placed 8,000 young adults in summer jobs through the YouthWorks program.
Reduced the time it takes to issue a fire permit from more than 30 days to
fewer than nine days using the City’s LEAN Government program.
Cleaner City
Removed 205 tons of trash and debris from the harbor with the Inner Harbor
Water Wheel, which uses power from water and sunlight to keep litter from
polluting the Chesapeake Bay.
Healthier City
Re-Launched the Virtual Supermarket program, which allows residents to
order healthy foods online and pick them up from nearby locations.
Fast Facts
Lane Miles Swept
Residents Placed
in Jobs
Farm Plots Rented
EMS Responses
2011
SummerMealsServed
Vacant Homes
Cleaned & Boarded
100,726
1,121
6,574
731
156,519
810,198
2. 2010 5-Year Trend 2014
Kindergarten readiness rate 65% 76%
64% 51%
62% 70%
School attendance rate 90% 90%
92% 91%*
4,419 4,477
417 371
# of Vacant Residential Properties 16,810 16,584
8,520 9,337
% of citizens who walk, bike or take public transit to work, school and shopping 34% 39%
City resident employment rate 59% 60%*
351,633 358,933
# of visitors (in millions) 21 24*
43% 43%
How are we doing?
NEIGHBORHOODS SUSTAINABILITY CITY CHARACTER
OPEN SPACES ECONOMIC VITALITY TRANSPORTATION
SIX STRATEGIC GOALS
% of vendors paid on time 66% 75%
22,849 26,249
City-wide energy use (electricity in billions of kilowatt hours) 1.9 1.7
Water infrastructure reliability (# of water-main breaks and leaks) 950 1,414
Watershed water quality(Bay Health Index) 16% 19%*
947 1,611*
Rate of heart disease (per 100,000 people) 184 291*
3,031 3,132*
3rd grade reading proficiency
BCPS graduation rate
% of citizens who say they feel very safe or safe in their neighborhood (daytime)
Property crime rate (per 100,000 people)
# of shootings
# of permits issued greater than $5,000 (residential and non-residential)
Total # of jobs in Baltimore
% of citizens satified or very satisfied with City services
Recycling rate (tons)
# of drug-related ER visits (per 100,000 people)
# of childhood asthma ER visits (per 100,000 people)
Fire
2013
Water Police
EMS
Rat Control
Trash
80
83
72
83
67
2014
87
What are the most important City Services?
This is a snapshot of the City's key indicators, which represent our most important and difficult challenges. These indicators guide budget
decisions and are the focus of planning, management and community partnerships.
Additional statistics are available in the Fiscal 2016 Agency Detail of the Operating Budget at budget.baltimorecity.gov.
*Fiscal 2013 shown; data for Fiscal 2014 is not yet available.
The Citizen Survey is conducted annually via telephone in both English and Spanish and reaches a representative sample of Baltimore residents. The survey is also available online.
% of residents ranking services as highly important
2014
2014
2014
2014
2014
3. What does it cost to run the City?
21%
14%7%
31%
9% 8% 5%
5%
Transportation
Other
Neighborhood Development
Waste Water
Water
Economic Development
Education Recreation
46% 22%
8%
7%
9%4%
3% 2%
Capital ($673M)
Operating by Outcome ($2.5B)
Cleaner City
Growing Economy
Healthier CityOther
(eg: debt service)
Better Schools
Innovative Government
Safer Streets
Stronger Neighborhoods
The City’s Fiscal Year begins on July 1 and ends on June 30. Baltimore’s budget is required by law to be balanced each year.
Note: These numbers represent the Fiscal 2016 adopted budget. Complete financial information can be found at www.budget.baltimorecity.gov
46%of budget
31%
15%
How is the money spent?
13 788
Where does the money come from?
The General Fund is the City’s largest
fund. It includes all local taxes paid by
residents, businesses and visitors.
Policy-makers have the most management
flexibility over how dollars are spent from
this fund.
53%
12%
17%
18%
22%
What funds does the City manage?
12%
Income Tax
16%
Grants
14%
Local & State
Shared Taxes
Contractual
Services 12%Debt
Service
16%
Grants
4%Materials
& Supplies
The Capital Budget supports projects of
$50,000 or more that are included in the
six-year Capital Improvement Plan.
Enterprise and Utility Funds are used for
operations in which the cost of services is
covered primarily through user charges,
which are determined based on consumption.
Examples are water and wastewater utilities.
Grant Funds are legally required to support
specific programs and initiatives. The City
receives funding from Federal, State and
other special or private grantors.
3%
Other
35%
Property Tax
Charges for
Services
20%
$3.2B
Operating by type of expense ($2.5B)
4. •
•
•
•
•
Cleaner City
Stronger Neighborhoods
Better Schools
Change to Grow
The Ten-Year Plan puts forth policies and programs
that both invest in Baltimore’s growth, and address
long-range challenges in four areas:
• structural budget balance
• tax competitiveness
• infrastructure investment
• long-term liabilities
Since 2013, Baltimore has implemented initiatives
that help in achieving long-term fiscal sustainability
Lowered the Average Property Tax
Reduced Long-Term Liabilities
Increased Capital Investment
Streamlined the Workforce
To address the remaining operating and capital
shortfalls, the City plans to work toward:
• Further healthcare benefit changes
• Right-sizing the City fleet
• Reforming the fire and police pension plan for
• Launching an employee wellness program
• Selling parking garages to build new recreation
What are we investing in for Fiscal 2016?
Healthier City
Improve home-visit, educational services for
first-time and/or high-risk mothers
Hire mentor-coaches to improve Head Start
programming
Support students attending Community Resource
Schools and Out-of-School Time programs
Provide young adults with summer jobs through
YouthWorks
•
•
•
Inspect and bait all rat burrows in Baltimore at
least every 20 days
Launch Charm City Bike Share and invest in
bike infrastructure
Invest in neighborhood infrastructure through
Project INSPIRE
Double the number of clients served at
Community Action Centers
•
•
•
•
Safer Streets
Expand operation of daytime and nighttime
curfew centers
Equip police officers with body-worn cameras
Reduce EMS response time
Provide recently-released offenders with job
training
Begin sweeping neighborhood alleys
Keep trash and debris from clogging storm
drains and reaching the Bay
Expand proactive tree maintenance schedule
Improve water-billing accuracy
•
•
• Support additional in-home interventions
through Community Asthma Program
Align Recreation Center programming with
participant interests
Address health disparities and food access
through Virtual Supermarket
•
•
•
•
Innovative Government
Increase the number of Capital Projects
completed on-time and within budget
Build a comprehensive data warehouse
Train all employees in LEAN government•
•
•
Growing Economy
Improve technology at Job Centers
Double the number of City Food Truck Zones
and streamline the vendor permit process
Support more entrepreneurs through the
Small Business Resource Center
Improve enforcement of the City’s Minimum,
Living and Prevailing Wage laws
•
•
•
Want to Connect?
budget.baltimorecity.gov
@baltimorebudget
Openbudget.baltimorecity.gov
6%
4.6%
25%
$86M
new hires
centers
•
The baseline deficit through 2022 has
been reduced from $745M to $393M.
53%