1. Rural forested areas are becoming increasingly fragmented throughout the United States. (Hammer,
Stewart, Hawbaker, & Radeloff 2009). Larger parcels of land are split into smaller parcels, often to be sold.
This process is known as parcelization. These smaller parcels of land are often converted to different land
uses, leading to increased landscape fragmentation.
This parcelization has been shown to lead to negative environmental effects. They include:
• Reduced wildlife habitat (Theobold, Miller, & Hobbs 1997)
• Reduced water quality (Wear, Turner, & Naiman 1998)
• Reduced capacity to use land for wood products (Mundell, Taff, Kilgore, and Snyder 2010; Germain,
Anderson, & Bevilacqua 2007).
The drivers of parcelization are complex and multi-dimensional. Social, economical and logistical factors
all contribute to parcelization probability. Specific characteristics that have been shown by Kennedy
(2014) to influence parcelization probability include:
In this study, we use GIS analysis to determine the effects these factors and others have on parcelization
in the Town of Delta in Bayfield County, Wisconsin. We use these effects to create a statistical model pre-
dicting future parcelization probability in the Town of Delta. Through these processes, we seek to answer
the following research questions:
1. What effect do multidisciplinary factors have on the likelihood of parcelization in the Town
of Delta?
2. What effect does the size of nearby lakes have on the parcelization likelihood of nearby land?
3. What is the likelihood of future parcel split on a per-parcel basis in the Town of Delta?
• Distance to Amenities
• Land cover
• Land value
• Zoning
• Lake-shore frontage
• Parcel Acreage
An Examination of Factors Influencing Parcelization Probability in the Town of Delta, Bayfield County, Wisconsin
Results
Introduction
Acknowledgments
Sources
Ben Bruening, Timothy Kennedy
Methods Discussion
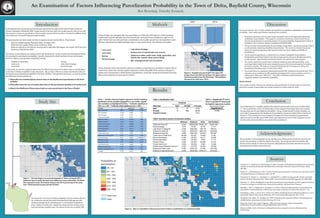
Study Site
Our study site is the Town of Delta in Bayfield County, northern Wiscon-
sin. Landcover consists primarily of forested land interspersed with
wetland and agriculture. Development is concentrated at lakeshore
areas. Delta is amenity rich, containing a large number of lakes and a
high percentage of public land. The nearest urban area is Duluth, MN.
Figure 1. The top image is an aerial photograph of Delta overlayed with a
landcover layer to make the land cover differences more noticeable. The black
lines represent roads. The bottom image is the 2014 parcel map of the same
area. Public parcels are gray, private are blue.
Duluth
Our results indicate that 12 of the variables we tested have a significant relationship to parcelization
probability. Some interesting findings regarding these variables:
• Distance to amenities such as water, roads, and public land are all negatively related with
probability of parcelization. This supports conclusions of previous research which found
that decreased distance to amenities leads to increased probability of parcelization (Haines &
Macfarlane 2011; Hammer, Stewart, Hawbaker, & Radeloff 2009).
• The percentage of developed land, the percentage of agriculture, and the percentage of forest
are all positively related to probability of parcelization. This seems to indicate that parcels
which are more homogeneous with regards to land-use have a higher probability of
parcelization.
• Parcels zoned as agriculture or residential have a higher probability of parcelization
Residentially zoned land is likely to be split as larger parcels of land are divided and sold as
smaller parcels. Agriculturally zoned land is likely to be split for the same purpose.
• The surface area of the nearest lake is positively related to parcel split probability. Land
near larger lakes is likely to be more valuable because of the increased capacity for boating
and other activities. This leads to increased land division for the purpose of selling and
developing (Schnaiberg, Riera, Turner, & Voss 2002).
• Our model shows no significant relationship between MFL enrollment and parcel split. This is
surprising, since enrollment in MFL prohibits development for human residence on the en
rolled parcel. (Wisconsin DNR 2013). Thus, MFL enrollment should intuitively be
negatively related to parcelization probabilty.
Source of error:
-Low number of splits- Because we wanted to study parcelization at a local scale in a recent time
period the number of parcel splits our model is based on is rather small (67 total).
Variable B Significance Exp(B)
Total Land Value** 0.000 0.0000** 1.000
MFL Enrollment -15.285 0.9967 .000
Parcel Acreage -0.028 0.2165 .973
Lake-shore Frontage 0.000 0.6355 1.000
Distance to Water** -0.001 0.0145** .999
Distance to Road** -0.002 0.0012** .998
Travel time to Duluth** 0.214 0.0000** 1.239
Percent developed** 0.042 0.0075** 1.043
Percent agriculture** 0.144 0.0011** 1.155
Percent forest* 0.035 0.0249* 1.035
Percent hydric soils 0.030 0.0864 1.030
Surface area of nearest lake* 0.006 0.0190* 1.006
Shoreland Zoning 18.551 0.9899 113883596.217
Residential zoning* 1.285 0.0183* 3.616
Agricultural zoning* 3.293 0.0222* 26.919
Commercial zoning -16.055 0.9993 .000
Distance to public land* -0.002 0.0073** .998
Distance to agricultural land** 0.001 0.0000** 1.001
Constant -41.297 0.9776 .000
Table 1. Results of binary logistic regression model including
significance of the variables plugged in to our model. Signifi-
cant variables are highlighted in blue. * Indicates significance
(.001< p ≤ .05). **Indicates high significance (p ≤ .001).
• Land cover
• Land value
• Zoning
• Parcel Acreage
• Lake-shore frontage
• Surface area of nearest lake over 4 acres
• Distance to water, public land, roads, agriculture, and
Duluth (the nearest urban area to Delta).
• MFL (managed forest law) Enrollment
2007 2014
Figure 2. Example of a parcel split. The upper left
image is from the 2007 parcel layer, the upper right is
the same location from the 2014 layer. This indicates
the parcel has split since 2014.
Using ArcMap, we overlayed 2007 tax parcel data (n=1028) with 2014 data (n=1036) and deter-
mined which parcels had split over this time period. Each parcel was classified as“split”or“not
split”. Public land was removed from consideration, since public parcels are not expected to split.
We then calculated and added attribute data on a per-parcel basis. The attributes included:
These attributes were examined for adverse correlation using Pearson’s correlation analysis. We en-
tered these values into a binary logistic regression model using IBM’s SPSS statistics software to
obtain each characteristic’s relationship to parcelization. Using this model we predicted the proba-
bility of parcelization for each parcel in Delta.
Lakes
Public Land
54% - 70%
41% - 50%
33% - 40%
25% - 32%
15% - 24%
5% - 14%
0% - 4%
Probability of
parcelization
We would like to thank Bayfield County, the Wisconsin DNR, and the Center for Land-Use Ed-
ucation for providing us with the data for this study. We would also like to thank the UW-
Stevens Point College of Letters and Science Undergraduate Education Initiative for provid-
ing funding for research and travel costs.
Conclusion
Our model found 12 variables significantly related to parcel split in the town of Delta (table
1). This included the surface of nearby lakes, which suggests that larger lakes near a parcel
increase that parcel’s parcelization probability. Using a model based on these variables, we
were able to approximate the likelihood of parcelization of parcels within Delta in the future
(figure 3). This will allow for more targeted management of parcelization by government
agencies such as the Wisconsin DNR, which may help prevent some of the negative environ-
mental and economical effects associated with parcelization.
Germain, R. H., Anderson, N., & Bevilacqua, E. (2007). The effect of forestland parcelization and ownership
transfers on nonindustrial private forestland forest stocking in New York. Journal Of Forestry, 105(8),
403-408.
Haines, A. L., & MacFarlane, D. (2012). Factors influencing parcelization in amenity-rich rural areas. Journal
of Planning Education and Research, 32(81), 81-90.
Hammer, R. B., Stewart, S. I., Hawbaker, T. J., & Radeloff, V. C. (2009). Housing growth, forests, and public
lands in Northern Wisconsin from 1940 to 2000. Journal of Environmental Management, 90, 2690-2698.
Kennedy, T.T. (2014). Modeling the multi-dimensional factors of parcelization and the spatial connection
to land-use change in rural Wisconsin (Doctoral dissertation). Retrieved from Proquest.
Mundell, J., Taff, S. J., Kilgore, M. A., & Snyder, S. A. (2010). Using real estate records to assess forest land
parcelization and development: A Minnesota case study. Landscape and Urban Planning, 94, 71-76.
Schnaiberg, J., Riera, J., Turner, M. G., & Voss, P. R. (2002). Explaining human settlement patterns in a recre-
ational lake district: Vilas County, Wisconsin, USA. Environmental Management, 30(1), 24-34.
Theobald, D. M., Miller, J.R., & Hobbs, N.T. (1997). Estimating the cumulative effects of development on
wildlife habitat. Landscape and Urban Planning, 39, 25-36.
Wear, D.N., Turner, M.G., and R.J. Naiman. 1998. Land cover along an urban-rural gradient:
Implications for water quality. Ecological Applications 8(3): 619-630.
Wisconsin DNR. (2013). Wisconsin’s managed forest law: a program summary. (Publication No.
PUB-FR-295).
Table 2. Classification Table
Observed Split No Split % Correct
Split 10 57 14.92
No Split 14 869 98.96
Overall % Correct 93.5
Predicted
Nagelkerke R2
0.440
Table 3. Nagelkerke R² value.
This is a pseudo R² value used
for logistic regression models.
Table 4. Descriptive statistics of continuous variables
Minimum Maximum Mean Std. Deviation
Total Land Value ($) 0.000 399000.000 50063.127 53240.369
Parcel Acreage 0.010 70.481 18.702 17.317
Lake-shore Frontage (ft) 0.000 3565.560 168.143 408.041
Distance to Water (ft) 0.000 16769.810 2663.234 4246.682
Distance to Road (ft) 0.000 6287.480 545.841 933.887
Travel time to Duluth (min) 58.569 82.220 70.560 6.182
Percent Developed 0.000 100.000 20.371 33.566
Percent Agriculture 0.000 100.000 3.959 17.117
Percent Forest 0.000 100.000 65.606 37.334
Percent Hydric Soil 0.000 100.000 4.828 14.485
Surface Area of Nearest Lake (ac.) 4.053 167.239 59.284 55.808
Distance to Public Land 8.482 8435.122 53.782 1461.463
Distance to Agricultural Land 0.000 18230.082 6760.371 4312.026
Figure 3 . Map of probability of future parcel spit in Delta as predicted by our statistical model.