BP investor update presentation 2014
•
3 likes•6,565 views

Bob Dudley, BP Chief Executive, and members of the executive team, hosted an investor update to the financial community on 4th March 2014

Recommended
Recommended
More Related Content
What's hot
What's hot (20)
Viewers also liked
Viewers also liked (20)
Similar to BP investor update presentation 2014
Similar to BP investor update presentation 2014 (20)
More from bp
More from bp (13)
BP investor update presentation 2014
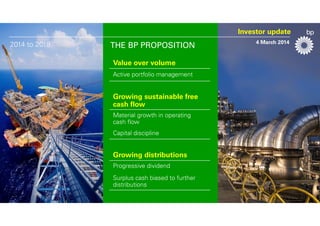
- 1. Investor update 2014 to 2018 THE BP PROPOSITION Value over volume Active portfolio management Growing sustainable free cash flow Material growth in operating cash flow Capital discipline Growing distributions Progressive dividend Surplus cash biased to further distributions 4 March 2014
- 2. Investor update Bob Dudley Group Chief Executive Atlantis, Gulf of Mexico
- 3. Cautionary statement Forward-looking statements - cautionary statement This presentation and the associated slides and discussion contain forward-looking statements – that is, statements related to future, not past events – with respect to the financial condition, results of operations and business of BP and certain of the expectations, intentions, plans and objectives of BP with respect to these items, in particular statements regarding: BP’s expectations regarding key global energy trends to 2035; plans regarding the future divestment of $10 billion in assets by 2015; the prospects for and timing of planned and future divestments; the anticipated delivery of an increase in operating cash flow by more than 50% by 2014 versus 2011; expectations regarding material growth in operating cash flows and growth in free cash flow in 2014 and from 2015 to 2018; prospects for future distributions to shareholders; expectations regarding BP’s plans to separate its Lower 48 oil and gas businesses; expectations regarding an increase in operating cash margins per barrel in Downstream; plans for optimising BP’s portfolio and future portfolio management; expectations and plans arising from BP’s investment in Rosneft, including the expected benefits thereof accruing to BP and expectations regarding future partnership opportunities with Rosneft; plans and expectations regarding BP’s advanced and proprietary technologies and BP’s technology flagship programme; expectations regarding BP’s plans regarding Group simplification and the value expected to be derived therefrom; plans to deliver operating cash flow of $30-$31 billion in 2014 and the drivers thereof; the expected levels of Group production, underlying cash costs, capital expenditures and gearing in 2014 and from 2015 to 2018; expectations for Group ROACE in 2014 and 2015-2016; the timing and composition of planned and future projects including expected Final Investment Decisions, start up, construction, commissioning, completion, timing of production, level of production and margins; expectations regarding the lifespan and future generation of operating cash by major projects; expectations regarding future capital spend by Upstream and Downstream; plans to deliver long term value from the Upstream portfolio; the expected makeup of BP’s asset portfolio in 2018 and its prospects for generating cash flow; expectations regarding BP’s ability to deliver long-term sustainable value from its resource base to 2018; prospects for operating cash growth in Upstream; plans and expectations regarding assets and operations in the North Sea, the Gulf of Mexico, Oman and Azerbaijan; expectations, plans and prospects for future exploration wells and their contribution to long term growth in production; plans to increase efficiency in Upstream; Downstream’s expectations regarding future safety performance, investment, portfolio management, competitive returns, programmes to offset inflationary pressure, material and growing cash flows and future business growth; plans and expectations regarding the Whiting Refinery; expectations for competitive returns from the Petrochemicals segment; BP’s expectation that overcapacity in the petrochemicals market will be progressively absorbed by demand in the future; expectations that the Lubricants business will be a material source of growth for the Group; BP’s longer-term objectives, including in respect of safety and risk reduction, new technologies, efficiency, execution and the Upstream and Downstream segments; and expectations regarding legal and trial proceedings, court decisions, potential investigations and civil actions by regulators, government entities and/or other entities or parties, and the risks associated with such proceedings and BP’s intentions in respect thereof. By their nature, forward-looking statements involve risk and uncertainty because they relate to events and depend on circumstances that will or may occur in the future and are outside the control of BP. Actual results may differ materially from those expressed in such statements, depending on a variety of factors, including the specific factors identified in the discussions accompanying such forward-looking statements; the timing of the receipt of relevant third party and/or regulatory approvals; the timing and level of maintenance and/or turnaround activity; the timing and volume of refinery additions and outages; the timing of bringing new fields onstream; the timing, quantum and nature of certain divestments; future levels of industry product supply, demand and pricing, including supply growth in North America; OPEC quota restrictions; PSA effects; operational problems; economic and financial market conditions generally or in various countries and regions; political stability in relevant areas of the world; changes in laws and governmental regulations; regulatory or legal actions including the types of enforcement action pursued and the nature of remedies sought or imposed; the actions of prosecutors, regulatory authorities and courts; the impact on our reputation following the Gulf of Mexico oil spill; the actions of the Claims Administrator appointed under the Economic and Property Damages Settlement; the actions of all parties to the Gulf of Mexico oil spill-related litigation at various phases of the litigation; exchange rate fluctuations; development and use of new technology; the success or otherwise of partnering; the actions of competitors, trading partners, creditors, rating agencies and others; decisions by Rosneft’s management and board of directors in respect of strategy, operations or otherwise; the actions of contractors; natural disasters and adverse weather conditions; changes in public expectations and other changes to business conditions; wars and acts of terrorism, cyber-attacks or sabotage; and other factors discussed under “Principal risks and uncertainties” in our Stock Exchange Announcement for the period ended 30 June 2013 and under “Risk factors” in our Annual Report and Form 20-F 2012 as filed with the US Securities and Exchange Commission. Reconciliations to GAAP - This presentation also contains financial information which is not presented in accordance with generally accepted accounting principles (GAAP). A quantitative reconciliation of this information to the most directly comparable financial measure calculated and presented in accordance with GAAP can be found on our website at www.bp.com. Statement of Assumptions - The operating cash flow projections in this presentation for 2014 assume an oil price of $100/bbl and a Henry Hub gas price of $5/mmBtu, and, for 2015 to 2018, assume an oil price of $100/bbl and a Henry Hub gas price of $5/mmBtu; real. These projections have been adjusted to (i) remove TNK-BP dividends from 2011 operating cash flow; (ii) include BP’s estimate of Rosneft dividends; and (iii) include the impact of payments in respect of the settlements reached of all criminal and securities claims with the U.S. government. These projections do not reflect any cash flows relating to other liabilities, contingent liabilities, settlements or contingent assets arising from the Gulf of Mexico oil spill which may or may not arise during such periods. As disclosed in the Stock Exchange Announcement for the period ended 31 December 2013, we are not today able to reliably estimate the amount or timing of a number of contingent liabilities. Cautionary note to US investors - This presentation contains references to non-proved resources and production outlooks based on non-proved resources that the SEC’s rules prohibit us from including in our filings with the SEC. U.S. investors are urged to consider closely the disclosures in our Form 20-F, SEC File No. 1-06262. This form is available on our website at www.bp.com. You can also obtain this form from the SEC by calling 1-800-SEC-0330 or by logging on to their website at www.sec.gov. Tables and projections in this presentation are BP projections unless otherwise stated. March 2014 3
- 4. Agenda Group overview • Industry context • Playing to our strengths • The BP Proposition • 3 key drivers − Active portfolio management − Disciplined capital allocation − Safe, reliable and efficient execution Financial framework & outlook Brian Gilvary Upstream Lamar McKay Downstream Iain Conn Q &A All Bob Dudley 4
- 5. Key global energy trends to 2035 By region • Continued strong growth in energy demand By primary use bn toe bn toe 18 • > 90% of growth in non-OECD countries • Oil, gas and coal expected to deliver 81% of global demand by 2035, in similar shares • Industry needs to continue to develop new frontiers and to apply technology and learning By fuel bn toe 18 15 Renew.* Hydro 15 12 18 12 15 Power generation Nuclear 12 Coal 9 Non-OECD 6 9 9 6 OECD 3 Coal Industry Other 3 Gas 3 Gas Oil 6 Oil Transport 0 1990 2005 2020 0 2035 1990 2005 2020 0 2035 1990 2005 2020 2035 *Includes biofuels Source: BP Energy Outlook 2035 5
- 6. Our industry in perspective 25 1950-1972 The ‘Concession Model’ IOC’s dominate 1973-1998 OPEC supremacy NOC’s dominate 1998-2001 Mega-mergers(1) Supermajors formed Production (mmboed) 20 2001-2010 Post-mergers Supermajor momentum 2010+ Shrink or grow? 15 10 5 0 North America Other Americas Europe Middle East Africa Rest of World 1950 1953 1956 1959 1962 1965 1968 1971 1974 1977 1980 1983 1986 1989 1992 1995 1998 2001 2004 2007 2010 2013 North America Other Americas Europe Middle East Africa Rest of World (1) Aggregate production profile as reported. Data prior to 1998 does not include the production of the other legacy companies that combined to form the Supermajors Source: company disclosure; 2013 reflects 2012 regional breakdown 6
- 7. BP is at an inflection point A multi-year journey 2010 - 2011 • • • 2013 Stabilised • • 2012 Reset Re-energised Trust fund established Safety and operational risk organisation in place Upstream re-organised Resumed drilling in Gulf of Mexico 10-point plan announced • • • • Sale of TNK-BP announced $38bn divestments agreed a year earlier than planned Material new access 5 major projects online • • • • • Rosneft and TNK-BP transactions complete Announced further $10bn divestments by end 2015 7 exploration discoveries 3 further major projects online Whiting commissioning complete 7
- 8. Delivering the 10-point plan • Improved safety performance • More focused portfolio: $38bn divestment program completed; a further $10bn of divestments planned by end of 2015 • New future in Russia: completion of Rosneft and TNK-BP transactions • Exploration momentum: spend doubled, prospect inventory reloaded, strong drilling success in 2013 • Major project delivery: 11 major projects started up since start of 2012 • Whiting Refinery Modernisation Project: new units commissioned • Growth in shareholder distributions through increased dividend and share buybacks 8
- 9. US legal proceedings • Focus on our core business − Continue to compartmentalise legal proceedings • Staying the course − Determined to pursue fair outcomes in all legal proceedings − Will contest claims we believe to be unfounded • Balance sheet resilience Gulf of Mexico 9
- 10. Smaller, simpler and more focused Proved reserves(2)(3) Production(1) 30 5 25 20 bn boe mmboed 4 3 15 2 10 1 0 19.75% of Rosneft 5 -0 (1) Production: full-year 2013, as reported in company earnings releases (2) Proved reserves as at 31 Dec 2012 as disclosed in company annual reports, including applicable shares of equity-accounted entities (3) BP reported reserves adjusted to remove 50% ownership in TNK-BP; Rosneft reported reserves adjusted to include 100% of TNK-BP at 31 Dec 2012 10
- 11. Smaller, simpler and more focused Upstream(1) Downstream(2) 88% 91% 65% 85% 68% 62% 50% 47% Operated Installations Operated Wells Operated Pipelines Reserves Refining Capacity Divested (1) (2) Divestments since 2010 Divestments since 2000 (2007 for Lubricants) Retained Petrochemical Lubricants Plant Capacity countries with direct presence Divested Retained Marketing Volumes 11
- 12. Playing to our strengths Geographic balance Unique position in Russia Reloaded exploration pipeline(1) 140,000 40,000 BP net acreage (km2) in key offshore basins 30,000 20,000 Upstream key investment regions Size = 2013 operating cash flow Key regions Other regions Brazil Angola Morocco China GoM Egypt Ceduna India Libya Includes 19.75% of Rosneft Nova Scotia (1) Uruguay 0 Arctic 10,000 Quality Downstream businesses Countries with a material Downstream presence Key manufacturing assets 12
- 13. A unique position in Russia Net production 2013(1) mboed 961 46 163 192 6 Net Russia reserves(2) bn boe 14.3 0.3 0.8 2.8 0.03 Net offshore resources potential in Russia bn boe(3) 48 74 0 1.3 8 (1) (2) (3) Wood Mackenzie data except BP; BP’s share of 2013 Rosneft production annualised to reflect sale of TNK-BP on 1st January 2013 Wood Mackenzie data except BP; BP 19.75% of Rosneft’s year-end 2013 proved plus probable Russia reserves Wood Mackenzie data except BP; Exxon and Statoil, 33% JV shares, Total 25% Shtokman JV share. BP reflects 19.75% shareholding in Rosneft 13
- 14. Playing to our strengths Reloaded exploration pipeline Top 3 key international competitors in selected offshore basins (1)(2) Net acreage (km2) Arctic(3) XOM BP ENI Nova Scotia Libya GoM Deepwater Egypt Nile Delta RDS BP XOM Morocco India BP XOM ENI East coast BP BP RDS COP South China Sea ENI BG CVX BP ENI Brazil BP BP CVX ENI BG Angola BG BP Uruguay (1) BG, Chevron, ConocoPhillips, ENI, ExxonMobil, Shell, Statoil, Total (2) Basin histograms scaled independently (3) Alaska (North Slope), Greenland, Canada, Norway and BP shareholding through Rosneft BP BG TOT TOT STL TOT BP Ceduna CVX BP STL Source: Wood Mackenzie & public filings 14
- 15. Playing to our strengths Upstream: platform for growth Net Asset Value by resource theme % • More deepwater than peers • Balance of liquids and selective investments in gas 100 100% 75 75% • Gas focused where we have − Strong core positions − Premium growth markets 50 50% 25 25% − Advantaged technology 0 0% Deepwater(1) (1) (2) Greater than 400 metres Unconventional includes coal-bed methane, shale gas, heavy oil, oil sands, tight oil Conventional Unconventional & LNG(2) Source: Wood Mackenzie 15
- 16. Playing to our strengths Downstream: quality businesses • Growing free cash flow for the Group • Repositioned Fuels portfolio − Less refining exposure than peers − Divested 13 refineries in 13 years • Premium Lubricants brands • Technology-advantaged Petrochemicals in growth markets Refining capacity Average refinery size Competitor average(2) (1) (2) Ratio of marketing sales to refining capacity Average of ExxonMobil, Shell, Total, Chevron & Phillips 2013 data used for refining capacity and average refinery size. Source: Oil & Gas Journal 2012 data used for marketing cover. Source: derived from company reports Marketing cover(1) BP 2013 BP 2012 16
- 17. Playing to our strengths Distinctive capabilities Technology • • Supports our distinctive portfolio strengths Globally recognised leading technology capability Relationships Stakeholder relationships • People • Recognised as a great employer − Government and NOC’s − Industry partners • Focus on developing talent − Strategic suppliers • − Customers Strong leaders who drive success through BP’s values 17
- 18. 2014 to 2018 The BP Proposition • Value over volume − Active portfolio management • Growing sustainable free cash flow − Material growth in operating cash flow − Capital discipline • Growing distributions − Progressive dividend − Surplus cash biased to further distributions 18
- 19. Three key drivers Active portfolio management 1. Active portfolio management Safe, reliable & efficient execution 2. Disciplined capital allocation 3. Safe, reliable & efficient execution 19
- 20. Active portfolio management Areas of Upstream asset disposals Upstream country exit Divested Downstream assets Downstream Fuels Value Chains exit 20
- 21. Active portfolio management A new model for BP’s US Lower 48 onshore business Upstream total resources • Onshore Lower 48 – a significant resource base • Opportunity to improve competitiveness of our current model • New separate business – – – – Separate management Independent location Own governance, processes and systems Disclosure of financials during 2015 US Lower 48 Wamsutter, Wyoming 21
- 22. Active portfolio management Smaller but more focused on value Upstream Downstream Operating cash flow ($/bbl) Indexed (2011 = 100) Operating cash flow ($/boe) Indexed (2011 = 100) 150 195 140 176 130 157 120 138 110 119 100 100 90 81 2011 2012 2013 Production mboed 2018 2011 2012 2013 2018 Refining capacity mb/d 2,460 2,670 2,680 2,319 2,256 2,091 22
- 23. Disciplined capital allocation Driving quality through choice Capital expenditure split 2014 to 2018 Portfolio of opportunities Downstream & other Disciplined capital expenditure • 2014: $24bn to $25bn Risk • 2015 to 2018: $24bn to $26bn RETURNS Returns RISK Upstream Deliver the project right 23
- 24. Disciplined capital allocation Driving quality through choice Selecting the right project APPRAISE Appraise SELECT Select Develop the project right DEFINE Select FINAL INVESTMENT DECISION Capital Value Process (CVP) Deliver the project right EXECUTE Appraise OPERATE Select Recycle / Exit 24
- 25. Execution: safer, more reliable and increasingly efficient 600 % 1.0 100 Upstream safety events 500 Loss of primary containment incidents 400 Tier 1 process safety events 300 Upstream operating efficiency(1) 0.9 90 0.8 80 200 0.7 70 100 0 n/a 2009 60 0.6 2010 2011 2012 2010 2013 Refining process safety BP Tier 1 process safety event rate 0.3 Competitor range 0.2 2012 2013 (1) BP operated Refining availability BP Solomon availability 100 95% 95 Competitor range 85 85% 0.1 0.0 2010 % 2011 2011 2012 2013 75 75% 2007 2008 2009 2010 2011 2012 2013 25
- 26. Execution Group simplification • Aligning corporate functions to BP’s new footprint – Streamlining the activity set to the smaller portfolio – Simplifying processes and removing duplication • 60 simplification initiatives now running • Extending the reach of Global Business Services • Senior executive governance • Next steps – Benefit scoping during 2014 – Value delivery from 2015 26
- 27. Financial framework & outlook Brian Gilvary Chief Financial Officer DS3 drillship
- 28. Growing sustainable free cash flow 2014: Rebasing operating cash flow Operating cash flow • > 50% growth in operating cash flow in 2014 at $100/bbl versus 2011(1) − Completion of payments into the Gulf of Mexico Trust Fund − Upstream major projects ramp-up − Ramp-up of Whiting Refinery Modernisation Project • Capital expenditure of $24bn to $25bn $3.7bn TNK–BP dividend $18.5bn operating cash 2011 operating cash flow at oil price of $111/bbl $30bn-$31bn operating cash 2014 operating cash estimate at oil price of $100/bbl(1) (1) See Statement of Assumptions under cautionary statement 2014 based upon: $100/bbl oil, $5/mmbtu Henry Hub gas Adjusted to remove TNK-BP dividends from 2011 operating cash flow; 2014 includes BP estimate of Rosneft dividend Includes the impact of payments in respect of the settlement of all criminal and securities claims with the US Government; does not reflect other potential future cash flows arising from the Gulf of Mexico oil spill 28
- 29. Growing sustainable free cash flow 2015 to 2018 • Material growth in operating cash flow − Upstream: extending high value activities in existing operations and continued ramp-up of major projects − • Group-wide efficiency improvements Strong capital discipline − • $24bn to $26bn from 2015 to 2018 Portfolio constantly under review − • Potential operating cash(1) Downstream: full-year benefits of the Whiting upgrade, margin expansion and access to growth markets − Operating cash flow $bn Further $10bn of divestments by end 2015 Gearing target of 10% to 20% 2011 2018 (1) See Statement of Assumptions under cautionary statement 2014 based upon $30bn to $31bn 2015 to 2018: based on $100/bbl Brent and $5mmbtu Henry-Hub gas; real. Based on current portfolio. Includes the impact of payments in respect of the settlement of all criminal and securities claims with the US Government; does not reflect any other potential future cash flows arising from the Gulf of Mexico oil spill 29
- 30. Divestments Additional $10bn divestments by end 2015 $bn 2010 to 2013 divestments $bn 70 12 TNK-BP TNK-BP 27.5 10.0 8 35 TNK-BP 4 1.8 0 0 Net Book Value Disposal gains Disposal proceeds Divestment Divestment programme program to end 2015 Divestments Announced signed to proceeds date 30
- 31. Capital expenditure and returns ROACE(1) 2014 2015 to 2018 Slightly higher versus 2013 Steady growth 2014 2015 to 2018 Upstream ~$20bn ~$20bn to $22bn Downstream ~$3.5bn ~$3bn to $3.5bn ~$1bn ~$0.5bn to $1bn $24bn to $25bn $24bn to $26bn Group ROACE Capital expenditure Other Total Group organic capital expenditure (1) Return on average capital employed = Underlying replacement cost profit less non-controlling interests and finance interest / average capital employed (shareholders equity + net debt) 31
- 32. Growing shareholder distributions Dividend US cents per ordinary share Number of shares 2011 2012 2013 billion 10 19 6 18 4 17 2 16 0 1Q 2014 20 8 2012 15 -4% 32
- 33. Growing sustainable free cash flow Summary 2014 2015 to 2018 Underlying growth Production(1) Moderate underlying growth $30bn to $31bn Operating cash flow(2) Material growth $24bn to $25bn Capital expenditure $24bn to $26bn 10% to 20% Gearing 10% to 20% Progressive Dividend per share Progressive Ongoing buyback programme Buybacks / other distributions Surplus cash biased to distributions (1) (2) Underlying production is based on $100/bbl Brent; Net of forecasted divestment activity and after adjusting for the effects of Abu Dhabi onshore concession expiry. The actual reported number will depend on timing of divestments and project start-ups, OPEC quotas, and PSA effects 2014 Operating cash flow based on $100/bbl Brent and $5/mmbtu Henry Hub. 2015 to 2018 based on $100/bbl Brent and $5/mmbtu Henry Hub; real. Based upon current portfolio. Includes the impact of payments in respect of the settlement of all criminal and securities claims with the US Government; does not reflect any other potential future cash flows arising from the Gulf of Mexico oil spill 33
- 34. Investor update Lamar McKay Chief Executive, Upstream Valhall, North Sea
- 35. Upstream: platform for growth • Improving safety, making operations more reliable • Active portfolio management • Delivering value through − Existing operations − Next wave of major investments − Access, exploration and appraisal • Upstream execution model − Confidence in delivery through functional model − Disciplined capital and cost management 35
- 36. Safer and more reliable operations Upstream recordable injury frequency Upstream operating efficiency and safety(1) 1.8 1.6 1.4 1.2 1.0 0.8 0.6 0.4 0.2 n/a* 0.0 1999 2001 2003 2005 2007 2009 2011 2013 2009 2010 2011 2012 Upstream recordable injury frequency Loss of primary containment G+ International Association of Oil and Gas Producers benchmark 2013 Tier 1 process safety events Operating efficiency (1) BP operated Source: BP data; * Data not available for 2009 36
- 37. Active portfolio management Focused, high quality portfolio • Completed ~$30bn Upstream divestment program • Delivered a smaller, more focused portfolio − Reduced risk footprint − Maintained reserves • Ongoing portfolio management − Significant contributor to Group $10bn forward divestment plan − Continued opportunities for value acceleration beyond 2015 37
- 38. Holding a deep and diverse resource portfolio Resources, bn boe (excluding Rosneft) Resource breakdown Prospect inventory LNG 33 Unconventional oil & gas Non-proved Conventional gas Proved 13 years reserves to production ratio 11 End 2013 Conventional oil (including deepwater) Proved End 2013 Source: Resources as of year-end 2013 38
- 39. Delivering value • From our resource base through − Existing operations Post-tax operating cash flow 2013-2018 $bn − The next wave of major projects − Access, exploration and appraisal • Maintaining capital discipline • Competitive operating cash growth to 2018 − Underlying volume growth − Continued cash margin expansion − Cost discipline 2013 2018 Source: BP estimate 39
- 40. Delivering value from our existing operations Operating cash flow snapshot in 2018 100% Alaska Canada North Sea North Africa & Egypt GoM Post-FID major projects Azerbaijan NAG Pre-FID Gas value chains Other Middle East India Trinidad Deepwater Angola Asia Pacific Azerbaijan Angola Existing Existing assets assets North Sea Southern Cone Giant Giant fields Fields 2013 Operating cash flow Efficient operations Maximising utilisation of infrastructure Extensive resource base Gulf of of Gulf Mexico Mexico Disciplined investment 40
- 41. North Sea Efficient operations • Delivering improved plant reliability • Execution of reliability improvement plans – Magnus – Clair – Foinaven – ETAP Clair • North Sea post-tax operating cash flow $bn Systematic mitigation of future vulnerabilities • Starting up major new oil projects – Quad 204 – Clair Ridge 2013 2018 Source: BP estimate 41
- 42. Gulf of Mexico Maximising utilisation of infrastructure • Only 20% of BP operated resource base produced to date • Focus on infill drilling, managing reservoir pressure and executing brownfield projects • NaKika 10 rigs currently operating, including drilling on all four BP operated hubs – Thunder Horse Atlantis – Atlantis Gulf of Mexico post-tax operating cash flow $bn – Mad Dog – Na Kika • 2013 2018 Source: BP estimate Non-operated infill drilling at Mars, Ursa and Great White 42
- 43. US Lower 48 onshore Unlocking portfolio value • Significant refocusing of our US Lower 48 business over the last three years • Lower 48 - setting the pace for technology, innovation and learning globally • An extensive unconventional resource base with decades of experience in necessary technologies • Wamsutter Potential for improvement when compared to the US independent peer group • Speed of innovation, faster decision making and shorter cycle times necessitate a new business model Utica San Juan Arkoma/ Woodford Fayetteville Anadarko East Texas/ Haynesville Eagle Ford Material position Developed acreage (gross) 5.5 million Number of wells (gross) 21,000 Net resource 7 .6bn boe 43
- 44. Quality investment Next wave of committed projects Average post-tax operating cash flow/boe by start-up date Post-FID projects Point Thomson Kinnoull Quad 204 Clair Ridge Chirag Oil Shah Deniz 2 Sunrise 1 Mars B Na Kika 3 Atlantis North Expansion 2 Oman Khazzan Juniper In Amenas Compression In Salah Southern Fields Western Flank A Gas value chains Deepwater Giant fields CLOV Greater Plutonio 3 Kizomba Satellites 2 2013 segment average Started up in 2014 Material opportunity set Quality resource progression Balanced portfolio 2014-15 start-ups 2016+ post-FID start-ups Cash margin improvement 44
- 45. Deep pipeline of projects 2014 Start-ups Chirag Oil Mars B Na Kika 3 Atlantis North Expansion 2 CLOV Kinnoull Sunrise 1 2015 Start-ups In Amenas Compression In Salah Southern Fields Started up 2016 - 2017 Start-ups Kizomba Satellites 2 Western Flank A Greater Plutonio 3 Point Thomson Quad 204 Clair Ridge Juniper Oman Khazzan West Nile Delta Persephone Thunder Horse South Expansion Post-FID(2) Design Appraisal 2018+ Major projects being progressed Shah Deniz 2 Mad Dog 2 Liberty Pike 1 Sunrise 2 Zinia 2 Tangguh Expansion Angola B18 PCC Browse India KG D6 R-Series Western Flank B India KG D6 Satellites Moccasin Kaskida Tiber West End Development Alaska LNG Alaska Viscous Oil Terre de Grace Greater Clair Snadd Itaipu Angelin Cassia Manakin Angola B31 SE Bourarhat East Nile Delta Low Pressure Hub Salamat Satis Sanga Sanga CBM (1) India KG D6 D55 ACG Future Development (1) Coal Bed Methane (2) Final Investment Decision 45
- 46. North Sea: Quad 204 and Clair Ridge Quad 204 • • • Quad 204 • New FPSO to extend life of Schiehallion field Project ~60% complete. Now in final construction and commissioning stage FPSO out of dry dock and completed installation of all topsides modules Production capacity of 130 mboed; water injection capacity 570 mbd Clair Ridge Clair Ridge Clair Ridge • • • • Second phase of the giant Clair field development Project over 60% complete. Construction ongoing Pre-drilling complete, jackets installed Production capacity of 120 mboed, with provision for future subsea tie-backs 46
- 47. Oman Khazzan and Shah Deniz stage 2 Oman Khazzan • • • Leveraging BP’s North America tight gas expertise to optimize recovery Around 40 tcf of gas and 2bn bbl of condensate initially in place • Stage 2 plans to supply 16 bcma to Georgia, Turkey and Europe • Scalable pipelines enable future gas exports to Europe • Saudi Arabia Plan to develop 7 tcf through 300 wells, delivering a 30% increase in Oman’s current gas supply • UAE Up to 100 tcf of gas in place in block, approximately twice the size of the Australian North West Shelf PSA extension from 2036 to up to 2048 providing the option for the future development of Shah Deniz deep reservoirs Oman Khazzan Arabian Sea Yemen Shah Deniz 2 SCPX TAP & TANAP Shah Deniz field 47
- 48. Long term growth: access, exploration & appraisal Reloaded portfolio and focused drill-out programme Balanced portfolio of options Infrastructure led exploration (ILX) Existing basins New basins 2013 discoveries New basins and plays with higher risk versus reward exposure 2014-2017 key exploration wells Core exploration in existing plays Countries with active exploration or resource appraisal programmes High value ILX infill and tiebacks 48
- 49. Upstream execution model • Functional organisation embedded • Delivering improved execution • Confidence in forward delivery • Efficiency of spend – capital and costs 49
- 50. Global projects and wells 157% 103% 2001-2006 38 projects 2007-2014 25 projects • Continued improvement in both cost and schedule predictability • 1st quartile IPA(2) front end loading for reservoir, facilities and wells for ongoing projects (1) Projects completed or >70% complete (2) Independent Project Analysis Increasing well activity Number of offshore rigs Outcome against FID cost target Predictable projects delivery(1) 2009 2010 2011 2012 2013 • Highest number of offshore rigs since 2008 • Delivering increased new well production • Improving execution efficiency Source: BP data 50
- 51. Global operations BP operated plant efficiency % • Improving plant efficiency through systematic defect elimination 2010 2011 2012 2013 Number of turnarounds • Two-thirds of turnarounds delivered between 2011 and 2013 were on or ahead of schedule • Maintaining a strong focus on process safety and plant integrity 2010 2011 2012 2013 51
- 52. Efficiency of spend: capital and costs • Maintaining capital discipline − Clear capital frame − Rigorous application of Capital Value Process • Efficiency of activity execution • Align overheads to our focused portfolio • Leverage supplier global agreements • New business model for US Lower 48 52
- 53. Upstream: platform for growth Summary • Safer, more reliable operations • Focused, high quality portfolio • Competitive operating cash growth to 2018 • Delivering long term value − Strong resource base with improving performance − Material pipeline of quality projects − Reloaded and balanced exploration prospects • Continued active portfolio management to accelerate value 53
- 54. Downstream Iain Conn Chief Executive, Downstream Coker, Whiting54 refinery
- 55. Building a quality Downstream 2007 – 2013 Transformation inputs • Safe operations and OMS(1) • Behaviours and core processes • Restoring missing revenues and earnings momentum 2014 – 2018 Deliverables • Safety performance • High quality portfolio • Competitive returns • Business simplification • Repositioning cost efficiency (1) Operating Management System • Material and growing cash flows 55
- 56. Portfolio and performance Safety performance High quality portfolio PSER (API Tier 1) Fuels Index 0.3 Petrochemicals Lubricants 100 0.2 Competitor range 0.1 0 Refining capacity BP 0.0 2010 2011 2012 2013 2000 Competitive returns Competitor range 2000 2013 Average plant size 2013 Direct Earnings presence per countries litre 2007 2013 Material and growing cash flows Underlying ROACE % (post-tax) % Plant capacity Average refinery size Competitor average BP 30 Index 350 20 250 10 150 0 2003 2005 2007 2009 2011 2013 50 2007 Post tax operating cash flow Post tax free cash flow Capex Fixed assets 2008 2009 2010 2011 2012 2013 56
- 57. Quality in fuels Global refining quality Size represents absolute scale of refining portfolio Source of competitor data: Oil & Gas Journal 2013 BP data reflects end 2013 Marketing / refining ratio Data reflects ratio of marketing sales adjusted to comparable basis divided by refining capacity Competitor data for 2012 57 Exxon marketing adjusted for supply sales based on historical average
- 58. Feedstock advantage: Whiting refinery Transforms heavy crude capability(1) Accesses advantaged crude differentials(2) (%) ($/bbl) 100 40 30 Brent-WTI differential 20 50 10 WTI-Canadian heavy differential 0 0 Before Heavy, hi-TAN crude Medium, sour crude After 2007 Feb 2014 Heavy, sour crude Light, sweet crude (1) Reflects feedstock capability of new refinery optimized configuration Actual throughputs will depend on prevailing crude differentials, product demand and margin opportunities (2) Rolling yearly average of daily prices . Source : Platts 58
- 59. Quality in petrochemicals PTA manufacturing cost index Global demand index 1,400 PTA (1) 1,200 1,000 Acetic acid (2) 800 600 Primary chemicals (3) 1980's Plants 1990's Plants Zhuhai 1 Zhuhai 2 Zhuhai 3 Industry Best average available Acetic acid manufacturing cost index(4) 400 200 0 1990 (1) (2) (3) (4) 1995 2000 2005 2010 2015 2020 Purified Terephthalic acid global demand . Source : PCI Acetic acid global demand . Source : IHS Feedstocks used for the downstream petrochemical industry. Source: IHS $100/bbl, $5/mmbtu environment High cost Avg. cost methanol methonal carboncarbonylation ylation Cativa Cativa XL SaaBre Industry average Best available 59
- 60. Petrochemicals technology and returns Proprietary technologies 30% Return on sales (%) 20% 10% 0% -10% PTA: iSox PX: INNOCRYS (1) Range of companies with low-cost gas supply as feedstock (2) Range of Petrochemical companies with focused operating assets in Asia (3) Average of both advantaged feedstock and Asia focused competitors -20% 2007 2008 2009 2010 2011 2012 Advantaged feedstock competitor range (1) Asia focused competitor range (2) Combined competitor average (3) BP 2013 60
- 61. Quality in lubricants Brand Return on sales (%) 20 15 Fuchs(1) BP 10 Valvoline Median of consumer sector companies(2) 5 Technology Customer relationships 0 2007 2008 (1) Fuchs 2013 data reflects 1Q - 3Q 2013 (2) Based on performance of 3,500+ consumer products goods companies (2012 from the FactSet database) 2009 2010 2011 2012 2013 61
- 62. Growth markets and premium lubricants Earnings growth ($m) (1) Premium lubricants (%) (2) 1500 50 ROW 1000 Industry BP 40 BRIC 30 500 20 OECD 0 2007 2013 10 0 2010 2011 (1) Pre-tax underlying replacement cost profit (2) BP estimates based on available competitor data and internal analysis from 2013. Industry data from Kline Study 2014 Expressed as a percentage of total automotive engine lubricants sales 2012 2013 62
- 63. Competitive returns Underlying ROACE % (post-tax) (1) Underlying net income ($/bbl) (3) 30 6 25 5 20 4 15 3 10 2 5 1 0 2003 2004 2005 2006 2007 2008 2009 2010 2011 2012 2013 0 2003 2004 2005 2006 2007 2008 2009 2010 2011 2012 2013 Competitor average (2) BP Competitor range (2) (1) BP and competitor return on average capital employed data adjusted to a comparable basis on the data available. For 2013, some competitor data is estimated (2) Competitor set comprises downstream segments of supermajors. Chevron and Total encompass full downstream spectrum (3) Capacity as stated in F&OI / company disclosures 63
- 64. Material and growing cash flows Sources of growth • • • • • • • • Post-tax operating cash flow Feedstock advantage Retail quality Trading and supply capability Petrochemicals technology Distinctive brands and offers Premium lubricants Exposure to growth markets Cost efficiency Lubricants, petrochemicals & fuels growth WRMP(1), Whiting outage & divestments Capital discipline • 2009 - 2013: • 2014 - 2018: $4 - 5bn pa $3 - 3.5bn pa (1) Whiting Refinery Modernisation Project 2013 2018 64
- 65. Quality Downstream Summary 2014 – 2018 Deliverables • Safety performance • High quality portfolio • Competitive returns • Material and growing cash flows 65
- 66. Summary Bob Dudley Group Chief Executive Magnus, North Sea
- 67. 2014 to 2018 The BP Proposition • Value over volume − Active portfolio management • Growing sustainable free cash flow − Material growth in operating cash flow − Capital discipline • Growing distributions − Progressive dividend − Surplus cash biased to further distributions
- 68. Q&A Bob Dudley Group Chief Executive Brian Gilvary Chief Financial Officer Iain Conn Chief Executive, Downstream Lamar McKay Chief Executive, Upstream