Comparison of Mesh Type Seismic Retrofitting for Masonry Structures
14WCEE Paper S12-001
1. The 14th
World Conference on Earthquake Engineering
October 12-17, 2008, Beijing, China
SEISMIC TESTING OF A FULL-SCALE
WOOD STRUCTURE ON TWO SHAKE TABLES
I.P. Christovasilis,1
A. Filiatrault 2
and A. Wanitkorkul 3
1
Graduate Research Assistant, Dept. of Civil, Structural and Environmental Engineering,
University at Buffalo, State University of New York, Buffalo, NY 14260, USA.
Email: ipc@buffalo.edu
2
Professor, Dept. of Civil, Structural and Environmental Engineering,
University at Buffalo, State University of New York, Buffalo, NY 14260, USA.
3
Senior Structural Engineer, Connell Wagner (Thailand), Bangkok 10110, Thailand.
ABSTRACT
An impediment to the development of performance-based seismic design for woodframe buildings is the lack of
understanding of the factors that affect the seismic behavior of woodframe structural systems. Few numerical
seismic analysis models capable of considering all the factors influencing the seismic behavior for
three-dimensional woodframe structures currently exist. Furthermore, only limited experimental data have been
generated at the system level and never on a structure with realistic dimensions. This paper discusses the results of
a shake table testing program on a full-scale woodframe structure conducted within the NSF-funded NEESWood
Project.
The test structure considered was a full-scale two-story townhouse, having approximately 170 m2
of living space
with an attached two-car garage. It was assumed to be located on a level lot with a slab-on-grade and spread
foundations and to have been built as a “production house” in either the 1980’s or 1990’s, located in either
Northern or Southern California. The design was based on engineered construction. The size and weight of the test
structure required for the first time the simultaneous use of the two three-dimensional shake tables at the Structural
Engineering and Earthquake Simulation Laboratory (SEESL) at the University at Buffalo.
The testing program focused on the various construction elements that have significant influence on the seismic
response of woodframe buildings. Five different testing phases were conducted to investigate the influence of the
following elements on the seismic behavior: Phase 1 - Engineered wood structural (shear) walls alone; Phase 2 -
Wood structural walls incorporating viscous fluid dampers; Phase 3 - Installation of gypsum wallboards to
engineered wood structural walls; Phase 4 - Installation of gypsum wallboards to interior partition walls and
ceilings; and Phase 5 - Installation of stucco as exterior wall finish.
KEYWORDS: Buildings, Wood structures, Seismic tests, Shake table tests
1. INTRODUCTION
While light-frame wood buildings have historically performed well with regard to life-safety requirements in
regions of moderate-to-high seismicity, these types of low-rise structures have sustained significant structural and
nonstructural damage in recent earthquakes. For example, the property loss to light-frame wood construction
during the 1994 Northridge earthquake in California was estimated to be US $20 billion (Kircher et al. 1997) and
greatly exceeded the losses associated with any other type of construction. One reason for this substantial level of
damage is believed to be that current building code seismic design requirements for engineered wood construction
around the world are not based on a performance-based design philosophy. Rather, wood elements are designed
independently of each other without enough consideration of the influence that their stiffness and strength have on
the other components of the structural system. Furthermore, load paths and dynamic response in light-frame wood
construction arising during earthquake shaking are not well understood. These factors, rather than economic
considerations, have limited the use of wood to low-rise construction and, thereby, have reduced the economical
competitiveness of the wood industry in the U.S. and abroad relative to the steel and concrete industries.
2. The 14th
World Conference on Earthquake Engineering
October 12-17, 2008, Beijing, China
A major impediment to the development of performance-based seismic design for light-frame wood buildings is
the lack of a complete understanding of the factors that affect the seismic behavior of light-frame wood structural
systems. Few numerical seismic analysis models capable of considering the multiple factors influencing the
seismic behavior of three-dimensional light-frame wood structures currently exist (e.g. Tarabia and Itani 1997,
Collins et al. 2005). Furthermore, only limited experimental seismic response data have been generated at the
building system level (e.g. Filiatrault et al. 2002, Mosalam et al. 2002, White and Ventura 2007) and never on a
light-frame wood building of realistic dimensions.
This paper discusses the results of a shake table testing program on a full-scale light-frame wood structure
conducted within the NSF/NEES-funded NEESWood Project (http://www.engr.colostate.edu/NEESWood/). The
main objective of this experimental study was to contribute toward a better understanding of the seismic behavior
of light-frame wood structures typically built in North America. A significant task of this investigation focused on
the effect of interior (gypsum wallboard) and exterior (stucco) finishes, applied to the surfaces of structural wood
shear walls and to interior partition walls and ceilings, on the seismic response of the building.
2. DESCRIPTION OF TEST BUILDING
The full-scale test building considered in this study is one of the four California-style index buildings designed
within the recently completed CUREE-Caltech Woodframe Project (Reitherman et al. 2003). It represents one unit
of a two-story townhouse containing three units, having approximately 170 m2
(1800 ft2
) of living space with an
attached two-car garage. Figure 1 shows plan views of the first and second floor of the test building. The major
structural components of the test building are identified on the figure and are described in detail by Christovasilis et
al. (2007). The footprint of the test building is 7 m x 18 m. The height of the test building from the first floor slab
to the roof eaves is 5.3 m and its total weight is 320 kN (32 metric tons).
All walls of the structure were built with 38 mm x 89 mm (2x4) Hem-Fir studs except for the North, South and
West walls of the garage where 38 mm x 140 mm (2x6) studs were used. The exterior walls were covered on the
outside with 22-mm thick stucco over 11-mm thick OSB sheathed shear walls and 12-mm thick gypsum wallboard
on the inside. Eight penny common nails (3.3 mm in diameter x 63.5 mm long) with spacing of between 75 mm to
150 mm along panel edges and 150 mm along interior studs were used to connect the OSB sheathing to the wood
framing. Construction details regarding the two-story townhouse building are given by Reitherman et al. (2003)
and Christovasilis et al. (2007). The 12-mm thick gypsum wallboard panels were installed on all interior walls and
ceiling surfaces and on both sides of interior partitions. The panels were oriented horizontally on the walls and
fastened with #6-32-mm long drywall screws spaced at 400 mm along the vertical studs only (no fastening along
the top and bottom plates). The ceiling panels were fastened with the same screws spaced at 300 mm on center.
The stucco was attached to the wood framing by a galvanized 16-gage steel wire lath, fastened to the OSB
sheathing and vertical studs by 38-mm long staples spaced at 150 mm on center. The construction of the building
was conducted by professional contractors to replicate field conditions.
3. SHAKE TABLE TEST PROGRAM
3.1 Experimental Setup
The twin re-locatable, 50-ton, tri-axial shake tables of the Structural Engineering and Earthquake Simulation
Laboratory (SEESL) at the University at Buffalo (UB) were utilized for the experiment. The two tables acting in
unison were required to accommodate the size and weight of the full-scale test building. The 7 m x 7 m extension
steel frames available on both of the UB-SEESL shake tables were connected together by a steel link structure to
support the entire woodframe structure across the two shake tables with minimal vertical deflection. Threaded
A-307 steel rods bolted to the existing extension frames were used as anchor bolts for the sill plates. A 60-mm
thick layer of grout was installed on top of the steel base beneath the pressure treated sill plates to simulate the
friction of the sill plate against a concrete foundation. Seismic holdowns were installed at the end of various first
level narrow wall piers, as shown in Figure 1.
3. The 14th
World Conference on Earthquake Engineering
October 12-17, 2008, Beijing, China
3.2 Testing Protocol
Multiple seismic tests were conducted for various configurations of the test building. Table 1 presents a summary
of the five seismic test phases included in the test program and the corresponding configurations of the test
building. Low amplitude white noise tests were also conducted between the seismic tests of each phase to
determine the changes in the dynamic characteristics (natural periods, mode shapes and damping) of the test
building as it experienced increasing levels of damage during each test phase. The building was repaired after each
test phase to return the lateral load-resisting system to its original characteristics before the start of each subsequent
test phase. These repairs included replacing some of the OSB panels, gypsum wallboards and wood studs. Note
that all test phases were performed for a constant mass of the test building by incorporating ballast weights at the
floor level for the test phases in which some of the wall finish materials were omitted. In this paper, only Phases 1,
3, 4 and 5 are discussed. Information on Test Phase 2, incorporating fluid dampers in selected locations of the test
building, is available in Shinde et al. (2007). Test Phases 1, 3, 4 and 5 were designed to evaluate the effect of
interior and exterior wall finishes on the seismic response of the test building. In Phase 1, the test building
incorporated only the wood structural members without any wall finishes. In Phase 3, 12-mm thick gypsum
wallboards were applied to the interior surfaces of the structural perimeter walls and to both sides of the two
interior structural shear walls, located at the fist level of the test building in the North-South direction (see Fig. 1).
In Phase 4, gypsum wallboards were also applied to all interior partition walls and ceilings. Finally, in Phase 5,
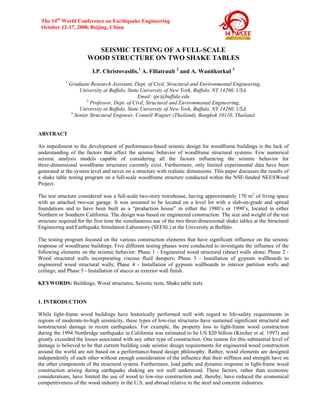
3-coat, 22-mm thick, stucco was applied to the exterior walls. Figure 2 shows photographs of the Phase 1 and
Phase 5 test building ready for testing on the shake tables.
Table 1. Test phases and building configurations.
Test Phase Test Building Configuration
1
2
3
4
5
Wood structural elements only
Test Phase 1 structure with passive fluid dampers incorporated into selected wood sheathed walls
Test Phase 1 structure with 12-mm thick gypsum wallboard installed with #6-32-mm long screws
@ 400 mm on center on structural wood sheathed walls
Test Phase 3 structure with 12-mm thick gypsum wallboard installed with #6-32-mm long screws
on all walls (400 mm on center) and ceilings (300 on center)
Test Phase 4 structure with 22-mm thick stucco installed with 16 gage steel wire mesh and 38-mm
long leg staples @ 150 mm on center on all exterior walls
Figure 1. Plan views of test building.
a) b)
Figure 2. Test building on shake tables: (a) without wall finishes –Phase 1, and (b) with wall finishes –Phase 5.
4. The 14th
World Conference on Earthquake Engineering
October 12-17, 2008, Beijing, China
3.4 Input Ground Motions
Two different types of tri-axial historical ground motions were used for the seismic tests: ordinary ground motions
and near-field ground motions. The ordinary ground motions represented a Design Earthquake (DE) having a
probability of exceedance of 10% in 50 years (10%/50 years), or equivalently, a return period of 475 years. The
1994 Northridge Earthquake ground motions recorded at Canoga Park, with an amplitude scaling factor of 1.20,
were selected as the DE (Krawinkler et al. 2000). The near-field ground motions represented a Maximum Credible
Earthquake (MCE) having a probability of exceedance of 2% in 50 years (2%/50 years), or a return period of 2475
years. The unscaled 1994 Northridge Earthquake ground motions recorded at Rinaldi were selected as the MCE
(Krawinkler et al. 2000). Figure 3 presents the absolute acceleration response spectra at 5% damping for these two
(unscaled) tri-axial seismic records.
In addition to the DE and MCE hazard levels, the Canoga Park ground motions were scaled to simulate hazard
levels of 99.9%/50 years, 50%/50 years and 20%/50 years, associated with scaling factors of 0.12, 0.53, and 0.86,
respectively. Five seismic test levels were considered during each phase of seismic testing. For each seismic test
level, two seismic tests were conducted: one tri-axial (3D) test followed by one horizontal bi-axial (2D) test. Note
that during Test Phases 1, 3 and 4, only Seismic Test Levels 1 and 2 were conducted in order to limit the damage of
the test building to a repairable level. The structure was not repaired between test levels.
a) b)
Figure 3. Absolute acceleration response spectra at 5% damping of earthquake ground motions used in seismic
tests (a) Canoga Park Record, and (b) Rinaldi Record.
4. RESULTS OF AMBIENT VIBRATION TESTS
Before and after each seismic test, the dynamic properties of the test building were estimated by simulated ambient
vibration tests. For this purpose, the test building was excited by a low-level white-noise base acceleration input
having a flat (i.e. uniform) spectrum with 0.5–50 Hz frequency band and a Root Mean Square (RMS) amplitude of
less than 0.10 g. The natural periods, mode shapes and associated modal damping ratios were determined through
Transfer Functions (TFs) of the story acceleration response of the structure and the base motion. Thirty two
horizontal accelerometers, located at the floor and roof levels of the test building, as well as four accelerometers
located on the twin shake tables, were used to generate the TFs for each white noise test. The equivalent viscous
damping ratios of the test building were determined using the well known half-power bandwidth method (see e.g.
Clough and Penzien 1993) applied to the peaks of the TFs.
Figure 4 shows the initial fundamental periods and mode shapes in each principal direction of the test building
before the beginning of Test Phases 1, 3, 4 and 5, respectively. Not surprisingly, the fundamental periods of the test
building are significantly longer in its transverse (North-South) direction than in its longitudinal (East-West)
direction. The introduction of gypsum wallboard finishes on the structural walls in Test Phase 3 causes a reduction
in the fundamental period of 9% and 5% along the transverse and longitudinal directions of the test building,
5. The 14th
World Conference on Earthquake Engineering
October 12-17, 2008, Beijing, China
respectively. These results indicate that introducing gypsum wallboard finishes on the interior surfaces of the
structural walls increased the lateral stiffness of the test building. On the other hand, the introduction of similar
gypsum wallboard finishes to all the interior partition walls and ceilings in Test Phase 4 had no effect on the
fundamental periods and, thereby, the lateral stiffness of the test building (at least at low levels of shaking). This
lack of positive effect can be attributed to the lack of structural connections between the interior partition walls and
the floor and roof diaphragms of the test building.
The introduction of stucco on the exterior walls of the test building in Phase 5 causes a reduction in the
fundamental period of 3% and 9% along the transverse and longitudinal direction of the test building compared to
the Phase 4 configuration. In terms of equivalent lateral stiffness, Phase 5 exhibits an increase in lateral stiffness of
29% and 32% along the transverse and longitudinal directions, respectively, compared to the original Phase 1
building. For both directions, the deformations are concentrated in the first level of the test building, indicating the
potential for a weak first story collapse mechanism. The fundamental mode shapes in the longitudinal direction are
also affected by torsional response and by the in-plane shear deformations of the floor diaphragm in the stair core
area between the two main units of the townhouse, particularly for the Phases 1 and 3. For Phases 4 and 5, the
shear deformations of the diaphragm are reduced because of the in-plane stiffness provided by the gypsum ceilings.
Figure 5a illustrates the deterioration of the equivalent lateral stiffness in the transverse (North-South) direction of
the test building through the various seismic tests conducted, assuming a single-degree-of-freedom response of the
test building. Since the initial fundamental period is known, as well as the fundamental period measured after each
seismic test, the normalized equivalent lateral stiffness, after each seismic test, can be calculated as a percentage of
the initial lateral stiffness. The deterioration of the lateral stiffness is more pronounced for the Test Phase 1
configuration. The stiffness at the end of this phase dropped to less than 60% of the initial stiffness after Test Level
2. The lateral stiffness for the structures of Test Phases 3 and 4 was above 80% of their initial stiffness after Level
2 test; the corresponding value for the Test Phase 5 structure was above 90%. Even after the tri-axial DE Seismic
Level 4 test, the lateral stiffness of the Test Phase 5 structure remained above 75% of its initial lateral stiffness. The
deterioration was smaller when wall finishes were applied for the same level of simulated ground shaking. Note
that the increase of the stiffness that is observed after the final tri-axial test of Seismic Level 5 of Test Phase 5 was
due to the repair of damaged anchor bolts in the two walls on the West (garage wall) and East side of the first floor
of the benchmark structure, prior to the execution of the Level 5 tri-axial test, which resulted in a stiffer structure.
Figure 5b shows the variations of the first modal equivalent viscous damping ratio measured in the North-South
direction of the test building after each seismic test conducted. The first modal damping ratios range from 10 to
20% of critical, with a mean value of around 15% of critical for all test phases.
5. RESULTS OF SEISMIC TESTS
5.1 Global Hysteretic Responses
Figure 6a shows the global hysteretic responses (base shear force vs relative horizontal displacement at the center
of the roof eave level) of the test building during Test Phases 1, 3, 4 and 5, respectively and under Seismic Test
Level 2. The base shear was computed by summing the inertia forces at each level of the test building based on
horizontal acceleration recordings. The maximum base shear and displacement achieved in each direction are
indicated by circles on each graph. As expected, the lateral displacements in the transverse (North-South) direction
are significantly larger than those in the longitudinal (East-West) direction. In Test Phase 1, the wood-only
building experienced a peak roof displacement of 63 mm (1.3% building drift) in its transverse direction under the
Seismic Test Level 2 representing excitation intensity of 44% of that expected for the Level 4 Design Earthquake
(DE). The introduction of gypsum wallboard finishes on the structural walls in Test Phase 3 resulted in a
significant reduction in transverse roof displacements (approximately 44% reduction compared to the wood-only
building of Phase 1). The overall hysteretic response of the building in Test Phase 3 is also stiffer than that of Test
Phase 1, indicating the important effects that the gypsum wallboard had in stiffening the structural walls. The
introduction of gypsum wallboard on the interior partition walls and ceilings in Test Phase 4 resulted in a further
reduction of 29% in roof displacements in the transverse direction (35 mm in Phase 3 vs 24 mm in Phase 4).
Finally, the introduction of stucco on the exterior walls reduced the roof displacements even further to 18 mm;
similar results are observed in the longitudinal direction. Note in Fig. 6a that only moderate pinching is observed
6. The 14th
World Conference on Earthquake Engineering
October 12-17, 2008, Beijing, China
for the transverse (North-South) direction in the wood-only Test Phase 1 building, while almost linear elastic
responses are observed for Test Phases 3, 4 and 5. This result indicates that the wall finishes not only reduced the
displacement response of the test building but changed also its overall hysteretic characteristics. Figure 6b shows
the global hysteretic responses obtained with the complete (Phase 5) building under Test Levels 4 (DE) and 5
(MCE), respectively. In the transverse (North-South) direction, the maximum roof displacement reached 41 mm
(0.8% drift) under the DE level and 101 mm (1.9% drift) under the MCE level. Note that the wood-only building of
Phase 1 exhibited, under Test Level 2, a peak roof displacement larger than the Phase 5 building under the DE Test
Level 4.
Figure 4. Initial natural periods and mode shapes of test building
0
5
10
15
20
25
30
0 1-3D 1-2D 2-3D 2-2D 3-3D 3-2D 4-3D 4-2D 5-3D
Seismic Level andDirection
PercentageofCr.Damping(%)
Phase 1 Phase 3
Phase 4 Phase 5
0
5
10
15
20
25
30
0 1-3D 1-2D 2-3D 2-2D 3-3D 3-2D 4-3D 4-2D 5-3D
Seismic Level andDirection
PercentageofCr.Damping(%)
Phase 1 Phase 3
Phase 4 Phase 5
50
60
70
80
90
100
0 1-3D 1-2D 2-3D 2-2D 3-3D 3-2D 4-3D 4-2D 5-3D
Seismic Level andDirection
NormalizedLateralStiffness(%)
Phase 1
Phase 3
Phase 4
Phase 5
50
60
70
80
90
100
0 1-3D 1-2D 2-3D 2-2D 3-3D 3-2D 4-3D 4-2D 5-3D
Seismic Level andDirection
NormalizedLateralStiffness(%)
Phase 1
Phase 3
Phase 4
Phase 5
a) b)
Figure 5. (a) Variations of normalized lateral stiffness in North-South direction of test building, and
(b) Variations of first modal damping ratios in North-South direction of test building.
East-West
North-South
Test Phase 1
Central Roof Displacement (mm)
BaseShearForce(kN)
East-West
North-South
Test Phase 3
East-West
North-South
Test Phase 1
Central Roof Displacement (mm)
BaseShearForce(kN)
East-West
North-South
Test Phase 3
East-West
North-South
Test Level 4 (DE)
Central Roof Displacement (mm)
East-West
North-South
Test Level 5 (MCE)
East-West
North-South
Test Level 4 (DE)
Central Roof Displacement (mm)
East-West
North-South
Test Level 5 (MCE)
East-West
North-South
Test Phase 4
Central Roof Displacement (mm)
East-West
North-South
Test Phase 5
East-West
North-South
Test Phase 4
Central Roof Displacement (mm)
East-West
North-South
Test Phase 5a) b)
Figure 6. Global hysteretic responses of test building, (a) Test Level 2, and (b) Test Phase 5
7. The 14th
World Conference on Earthquake Engineering
October 12-17, 2008, Beijing, China
5.2 Response of Garage Wall Line
The seismic response of the test building in its transverse (North-South) direction was significantly influenced by
the response of the garage wall line at the first level. The narrow wall piers (aspect ratio of 2.5:1) on each side of
the garage opening compounded by the significant torsional response of the building under high intensity shaking,
caused this garage wall line to experience the largest inter-story drifts.
Figure 7a shows the inter-story drift time-histories measured along the garage wall line during Test Phases 1, 3, 4,
and 5, respectively and under Seismic Test Level 2. The garage wall line of the wood-only building of Phase 1
experiences a peak relative displacement of 42 mm (1.5% inter-story drift) which corresponds to 65% of the total
building drift developed in the transverse direction during this test (see Fig. 6a). This result indicates that most of
the transverse lateral displacements of the test building in the garage wall line occurred at the first level, which
suggests a possible soft-story collapse mechanism under higher amplitude base excitations. Note that this
conclusion is valid for the garage wall line only under high level of excitations. For some other wall lines in the
building, the second story inter-story drifts could be greater than the first story in some cases under lower
amplitude excitation. Again, the introduction of gypsum wallboard finishes on the structural walls in Test Phase 3
caused a significant reduction in the peak drift experienced by the garage wall line (42% reduction compared to the
wood-only building of Phase 1). The response of the Test Phase 4 building, however, is almost identical to that of
Phase 3. This can be explained by the fact that very little interior partition wall lines were incorporated in the first
level of the test building (see Fig. 1). The incorporation of exterior stucco finish also caused a significant reduction
in the peak drift experienced by the garage wall line (66% reduction compared to the wood-only building of Phase
1 and 42% reduction compared to the Phase 3 building).
Figure 7b shows the inter-story drift time-histories measured along the garage wall line of the completed Test
Phase 5 building under Seismic Test Levels 4 (DE) and 5 (MCE), respectively. The Test Phase 5 building
experienced peak relative displacements at the garage wall line of 33 mm (1.2% inter-story drift) and 86 mm (3.1%
inter-story drift) under the DE and MCE levels, respectively. Note again that the wood-only Phase 1 building
experienced higher drifts at the garage wall line under Test Level 2 (44% DE) than the complete Test Phase 5
building under Test Level 4 (100% DE). This result again underscores the significant contribution of the wall
finishes in improving the seismic response of the test building.
6. CONCLUSIONS
The shake table testing of a full-scale, light-frame wood building conducted in this study has provided an
opportunity to study various parameters that influence the seismic response of light-frame wood buildings. This
paper has concentrated on the effect of interior and exterior wall finishes during earthquake excitation. Based on
the experimental results obtained, it can be concluded that the installation of gypsum wallboard to the interior
surfaces of structural wood sheathed walls improved substantially the seismic response of the test building. The
application of exterior stucco further improved the seismic response of the test building, particularly in its
longitudinal direction, where the shear response of the wall piers dominated.
These shake table test results provide the evidence of the significant influence that wall finish materials have on the
behavior of lateral load-resisting systems in light-frame wood construction. The development of a
performance-based seismic design methodology that takes into account the effect of wall finish materials is
urgently needed. Several issues need to be addressed before these materials can be effectively considered in design.
For example, the method of attachment of stucco to the wood framing should be examined in order to evaluate
current practices and possibly develop improved attachment methods that could mobilize the lateral stiffness and
strength of stucco for the sequence of earthquakes that a light-frame wood building could experience during its life
span.
8. The 14th
World Conference on Earthquake Engineering
October 12-17, 2008, Beijing, China
Test Level 4 (DE)
Test Level 5 (MCE)
Test Level 4 (DE)
Test Level 5 (MCE)
Test Phase 4
Test Phase 5
Test Phase 1
Test Phase 3
a) b)
Figure 7. Response of garage wall line, (a) Test Level 2, and (b) Test Phase 5
ACKNOWLEDGEMENTS
The material presented in this paper is based upon work supported by the National Science Foundation under Grant
No. CMMI-0529903 (NEES Research) and CMMI-0402490 (NEES Operations). Any opinions, findings, and
conclusions or recommendations expressed in this material are those of the authors and do not necessarily reflect
the views of the National Science Foundation.
REFERENCES
Clough, R. W., and Penzien, J. (1993). Dynamic of Structures, 2nd Ed., McGraw-Hill, New York.
Christovasilis, I.P., Filiatrault, A., and Wanitkorkul, A. (2007). “Seismic testing of a full-scale two-Story light-frame wood
building: NEESWood benchmark test,” NEESWood Report No. NW-01, Dept. of Civil, Structural and Environmental
Engineering, University at Buffalo, State University of New York, Buffalo, available on-line at
http://www.engr.colostate.edu/NEESWood/.
Collins, M., Kasal, B., Paevere, P., and Foliente, G.C. (2005). “Three-Dimensional Model of Light Frame Wood Buildings. I:
Model Description”, J. Struct. Engrg, 131:4, 676-683.
Filiatrault, A., Fischer, D., Folz, B., and Uang C-M. (2002). “Seismic testing of a two-story woodframe house: influence of
wall finish materials”, J. Struct. Engrg, 128:10, 1337-1345.
Kircher, C., Reitherman, R., Whitman, R., and Arnold, C. (1997). “Estimation of earthquake losses to buildings,” Earthquake
Spectra, 13:4, 703-720.
Krawinkler, H., Parisi, F., Ibarra, L., Ayoub, A. and Medina, R. (2003). “Development of a Testing Protocol for Woodframe
Structures”, CUREE-Caltech Woodframe Project Report No. W-02, Consortium of Universities for Research in
Earthquake Engineering, Richmond, CA.
Mosalam, K.M., Machado, C., Gliniorz, K-U., Naito, C., Kunkel, U. and Mahin, S. (2002) “Seismic Evaluation of an
Asymmetric Three-Story Woodframe Building” CUREE-Caltech Woodframe Project Report No. W-19, Consortium of
Universities for Research in Earthquake Engineering, Richmond, CA.
Reitherman, R., Cobeen, K. and Serban, K. (2003). “Design documentation of woodframe project index buildings,”
CUREE-Caltech Woodframe Project Report No. W-29, Consortium of Universities for Research in Earthquake
Engineering, Richmond, CA, 2003, 258 p.
Shinde, J.K., Symans, M.D., Filiatrault, A. and Van de Lindt, J.W. (2007). ”Application of seismic protection systems to
woodframed buildings: full-scale testing and field implementation,” Proc. 5th NEES Annual Meeting, Snowbird, UT.
Tarabia , A.M. and Itani, R.Y. (1997). “Seismic response of light-frame wood buildings.” J. Struct. Engrg., 121:11,
1470-1477.
White, T.W. and Ventura, C. (2007). “Seismic behavior of residential wood-frame construction in British-Columbia: Part I –
modeling and validation,” Proc. of the Ninth Canadian Conference on Earthquake Engineering, Ottawa, Canada, 10 p.