SlideShare a Scribd company logo
1 of 127
Unit 2: Sampling theory, Sampling
distribution and Estimation 12 hours
2.1 Define terms used in sampling: population, study population, reference population,
sample, sampling unit, sampling frame, parameter and statistic
2.2 Census and sample survey; merits and demerits
2.3 Criteria for selection of appropriate sampling technique in survey
2.4 Differentiation between probability and non-probability sampling
2.5 Describing probability sampling technique: simple random, stratified, systematic,
cluster, multistage and probability proportionate to size sampling (PPS sampling)
2.6 Describing non-probability sampling technique: convenience, purpose, judgmental,
quota sampling, and snowball
2.7 Lot quality assurance sampling
2.8 Sampling errors and non-sampling errors
2.9 Sampling distributions
a. Central limit theorem
b. Estimation: point and interval estimation of the mean, proportion of distribution and confidence
interval
c. Standard error of mean and proportion for finite and infinite case
d. Distribution of sample mean, sample proportion and difference between two sample means and
two sample proportions
e. Determination of sample size by appropriate using formulas
9/13/2016 Ashok Pandey 1
2.1 Define terms used in sampling:
population, study population, reference
population, sample, sampling unit,
sampling frame, parameter and statistic
9/13/2016 Ashok Pandey 2
Why sample?
Save time and money
More effort to ensure high-quality measurement
if smaller sample
9/13/2016 3
Ashok Pandey
Criteria for a Good Sample
Samples can be selected in two ways
• Purposive Sample
• Random sample
Purposive sample or Non-probability Sample
Sample units are selected from the population to
suit a specific purpose as per the desire of the
investigator
These samples serves very limited purpose
9/13/2016 4
Ashok Pandey
Sample Size
• The question remains as to what constitutes an
adequate sample size.
• Samples should be as large as a researcher can obtain
with a reasonable expenditure of time and energy.
• The recommended minimum number of subjects are
as follows for the following types of studies:
– 100 for a Descriptive Study
– 50 for a Correlational Study
– 30 in each group for Experimental and Causal-Comparative
Study
The use of 15 subjects per group should probably be replicated
Examples of population and samples
Situation Population Sample
Sex ratio of births the world’s birth some hospital records
Is my well water safe? Water in well Vial in lab
Medical study people in Nepal some subjects
6
9/13/2016 Ashok Pandey
Technical Terms
• A sampling frame is a list of sampling units.
• A sample is a collection of sampling units drawn from a
sampling frame.
• Parameter: numerical characteristic of a population
• Statistic: numerical characteristic of a sample
9/13/2016 7
Ashok Pandey
Sampling Terms
• Target Population:
– Specific pool of cases or sample that researchers
wants to study.
• Sampling Ratio:
– Size of the sample / size of the target population.
– For example
– The population has 50,000 people, and a researcher
draws a sample of 150 from it. Researchers
sampling ratio is 150/50,000 = 0.03 or 0.3 percent.
9/13/2016 8
Ashok Pandey
Sampling
• Sampling is a process of systematically
selecting cases for inclusion in a research
project.
• Sampling involves the selection of a number of
study units from a defined study population.
9/13/2016 9
Ashok Pandey
What is Sampling?
• Sampling is the process of selecting observations (a sample) to
provide an adequate description and robust inferences of the
population
• It is the process of selecting a sufficient number of elements
from the population so that by studying the sample, and
understanding the properties or characteristics of the sample
subjects, it would be possible to generalise the properties or
characteristics to the population elements.
• The more representative the sample is of the population, the
more generalizable are the findings of the research
10
9/13/2016 Ashok Pandey
What is Sampling….
Population
Sample
Using data to say something (make an inference) with confidence, about
a whole (population) based on the study of a only a few (sample).
Sampling
Frame
Sampling Process
What you
want to talk
about
What you
actually
observe in
the data
Inference
11
9/13/2016 Ashok Pandey
9/13/2016 12
Ashok Pandey
Sampling Frame
• List of population units from which the sample units
are to be selected.
• If Sampling frame - not available, Prepare it –
• From - Telephone Directories, Tax Records, Driver’s
License Records.
• A good sampling frame is crucial to good sampling.
9/13/2016 13
Ashok Pandey
9/13/2016 14
Ashok Pandey
9/13/2016 15
Ashok Pandey
9/13/2016 16
Ashok Pandey
Steps in Sampling
• Defining the population to be covered
• Defining sampling units
• Acquiring frame / list of the population
elements
• Deciding about the size of the sample
• Deciding about the type of the sample to
be used and
• Testing the reliability of the sample
9/13/2016 17
Ashok Pandey
Levels of sample selection
Target population(s) - population(s)
to which the results can be applied
Source population - population(s)
from which eligible subjects are drawn
Eligible population - population(s) of
subjects eligible for inclusion in study
Study participants - individuals who
contribute data to the study: results apply
directly only to these subjects
9/13/2016 18
Ashok Pandey
9/13/2016 19
Ashok Pandey
Factors to be considered in sampling process
* Study Objectives
- Descriptive vs. Analytic
* Selection Criteria
- Inclusion & Exclusion
- Probability vs. Non-probability
* Sampling Frame & Sampling Units
- Unit
- Time & Place
* Strategies in approaching sampling units
- Identification & Classification
- Willing/Consent to Participate
O P D
9/13/2016 20
Ashok Pandey
1 ) Is the population from which the sample is
drawn consistent with the population of interest
for the study? (generalizability/external validity)
2) Have the methods for selecting subjects or
units
biased the sample? (bias/internal validity)
3) Are the estimates or sample statistics
sufficiently precise for the study purpose?
(power/sample size/precision)
Sampling Issues
9/13/2016 21
Ashok Pandey
Sample Size Determination
The researchers should consider various factors as follows;
1) Expense, time, labor and data collection tools.
2) Population size.
3) Similarity; the more of similar population, the usage of
samples size will be small. If the population is very
different, there will be plenty of variances, therefore, the
usage of sample size will be large.
4) Accuracy
5) Sampling error
6) Reliability
9/13/2016 Ashok Pandey 22
Requirements for estimation of Size of the sample
An approximate idea of the estimate of the characteristic
under observation
Variability of this characteristic from unit to unit in the
population
Initial knowledge of the desired accuracy of the estimate
of the characteristic under study
Probability level within which the desired precision of
estimates is to be maintained
Availability of the experimental material, resources and
other practical considerations
9/13/2016 23
Ashok Pandey
Factors to determine sample size
• Size of population
• Resources – subjects, financial, manpower
• Method of Sampling- random, stratified
• Degree of difference to be detected
• Variability (S.D.) – pilot study, historical
• Degree of Accuracy (or errors)
- Type I error (alpha) p<0.05
- Type II error (beta) less than 0.2 (20%)
- Power of the test : more than 0.8 (80%)
• Statistical Formulae
• Dropout rate, non-compliance to Rx
24
Sample size determination:
1. Sample size determination by using criteria
- Hundreds of populations; use 15-30% of sample size
- Thousands of populations; use 10-15% of sample size
- Tens Thousands of populations; use 5-10% of sample
size
- Hundreds Thousands of population; use 1-5% of sample
size
2. Sample size determination by calculation formulas.
3. Sample size determination by using tables.
4. Sample size determination by calculating computer
programs.
9/13/2016 Ashok Pandey 25
Calculation of sample size for field surveys
For Field surveys to estimate the prevalence rates
n = ( 4pq / L2
)
where n is the required sample size
p is the approximate prevalence rate
q= (1-p)
L is the permissible error in the estimate of p
stimates calculated with this sample size would be
true in 95 out of 100 samples 100 samples
9/13/2016 27
Ashok Pandey
Cochran Formula (Cochran, 1977)
p = 40%
q = (100-40 ) = 60%
L = 5% of 40% = 2%
n = ( 4 x 40 x 60) / ( 22
)
= (4 x 40 x 60 ) / 4
= 2400
2,400 persons are to be examined to estimate the
prevalence rate with 5% error.
If we increase the error percentage to 10%
L=10% of 40% = 4
n = ( 4 x 40 x 60 ) / 16
= 600
9/13/2016 28
Ashok Pandey
For finite population
=n/1+n/N
Where,
N= Sampling frame population (3000)
n= Required sample size (600)
(600/1+600)/3000
=500
9/13/2016 Ashok Pandey 29
HW (Rough)
Prevalence: (Cite)
Formula: 4PQ/L2
Where,
P=18
Q=100-18=82
L=5% of 18 = 0.9
4*18*82/(5*5)
= 236
Total population: 1920
Finite population: =n/1+n/N
Where,
Sample size: 211
Non-response rate 10%
Required sample size: 211+21=232
9/13/2016 Ashok Pandey 30
For Quantitative data, the sample size is
calculated from the formula.
n = (tα
2
x s2
) / e2
n is the desired sample size
s is the standard deviation of observations
e is the permissible error in the estimation
of mean difference
tα is the value of t at 5% level from t tables
9/13/2016 31
Ashok Pandey
In a survey to estimate the haemoglobin level
If mean Hb% level is approximately 12gm%
Standard deviation 1.5gm%
Permissible error 0.5gm%
s=1.5gms
e = 0.5gms
t0.05 can be taken as 2, as it is conventional to use 5% level
of significance
n = { 22
x (1.5) 2
} / (0.52
)
= (4 x 2.25 ) / (2.25 )
= 36 persons
9/13/2016 32
Ashok Pandey
9/13/2016 Ashok Pandey 33
Formulas for Sample Size (SS)
For Infinite Sample Size SS = [Z2p (1 − p)]/ C2
For Finite Sample Size SS/ [1 + {(SS − 1)/Pop}]
Where,
•SS = Sample size
•Z = Given Z value
•p = Percentage of population
•C = Confidence level
•Pop = Population
Check: Z Score Table
9/13/2016 Ashok Pandey 34
Question: Find the sample size for a finite and infinite
population when the percentage of 4300 population is 5,
confidence level 99 and confidence interval is 0.01?
Solution:
Z = From the z-table, we have the value of confidence
level, that is 2.58 by applying given data in the formula:
SS=(2.58)2×0.05×(1−0.05)0.012=316
Sample size for finite population
=3161+316−14300=294
New SS = 294
Probability proportionate to size
sampling (PPS sampling)
9/13/2016 Ashok Pandey 35
Probability proportional sampling, usually
known as probability proportional to size (PPS)
sampling, is an unequal probability sampling
technique, in which the probability of selection
for each sampling unit in the population is
proportional to an auxiliary variable.
36
Sampling with Probability Proportional
to Size (PPS)
• Probability of selection is related to an auxiliary variable, Z,
that is a measure of “size”
Example
Number of households
Area of farms
• “Larger” units are given higher chance of selection than
“smaller” units
• Selection probability of ith unit is
i = 1,2, … , N
PPS Sampling
∑
=
= N
i
i
i
i
Z
Z
p
1
37
PPS Selection Procedures
• Cumulative total method: with replacement
• Cumulative total method: without replacement
• PPS systematic sampling
• Lahiri’s method
PPS Sampling
38
Cumulative Total Method
• Sampling unit: village
• Measure of size: number of
households in village
• Selection probability:
Select a sample of 5 villages using
varying probability WR sampling,
the size being the number of
households
Solution
PPS Selection
pi
• Write down cumulative total
for the sizes Zi, i=1,2..N
• Choose a random number r
such that 1 ≤ r ≤ Z
• Select ith population unit if
• Ti-1 ≤ r ≤ Ti where
Ti-1 = Z1 + Z2 + .. + Zi-1
and
Ti = Z1 + Z2 + .. + Zi
Cumulative Total Method (Contd.)
PPS Selection
40
• To select a village, a random
number r, 1 ≤ r ≤ 700, is selected.
• Suppose r = 259,
Since 231 ≤ 259 ≤ 288, the 7th
village is therefore selected. The
next 4 random numbers to be
considered are 548, 170, 231, 505.
Hence the required sample selected
using PPS with replacement are
16th, 5th, 7th, 15th .
Note: The 7th village is selected twice.
Cumulative Total Method (Contd.)
PPS Selection
41
• For a PPSWR selection therefore
the sample would be: 16th, 5th, 7th,
15th , with 7th village repeated.
• For a PPSWOR selection, we have
to continue further to get 5 distinct
units in the sample.
• Suppose the next random selected is
r = 375,
The required PPSWOR sample would
be 16th, 5th, 7th, 15th & 11th .
Cumulative Total Method (Contd.)
PPS Selection
42
• Derive cumulative totals for the sizes
Zi, i=1,2..N, and allot random
numbers to different units.
• Calculate interval k = ZN /n (in this
case 700/5 = 140)
• Select a random number r (say 101)
from 1 to k; and obtain r+k, r+2k,
r+3k, …, r+(n-1)k
• In this case, the selected cumulative
sizes are 101, 241, 382, 523 & 664.
PPS Systematic
PPS Selection
43
• Thus the selected units are:
3rd (for 101),
7th (for 241),
11th (for 382),
15th (for 523) &
20th (for 664)
• Note: If any unit has size greater
than k, it may be selected more than
once.
PPS Systematic (Contd.)
PPS Selection
44
Lahiri’s Method
• A procedure which avoids the need of calculating cumulative
totals for each unit has been given by Lahiri (1951)
Steps involved;
1. Select a random number i from 1 to N
2. Select another random number j, such that 1 ≤ j ≤ M, where
M is either equal to the maximum of sizes Zi, i =1,2,.. N, or is
more than the maximum size in the population.
3. If j ≤ Zi , the ith unit is selected, otherwise, the pair (i, j) of
random numbers is rejected and another pair is chosen by
repeating the steps (1) and (2)
PPS Selection
45
Select a sample of 2 villages using
varying probability WR sampling, the
size being the number of households
Solution
• N =20, n=2 , M =58
• Select a random number i, 1 ≤ i ≤ 14,
• Then a second random number j,
1 ≤ j ≤ 58,
• Suppose the 1st pair of random
number is (2, 30). Since 30 ≤ 45 thus
2nd village is selected .
PPS Sampling
Lahiri’s Method
46
Solution (continued)
• Similarly we find the next pair
of random number (12, 47)
since 47 >30, the 12th village is
not selected The 3rd pair ot
random numbers (7, 40) results
in the selection of 7th village
since 40 ≤ 58
• Hence, the selected sample are
2nd and 7th villages.
PPS Sampling
Lahiri’s Method
Sampling techniques
9/13/2016 47
Ashok Pandey
Sampling
Methods
Probability
samples
Simple
random
Cluster
Stratified
Multi-stage
Non-
probability
samples
Convenienc
e
Judgments
Snowball
Quota
Classification of Sampling Methods
Systemati
c
(mixed)
9/13/2016 48
Ashok Pandey
Probability sampling
• Is the random selection of elements from the population.
• Probability sampling is a technique in which the researcher chooses
samples from a larger population using a method based on probability
theory. For a participant to be considered as a probability sample, he/she
must be selected using a random selection.
• This statistical method used to select a sample from a population in such a
way that each member of the population has a known, non-zero chance of
being selected. The most critical requirement of probability sampling is that
everyone in your population has a known and equal chance of getting
selected.
• Probability sampling uses statistical theory to randomly select a small
group of people (sample) from an existing large population and then predict
that all their responses will match the overall population.
9/13/2016 Ashok Pandey 49
9/13/2016 Ashok Pandey 50
Advantages of probability sampling
1. It’s Cost-effective: This process is cost and time
effective. A larger sample can also be chosen based on
numbers assigned to the samples. Then you can choose
random numbers from the more significant sample.
2. It’s simple and straightforward: Probability
sampling is an easy way as it does not involve a
complicated process. It’s quick and saves time. The time
saved can thus be used to analyze the data and draw
conclusions.
3. It is non-technical: This sampling method doesn’t
require any technical knowledge because of its
simplicity. It doesn’t require intricate expertise and is
not at all lengthy. You can also avoid sampling errors.
9/13/2016 Ashok Pandey 51
Methods of Sampling - Probability Sampling
·
·
1. Simple Random Sampling:
Objective: To select n units out of N such that each NCn has
an equal chance of being selected.
Procedure: Use a table of random numbers, a computer
random number generator, or a mechanical device to select
the sample.
1 2 3 4 5 6 7 8 9 10
11 12 13 14 15 16 17 18 19 20
21 22 23 24 25 26 27 28 29 30
31 32 33 34 35 36 37 38 39 40
41 42 43 44 45 46 47 48 49 50
1 2 3 4 5 6 7 8 9 10
11 12 13 14 15 16 17 18 19 20
21 22 23 24 25 26 27 28 29 30
31 32 33 34 35 36 37 38 39 40
41 42 43 44 45 46 47 48 49 50
N = 50
n = 10 Sampling Frame
1 2
3 4
5 ….. 49 50
9/13/2016 52
Ashok Pandey
Simple Random Sampling
• Lottery Method
– With replacement (Unrestricted random sampling )
– Without replacement (Restricted random sampling)
• Random number table method
9/13/2016 53
Ashok Pandey
TABLE OF RANDOM NUMBERS
53 74 23 99 67 61 32 28 69 84 94 62
63 38 06 86 54 99 00 65 26 94 02 82
35 30 58 21 46 06 72 17 10 94 25 21
63 43 36 82 69 65 51 18 37 88 61 38
98 25 37 55 26 01 91 82 81 46 74 71
02 63 21 17 69 71 50 80 89 56 38 15
64 55 22 21 82 48 22 28 06 00 61 54
85 07 26 13 89 01 10 07 82 04 59 63
58 54 16 24 15 51 54 44 82 00 62 61
34 85 27 84 87 61 48 64 56 26 90 18
03 92 18 27 46 57 99 16 96 56 30 33
62 95 30 27 59 37 75 41 66 48 86 97
08 45 93 15 22 60 21 75 46 91 98 77
07 08 55 18 40 45 44 75 13 90 24 94
01 85 89 95 66 51 10 19 34 88 15 84
72 84 71 14 35 19 11 58 49 26 50 11
88 78 28 16 84 13 52 53 94 53 75 45
45 17 75 65 57 28 40 19 72 12 25 12
96 76 28 12 54 22 01 11 95 25 71 96
43 31 67 72 30 24 02 94 08 63 38 32
50 44 66 44 21 66 06 58 05 62 68 15
22 66 22 15 86 26 63 75 41 99 58 42
96 24 40 14 51 23 22 30 88 57 95 67
9/13/2016 54
Ashok Pandey
Mixed Sampling
• Notice that from the first interval the choice of an
element is on a random basis but the choice of the
elements from subsequent intervals is dependent upon
the choice from the first, and hence cannot be classified
as a random sample. For this reason it has been
classified here as mixed sampling.
• Although the general procedure for selecting a sample
by the systematic sampling technique is described
above, one can deviate from it by selecting a different
element from each interval with the Simple Random
Sampling technique. By adopting, systematic sampling
can be classified under probability sampling design.
9/13/2016 55
Ashok Pandey
Mixed Sampling
·
·
Systematic Sampling
Procedure:
1. Number the units in the population from 1 to N;
2. Decide on the n (sample size) that you want or need;
3. Calculate the interval size k = N/n;
4. Randomly select an integer between 1 to k
5. Take every kth unit
1 2 3 4 5 6 7 8 9 10
11 12 13 14 15 16 17 18 19 20
21 22 23 24 25 26 27 28 29 30
31 32 33 34 35 36 37 38 39 40
41 42 43 44 45 46 47 48 49 50
N = 50
n = 10
k = 50/10 = 5
1 2 3 4 5 6 7 8 9 10
11 12 13 14 15 16 17 18 19 20
21 22 23 24 25 26 27 28 29 30
31 32 33 34 35 36 37 38 39 40
41 42 43 44 45 46 47 48 49 50
1 2 3 4 5 6 7 8 9 10
11 12 13 14 15 16 17 18 19 20
21 22 23 24 25 26 27 28 29 30
31 32 33 34 35 36 37 38 39 40
41 42 43 44 45 46 47 48 49 50
1 2 3 4 5 6 7 8 9 10
11 12 13 14 15 16 17 18 19 20
21 22 23 24 25 26 27 28 29 30
31 32 33 34 35 36 37 38 39 40
41 42 43 44 45 46 47 48 49 50
9/13/2016 56
Ashok Pandey
Systematic random sampling
9/13/2016 Ashok Pandey 57
Procedure: Use a table of random numbers,
a computer random number generator, or a
mechanical device to select the sample.
Example
k = N/n
=1920/210=9
1 2 3 4 5 6 7 8 9
10 11 12 13 14 15 16 17 18
19 20 21 22 23 24 25 26 27
28
….. 190
Systematic Sampling
Advantages:
1) Do not need to know the entire sampling frame in
advance, just the total number of sampling units;
can be constructed as the study progresses, so ordering
is by time of accrual
2) Often simpler to implement under field conditions than
other sampling methods (e.g. easier to have interviewer
to visit every 5th house on the block rather than to
determine which houses are to be visited by means of a
table of random numbers)
3) If a trend is present in the sampling frame, units will
small values to units with large values, than a systematic
sample will ensure coverage of the spectrum of units
9/13/2016 58
Ashok Pandey
Systematic Sampling
Disadvantage:
1) If cyclical trends exist in the data, a poor estimate of
the mean will be obtained
(e.g., the prevalence of bronchitis would be considerable
higher if one sampled every 12th month starting in January
than every 12th month starting in July)
9/13/2016 59
Ashok Pandey
Methods of Sampling - Probability Sampling
·
·
2. Stratified Random Sampling,
(quota random sampling)
Procedure:
1. Divide the population into non-overlapping homogeneous
subgroups (i.e., strata) N1, N2, N3, ... Ni, such that N1 + N2 + N3
+ ... + Ni = N.
2. Do a simple random sample of f = n/N in each strata.
1 2 3 4 5 6 7 8 9 10
11 12 13 14 15 16 17 18 19 20
21 22 23 24 25 26 27 28 29 30
1 2 3 4 5 6 7 8 9 10
11 12 13 14 15 16 17 18 19 20
21 22 23 24 25 26 27 28 29 30
31 32 33 34 35 36 37 38 39 40
41 42 43 44 45 46 47 48 49 50
31 32 33 34 35 36 37 38 39 40
41 42 43 44 45 46 47 48 49 50
Sampling Frame
.. 12 ….. 20 ..
1
30
31 … 50
N = 50 (N1 30; N2 =20)
n = 10
f = 10/50 = 0.2
thus
n1 = 0.2 x 30 = 6
n2 = 0.2 x 20 = 4
9/13/2016 60
Ashok Pandey
Stratified Sampling
Advantages:
1) Investigator can make certain that each subgroup in the
population is represented; guarantees mean heights of each
subgroup can be estimated separately in addition to the
overall mean
2) When population divided into subgroups that are more
homogeneous than population as a whole, a more
precise
estimate of population parameters are obtained than
when
a simple random sample is taken, because variance
computed from the entire sample is based on each
within-stratum variance
9/13/2016 61
Ashok Pandey
Stratified Sampling
Advantages:
3) Strata can be constructed so that those that are least
expensive to study or have the largest variances or largest
number of individuals can be sampled most heavily
4) Administratively it may be easier to deal with strata
Disadvantage:
Loss of precision can occur if very small numbers of units a
sampled within individual strata; although under most
circumstances, greater precision is attained by stratum-spec
estimates of a homogeneous group
9/13/2016 62
Ashok Pandey
Methods of Sampling - Probability Sampling
·
4. Cluster (or Area) Random Sampling
Procedure:
1. Divide population into clusters (usually geographic boundaries)
2. Randomly sample clusters
3. Measure all units within sampled clusters
1 2 3 4 5
6 7 8 9 10
N = 50
n = 22
35 36 37 38 39
40 41 42 43 44
45
11 12 13 14 15 16
17 18 19 20 21 22
23 24 25 26 27
28 29 30 31 32 33 34
46 47 48 49 50
1 2 3 4 5
6 7 8 9 10
28 29 30 31 32 33 34
46 47 48 49 50
·
9/13/2016 63
Ashok Pandey
Cluster Sampling
• A researcher first samples clusters, each of which contains
elements, then draws a second sample from within the clusters
selected in the first stage of sampling. Clusters are often
geographic units (e.g. districts, villages) or organizational units
(e.g. clinics, training groups).
• Cluster sampling is usually less expensive than simple random
sampling, but it is less accurate. A researcher who uses cluster
sampling must decide the numbers of clusters and the number of
elements within clusters.
• For example
– In a study of the KAP related to family planning in rural communities of a
region, a list is made of all the villages. Using this list, a random sample
of villages is chosen and all the adults in the selected villages are
interviewed.
9/13/2016 64
Ashok Pandey
Cluster Sampling
Advantages:
1) One need not enumerate the entire population in
advance, just the total number of clusters; then just
the units of selected clusters
2) More economical than simple random sampling
Disadvantage:
Factor representing cluster effect must be accounted for
in analysis, complex (violates assumption of independence)
9/13/2016 65
Ashok Pandey
Multistage (Multi-cluster) Sampling
Primary (larger) sampling units are first selected from a population
Secondary (smaller) sampling units (e.g. city blocks) are sampled
from within each chosen primary unit
Can be extended so that tertiary units (e.g. households) or further
(e.g. individuals) are selected within these secondary units
Differs from clustering in that secondary units are sampled,
whereas in cluster sampling all secondary units are included.
9/13/2016 66
Ashok Pandey
Non-probability sampling
Non-probability sampling is a method of
selecting units from a population using a
subjective (i.e. non-random) method. Since
non-probability sampling does not require a
complete survey frame, it is a fast, easy and
inexpensive way of obtaining data. However, in
order to draw conclusions about the
population from the sample, it must assume
that the sample is representative of the
population.
9/13/2016 Ashok Pandey 67
Non-probability sampling
There are five key reasons behind this trend:
• the decline in response rates in probability
surveys;
• the high cost of data collection;
• the increased burden on respondents;
• the desire for access to real-time statistics,
and
• the surge of non-probability data sources
such as web surveys and social media.
9/13/2016 Ashok Pandey 68
Example
1. An example of convenience sampling would be using
student volunteers known to the researcher. Researchers
can send the survey to students belonging to a particular
school, college, or university, and act as a sample.
2. In an organization, for studying the career goals of 500
employees, technically, the sample selected should have
proportionate numbers of males and females. Which
means there should be 250 males and 250 females. Since
this is unlikely, the researcher selects the groups or strata
using quota sampling.
3. Researchers also use this type of sampling to conduct
research involving a particular illness in patients or a rare
disease. Researchers can seek help from subjects to refer
to other subjects suffering from the same ailment to
form a subjective sample to carry out the study.
9/13/2016 Ashok Pandey 69
Convenience or Haphazard Sampling
• Cheap and quick
• Study units that happen to be available at the time of data
collection are selected in the sample
• Choose when population is not clearly defined, sampling
units are not clear.
• When a researcher haphazardly selects cases that are
convenient researcher can easily get a sample that seriously
misrepresents the population.
– Some units over selected, other under selected or missed altogether
– Causes ineffective, unrepresentative samples.
9/13/2016 70
Ashok Pandey
Convenience or Haphazard Sampling
• Examples:
• The person-on-the-street interview conducted by television
programs is an example of a haphazard sample. Television
interviewers go out on the street with camera and microphone
to talk to a few people who are convenient to interview.
• A researcher wants to study the attitudes of villagers toward
family planning services provided by MCH clinic. He decides
to interview all adult patients who visit the out-patient clinic
during one particular day. This is more convenient than taking
a random sample of people in the village, and it gives a useful
first impression.
9/13/2016 71
Ashok Pandey
Purposive or Judgmental Sampling
• Researcher deliberately selects certain units for study
from the population
• Choice of the selection is supreme and nothing is left to
chance
Appropriate in 3 situations:
• For unique cases selection that are especially informative
• For selection of members of difficult to reach, specialized
population
• Another situation for purposive sampling occurs when a
researcher wants to identify particular types of cases for
in-depth investigation.
9/13/2016 72
Ashok Pandey
Types of purposive sampling
• Maximum variation sampling.
• Homogeneous sampling.
• Typical case sampling.
• Extreme (or deviant) case sampling.
• Critical case sampling.
• Total population sampling.
• Expert sampling.
9/13/2016 Ashok Pandey 73
Quota Sampling
• Pre plan number of subjects in specified
categories (e.g. 100 men and 100 women)
• Once the quota sample fixes the categories and
number of cases in each category, researcher uses
convenient sampling
9/13/2016 74
Ashok Pandey
Snowball Sampling
• Selecting the cases in a network
• Begins with one or a few people or cases and
spread out on the basis of links to the initial cases
9/13/2016 75
Ashok Pandey
Snowball
• Recruiting people based
on recommendation of
people you have just
interviewed
• Useful for studying
invisible/illegal
populations, such as drug
addicts
Main
person
Friend
Friend
Friend
Friend
Friend
Friend
Friend
Friend
Friend Friend Friend Friend
Friend
Friend
Friend
Respondent-driven sampling (RDS)
RDS is a type of snowball sampling used for
analyzing characteristics of hidden or hard-
to-reach populations.
It was developed in 1997 by Dr. Douglas
Heckathorn, a professor of Sociology at
Cornell and has been applied to groups
ranging from men who have sex with men,
injection drug users, and children living on
the street
Example
Others
• Crowdsourcing: Crowdsourcing has
been defined slightly differently by
researchers from various areas.
• Web panels: A web panel (or online or
internet panel) could be defined as an
access panel of people willing to respond
to web questionnaires.
9/13/2016 Ashok Pandey 79
80
What is LQAS
(Lot Quality Assurance Sampling)?
• LQAS is a sampling method developed to control the
quality of manufactured goods produced in ‘lots.’
• LQAS takes a small random sample and tests the sample
for quality.
• The sample will tell if program activities (agriculture,
health, etc.) are meeting/not a performance benchmark
• The sample size is chosen so that there is a high
probability of determining what indicators in a given
activity are meeting or not meeting the performance
benchmark.
81
Difference between non-probability
sampling and probability sampling
9/13/2016 Ashok Pandey 82
ERRORS IN RESEARCH
Non-sampling errors
• Coverage errors
• Response errors
• Non-response errors
• Processing errors
• Measurement errors
• Estimation errors
• Analysis errors
Sampling errors
• Sample size
• Population size
• Variability of the characteristic of interest
• Sample plan
9/13/2016 83
Ashok Pandey
Types of Survey Errors
• Coverage error
• Non response error
• Sampling error
• Measurement error
Excluded from
frame.
Follow up on
non responses.
Chance
differences from
sample to sample.
Bad Question!
1. Sampling error
– random error- the sample selected is not
representative of the population due to chance
– The uncertainty associated with an estimate that is
based on data gathered from a sample of the
population rather than the full population is known as
sampling error.
– Sampling errors are the random variations in the
sample estimates around the true population
parameters.
85
Sampling error cont’d…
the level of it is controlled by sample size
a larger sample size leads to a smaller sampling
error. it decreases with the increase in the size of the
sample, and it happens to be of a smaller magnitude in
case of homogeneous population.
When n = N ⇒ sampling error = 0
 Can not be avoided or totally eliminated
86
Sampling error cont’d…
why do sample estimates have uncertainty associated
with them? There are two reasons.
Estimates of characteristics from the sample data can
differ from those that would be obtained if the entire
population were surveyed.
Estimates from one subset or sample of the
population can differ from those based on a different
sample from the same population (sample to sample
variations). 87
The cause of sampling error
Chance: main cause of sampling error and is the error that
occurs just because of bad luck.
Sampling bias: Sampling bias is a tendency to favor the
selection of participants that have particular characteristics.
The chance component (sometimes called random error)
exists no matter how carefully the selection procedures are
implemented, and the only way to minimize chance-
sampling errors is to select a sufficiently large
sample.
88
2. Non Sampling Error
It is a type of systematic error in the design or conduct of a
sampling procedure which results in distortion of the sample, so
that it is no longer representative of the reference population.
We can eliminate or reduce the non-sampling error (bias) by
careful design of the sampling procedure and not by increasing
the sample size.
It can occur whether the total study population or a sample is
being used.
89
Non-sampling Error……
o The basic types of non-sampling error
– Non-response error
– Response or data error
o A non-response error occurs when units selected as part of the
sampling procedure do not respond in whole or in part
– If non-respondents are not different from those that did
respond, there is no non-response error
– When non-respondents constitute a significant proportion of
the sample (about 15% or more
90
Non-sampling Error…….
o A response or data error is any systematic bias
that occurs during data collection, analysis or
interpretation
– Respondent error (e.g., lying, forgetting, etc.)
– Interviewer bias
– Recording errors
– Poorly designed questionnaires
91
Non-Sampling Error cont’d …
Systematic error makes survey results unrepresentative of the
target population by distorting the survey estimates in one
direction.
Random error can distort the results in any given direction but
tend to balance out on average
Thus, the total survey error
92
sampling error + non-sampling error
Improving Response Rates
Prior
Notification
Motivating
Respondents
Incentives Questionnaire
Design
and
Administration
Follow-Up Other
Facilitators
Callbacks
Methods of Improving
Response Rates
Reducing
Refusals
Reducing
Not-at-Homes
2.9 Sampling distributions
a. Central limit theorem
b. Estimation: point and interval estimation of
the mean, proportion of distribution and
confidence interval
c. Standard error of mean and proportion for
finite and infinite case
d. Distribution of sample mean, sample
proportion and difference between two sample
means and two sample proportions
9/13/2016 Ashok Pandey 94
Central limit theorem
For simple random samples from any population
with finite mean and variance, as n becomes
increasingly large, the sampling distribution of
the sample means is approximately normally
distributed.
9/13/2016 Ashok Pandey 95
n↑
Central Limit Theorem
As the
sample
size gets
large
enough…
the sampling
distribution of
the sample
mean becomes
almost normal
regardless of
shape of
population
x
Normal Uniform Skewed
Population
n = 2
n = 30
X

X

X

X

General
The Central Limit Theorem Applies to Sampling
Distributions from Any Population
Contd …
9/13/2016 Ashok Pandey 98
14-99
Standard Errors
Standard Error
(Z score)
% of Area Approximate
Degree of
Confidence
1.00 68.27 68%
1.65 90.10 90%
1.96 95.00 95%
3.00 99.73 99%
Central Limit Theorem: Proportions AND Means
RULE: If many samples or repetitions of the SAME SIZE are taken, the
frequency curve made from STATISTICS from the SAMPLES will be
approximately normally distributed
Categorical (2 outcomes)
PROPORTIONS (𝒑’s):
• Assumptions:
1. Population w/fixed proportion
2. Random sample from population
3. np5 and n(1-p)5 (“large” samples)
• MEAN of samples 𝒑’s will be
population proportion (p)
• STANDARD DEVIATION of the
sample proportions (𝒑′s) will be:
Quantitative (Measurement)
MEANS (𝑿’s ):
• Conditions/Assumptions
1. If population bell-shaped (normal),
random sample of any size
2. If population not bell-shaped, a large
random sample ( 30)
– MEAN of sample means (𝑿’s) will be
population mean (𝝁)
– STANDARD DEVIATION of the sample
means (𝑿’s) will be:
𝒑
 𝜇𝒑
= 𝒑  𝜇𝒙
= 𝝁
Estimation: point and interval
estimation of the mean, proportion of
distribution and confidence interval
• An estimator of a population parameter is
– a random variable that depends on sample
information . . .
– whose value provides an approximation to this
unknown parameter
• A specific value of that random variable is
called an estimate
9/13/2016 Ashok Pandey 101
We can estimate a
Population Parameter …
Point Estimates
with a Sample
Statistic
(a Point Estimate)
Mean
Proportion
p
x
μ
p̂
Variance
Variance σ2 s2
Point and Interval Estimates
• A point estimate is a single number,
• a confidence interval provides additional
information about variability
Point Estimate
Lower
Confidence
Limit
Upper
Confidence
Limit
Width of
confidence interval
Confidence Intervals
• How much uncertainty is associated with a
point estimate of a population parameter?
• An interval estimate provides more
information about a population
characteristic than does a point estimate
• Such interval estimates are called
confidence intervals
Confidence Interval Estimate
• An interval gives a range of values:
– Takes into consideration variation in sample
statistics from sample to sample
– Based on observation from 1 sample
– Gives information about closeness to unknown
population parameters
– Stated in terms of level of confidence
• Can never be 100% confident
Confidence Interval and Confidence
Level
• If P(a <  < b) = 1 -  then the interval from a
to b is called a 100(1 - )% confidence
interval of .
• The quantity (1 - ) is called the confidence
level of the interval ( between 0 and 1)
– In repeated samples of the population, the true value
of the parameter  would be contained in 100(1 - )%
of intervals calculated this way.
– The confidence interval calculated in this manner is
written as a <  < b with 100(1 - )% confidence
Estimation Process
(mean, μ, is
unknown)
Population
Random Sample
Mean
X = 50
Sample
I am 95%
confident that
μ is between 40
& 60.
Confidence Level, (1-)
• Suppose confidence level = 95%
• Also written (1 - ) = 0.95
• A relative frequency interpretation:
– From repeated samples, 95% of all the confidence
intervals that can be constructed will contain the
unknown true parameter
• A specific interval either will contain or will
not contain the true parameter
– The procedure used leads to a correct interval in
95% of the time...
– ...but this does not guarantee anything about a
particular sample.
(continued)
General Formula
• The general formula for all confidence
intervals is:
• The value of the reliability factor depends
on the desired level of confidence
Point Estimate  (Reliability Factor)(Standard deviation)
Confidence Intervals
Population
Mean
σ2 Unknown
Confidence
Intervals
Population
Proportion
σ2 Known
Population
Variance
Confidence Interval for μ
(σ2 Known)
• Assumptions
– Population variance σ2 is known
– Population is normally distributed...
– ....or large sample so that CLT can be used.
• Confidence interval estimate:
(where z/2 is the normal distribution value for a probability of /2 in each
tail)
n
σ
z
x
μ
n
σ
z
x α/2
α/2 



Margin of Error
• The confidence interval,
• Can also be written as
where ME is called the margin of error
• The interval width, w, is equal to twice the margin of error
n
σ
z
x
μ
n
σ
z
x α/2
α/2 



ME
x 
n
σ
z
ME α/2

Finding the Reliability Factor, z/2
• Consider a 95% confidence interval:
z = -1.96 z = 1.96
.95
1 


.025
2
α
 .025
2
α

Point Estimate
Lower
Confidence
Limit
Upper
Confidence
Limit
Z units:
X units:
0
 Find z.025 = 1.96 from the standard normal distribution table
Common Levels of Confidence
• Commonly used confidence levels are 90%,
95%, and 99%
Confidence
Level
Confidence
Coefficient, Z/2 value
1.28
1.645
1.96
2.33
2.58
3.08
3.27
.80
.90
.95
.98
.99
.998
.999
80%
90%
95%
98%
99%
99.8%
99.9%


1
Confidence Intervals
Population
Mean
σ2 Unknown
Confidence
Intervals
Population
Proportion
σ2 Known
Population
Variance
• If the population standard deviation σ is
unknown, we can substitute the sample
standard deviation, s
• This introduces extra uncertainty, since s is
variable from sample to sample
• Therefore we use the t distribution instead
of the normal distribution
Confidence Interval for μ
(σ2 Unknown)
Student’s t Distribution
• Consider a random sample of n observations
– with mean x and standard deviation s
– from a normally distributed population with mean μ
• Then the variable
follows the Student’s t distribution with (n - 1) degrees of
freedom
n
s/
μ
x
t


Student’s t Distribution
• The t is a family of distributions
• The t-value depends on degrees of freedom
(d.f.)
– Number of observations that are free to vary after sample
mean has been calculated
d.f. = n - 1
Student’s t Distribution
t
0
t (df = 5)
t (df = 13)
t-distributions are bell-
shaped and symmetric, but
have ‘fatter’ tails than the
normal
Standard
Normal
(t with df = ∞)
Note: t Z as n increases
• Assumptions
– Population standard deviation is unknown
– Population is normally distributed
• Use Student’s t Distribution
• Confidence Interval Estimate:
where tn-1,α/2 is the critical value of the t distribution with n-1 d.f. and an
area of α/2 in each tail:
Confidence Interval for μ
(σ Unknown)
n
s
t
x
μ
n
s
t
x α/2
1,
-
n
α/2
1,
-
n 



(continued)
α/2
)
t
P(t α/2
1,
n 
 
Student’s t Table
Upper Tail Area
df .10 .025
.05
1 12.706
2
3 3.182
t
0 2.920
The body of the table
contains t values, not
probabilities
Let: n = 3
df = n - 1 = 2
 = .10
/2 =.05
/2 = .05
3.078
1.886
1.638
6.314
2.920
2.353
4.303
Distribution of sample mean, sample
proportion and difference between two
sample means and two sample proportions
9/13/2016 Ashok Pandey 122
6
)
5
(
5833
.
5
.
3
5
n
2
x
2
x
x







)
10
(
2917
.
5
.
3
10
n
2
x
2
x
x







)
25
(
1167
.
5
.
3
25
n
2
x
2
x
x







Sampling Distribution of the Mean
The sample proportion is the percentage of
successes in n binomial trials. It is the
number of successes, X, divided by the
number of trials, n.

p
X
n

As the sample size, n, increases, the sampling
distribution of approaches a normal
distribution with mean p and standard
deviation

p
p p
n
( )
1
Sample proportion:
15
14
13
12
11
10
9
8
7
6
5
4
3
2
1
0
0.2
0.1
0.0
P(X)
n=15, p = 0.3
X
14
15
13
15
12
15
11
15
10
15
9
15
8
15
7
15
6
15
5
15
4
15
3
15
2
15
1
15
0
15
15
15 ^
p
2
1
0
0 .5
0 .4
0 .3
0 .2
0 .1
0 .0
X
P(X)
n=2, p = 0 .3
10
9
8
7
6
5
4
3
2
1
0
0.3
0.2
0.1
0.0
P(X)
n=10,p=0.3
X
The Sampling Distribution of the Sample
Proportion, 
p
The Sampling Distribution of a Difference Between Two Means
Significance Tests for µ1 – µ2
Two-Sample t Test for the Difference Between Two Means
9/13/2016 Ashok Pandey 127

More Related Content

Similar to Sampling

Basics of Research Methodology- Part-II.ppt
Basics of Research Methodology- Part-II.pptBasics of Research Methodology- Part-II.ppt
Basics of Research Methodology- Part-II.pptPratibha Jagtap
 
Submodule 5 - Sampling Designs.pdf
Submodule 5 - Sampling Designs.pdfSubmodule 5 - Sampling Designs.pdf
Submodule 5 - Sampling Designs.pdfOliverUmhao
 
Writing research chapter three, the research methods
Writing research chapter three, the research methodsWriting research chapter three, the research methods
Writing research chapter three, the research methodsResearchWap
 
(PR2) Research Design - Practical Research 2
(PR2) Research Design - Practical Research 2(PR2) Research Design - Practical Research 2
(PR2) Research Design - Practical Research 2JosuaGarcia5
 
Practical Research_Quarter 2 Lesson 3 Probability
Practical Research_Quarter 2 Lesson 3 ProbabilityPractical Research_Quarter 2 Lesson 3 Probability
Practical Research_Quarter 2 Lesson 3 ProbabilityYelMuli
 
Sampling Design in Applied Marketing Research
Sampling Design in Applied Marketing ResearchSampling Design in Applied Marketing Research
Sampling Design in Applied Marketing ResearchKelly Page
 
The major issues that must be examined when developing research methods are: ...
The major issues that must be examined when developing research methods are: ...The major issues that must be examined when developing research methods are: ...
The major issues that must be examined when developing research methods are: ...OsmanDaud3
 
Sampling methods and sample size
Sampling methods and sample size  Sampling methods and sample size
Sampling methods and sample size mdanaee
 
Malimu intro to surveys
Malimu intro to surveysMalimu intro to surveys
Malimu intro to surveysMiharbi Ignasm
 

Similar to Sampling (20)

Basics of Research Methodology- Part-II.ppt
Basics of Research Methodology- Part-II.pptBasics of Research Methodology- Part-II.ppt
Basics of Research Methodology- Part-II.ppt
 
How to prepare a thesis
How to prepare a thesisHow to prepare a thesis
How to prepare a thesis
 
Submodule 5 - Sampling Designs.pdf
Submodule 5 - Sampling Designs.pdfSubmodule 5 - Sampling Designs.pdf
Submodule 5 - Sampling Designs.pdf
 
Writing research chapter three, the research methods
Writing research chapter three, the research methodsWriting research chapter three, the research methods
Writing research chapter three, the research methods
 
7. research_design.pptx
7. research_design.pptx7. research_design.pptx
7. research_design.pptx
 
(PR2) Research Design - Practical Research 2
(PR2) Research Design - Practical Research 2(PR2) Research Design - Practical Research 2
(PR2) Research Design - Practical Research 2
 
research_design.pptx
research_design.pptxresearch_design.pptx
research_design.pptx
 
Sampling brm chap-4
Sampling brm chap-4Sampling brm chap-4
Sampling brm chap-4
 
Practical Research_Quarter 2 Lesson 3 Probability
Practical Research_Quarter 2 Lesson 3 ProbabilityPractical Research_Quarter 2 Lesson 3 Probability
Practical Research_Quarter 2 Lesson 3 Probability
 
Sampling Design in Applied Marketing Research
Sampling Design in Applied Marketing ResearchSampling Design in Applied Marketing Research
Sampling Design in Applied Marketing Research
 
Sampling methods in medical research
Sampling methods in medical researchSampling methods in medical research
Sampling methods in medical research
 
The major issues that must be examined when developing research methods are: ...
The major issues that must be examined when developing research methods are: ...The major issues that must be examined when developing research methods are: ...
The major issues that must be examined when developing research methods are: ...
 
Sampling methods and sample size
Sampling methods and sample size  Sampling methods and sample size
Sampling methods and sample size
 
Session 3 sample design
Session 3   sample designSession 3   sample design
Session 3 sample design
 
Lesson 5 chapter 3
Lesson 5   chapter 3Lesson 5   chapter 3
Lesson 5 chapter 3
 
Lesson 5 chapter 3
Lesson 5   chapter 3Lesson 5   chapter 3
Lesson 5 chapter 3
 
CH 3 Sampling (3).pptx.ppt
CH 3 Sampling (3).pptx.pptCH 3 Sampling (3).pptx.ppt
CH 3 Sampling (3).pptx.ppt
 
Malimu intro to surveys
Malimu intro to surveysMalimu intro to surveys
Malimu intro to surveys
 
Chapter Eight Quantitative Methods
Chapter Eight Quantitative MethodsChapter Eight Quantitative Methods
Chapter Eight Quantitative Methods
 
Sampling techniques
Sampling techniquesSampling techniques
Sampling techniques
 

More from Ashok Pandey

Overview of strategies of public health services in a typical.pptx
Overview of strategies of public health services in a typical.pptxOverview of strategies of public health services in a typical.pptx
Overview of strategies of public health services in a typical.pptxAshok Pandey
 
Internationalhealth.ppt
Internationalhealth.pptInternationalhealth.ppt
Internationalhealth.pptAshok Pandey
 
A review of GLOBALIZATION, A Very Short Introduction by Manfred B. Steger
A review of GLOBALIZATION, A Very Short Introduction by Manfred B. StegerA review of GLOBALIZATION, A Very Short Introduction by Manfred B. Steger
A review of GLOBALIZATION, A Very Short Introduction by Manfred B. StegerAshok Pandey
 
Advocacy (वकलात).pptx
Advocacy (वकलात).pptxAdvocacy (वकलात).pptx
Advocacy (वकलात).pptxAshok Pandey
 
Research Hypothesis and Variables
Research Hypothesis and VariablesResearch Hypothesis and Variables
Research Hypothesis and VariablesAshok Pandey
 
National Conference on Comprehensive Sexuality Education 24 – 25 May 2023, Ka...
National Conference on Comprehensive Sexuality Education 24 – 25 May 2023, Ka...National Conference on Comprehensive Sexuality Education 24 – 25 May 2023, Ka...
National Conference on Comprehensive Sexuality Education 24 – 25 May 2023, Ka...Ashok Pandey
 
Finalizing and Reviewing the Health Research Proposal_Ashok.pptx
Finalizing and Reviewing the Health Research Proposal_Ashok.pptxFinalizing and Reviewing the Health Research Proposal_Ashok.pptx
Finalizing and Reviewing the Health Research Proposal_Ashok.pptxAshok Pandey
 
Ashok_Health_Status_of_Arghakhanchi_Ashok.pptx
Ashok_Health_Status_of_Arghakhanchi_Ashok.pptxAshok_Health_Status_of_Arghakhanchi_Ashok.pptx
Ashok_Health_Status_of_Arghakhanchi_Ashok.pptxAshok Pandey
 
Perspectives of Cannabis
Perspectives of CannabisPerspectives of Cannabis
Perspectives of CannabisAshok Pandey
 
Research Idea Generation and Research Question Formulation.ppt
Research Idea Generation and Research Question Formulation.pptResearch Idea Generation and Research Question Formulation.ppt
Research Idea Generation and Research Question Formulation.pptAshok Pandey
 
Overview of strategies of public health services in a typical rural and urban...
Overview of strategies of public health services in a typical rural and urban...Overview of strategies of public health services in a typical rural and urban...
Overview of strategies of public health services in a typical rural and urban...Ashok Pandey
 
Rural health (Public health)
Rural health (Public health)Rural health (Public health)
Rural health (Public health)Ashok Pandey
 
Project management
Project managementProject management
Project managementAshok Pandey
 
समुदाय मैत्री कानुनी सेवा: सन्दर्भ र सम्भावना (Community Lawyering: Context &...
समुदाय मैत्री कानुनी सेवा: सन्दर्भ र सम्भावना (Community Lawyering: Context &...समुदाय मैत्री कानुनी सेवा: सन्दर्भ र सम्भावना (Community Lawyering: Context &...
समुदाय मैत्री कानुनी सेवा: सन्दर्भ र सम्भावना (Community Lawyering: Context &...Ashok Pandey
 
Public Opinion and Compliance Survey on Tobacco Control and Legislations in N...
Public Opinion and Compliance Survey on Tobacco Control and Legislations in N...Public Opinion and Compliance Survey on Tobacco Control and Legislations in N...
Public Opinion and Compliance Survey on Tobacco Control and Legislations in N...Ashok Pandey
 
Spss and software Application
Spss and software ApplicationSpss and software Application
Spss and software ApplicationAshok Pandey
 
Research types designs
Research types designs Research types designs
Research types designs Ashok Pandey
 
Unit 2 behavor health note
Unit 2 behavor health noteUnit 2 behavor health note
Unit 2 behavor health noteAshok Pandey
 

More from Ashok Pandey (20)

Overview of strategies of public health services in a typical.pptx
Overview of strategies of public health services in a typical.pptxOverview of strategies of public health services in a typical.pptx
Overview of strategies of public health services in a typical.pptx
 
Internationalhealth.ppt
Internationalhealth.pptInternationalhealth.ppt
Internationalhealth.ppt
 
A review of GLOBALIZATION, A Very Short Introduction by Manfred B. Steger
A review of GLOBALIZATION, A Very Short Introduction by Manfred B. StegerA review of GLOBALIZATION, A Very Short Introduction by Manfred B. Steger
A review of GLOBALIZATION, A Very Short Introduction by Manfred B. Steger
 
Advocacy (वकलात).pptx
Advocacy (वकलात).pptxAdvocacy (वकलात).pptx
Advocacy (वकलात).pptx
 
Dengue Awareness
Dengue AwarenessDengue Awareness
Dengue Awareness
 
Research Hypothesis and Variables
Research Hypothesis and VariablesResearch Hypothesis and Variables
Research Hypothesis and Variables
 
National Conference on Comprehensive Sexuality Education 24 – 25 May 2023, Ka...
National Conference on Comprehensive Sexuality Education 24 – 25 May 2023, Ka...National Conference on Comprehensive Sexuality Education 24 – 25 May 2023, Ka...
National Conference on Comprehensive Sexuality Education 24 – 25 May 2023, Ka...
 
Finalizing and Reviewing the Health Research Proposal_Ashok.pptx
Finalizing and Reviewing the Health Research Proposal_Ashok.pptxFinalizing and Reviewing the Health Research Proposal_Ashok.pptx
Finalizing and Reviewing the Health Research Proposal_Ashok.pptx
 
Ashok_Health_Status_of_Arghakhanchi_Ashok.pptx
Ashok_Health_Status_of_Arghakhanchi_Ashok.pptxAshok_Health_Status_of_Arghakhanchi_Ashok.pptx
Ashok_Health_Status_of_Arghakhanchi_Ashok.pptx
 
Perspectives of Cannabis
Perspectives of CannabisPerspectives of Cannabis
Perspectives of Cannabis
 
Research Idea Generation and Research Question Formulation.ppt
Research Idea Generation and Research Question Formulation.pptResearch Idea Generation and Research Question Formulation.ppt
Research Idea Generation and Research Question Formulation.ppt
 
Overview of strategies of public health services in a typical rural and urban...
Overview of strategies of public health services in a typical rural and urban...Overview of strategies of public health services in a typical rural and urban...
Overview of strategies of public health services in a typical rural and urban...
 
Rural health (Public health)
Rural health (Public health)Rural health (Public health)
Rural health (Public health)
 
Project management
Project managementProject management
Project management
 
समुदाय मैत्री कानुनी सेवा: सन्दर्भ र सम्भावना (Community Lawyering: Context &...
समुदाय मैत्री कानुनी सेवा: सन्दर्भ र सम्भावना (Community Lawyering: Context &...समुदाय मैत्री कानुनी सेवा: सन्दर्भ र सम्भावना (Community Lawyering: Context &...
समुदाय मैत्री कानुनी सेवा: सन्दर्भ र सम्भावना (Community Lawyering: Context &...
 
Public Opinion and Compliance Survey on Tobacco Control and Legislations in N...
Public Opinion and Compliance Survey on Tobacco Control and Legislations in N...Public Opinion and Compliance Survey on Tobacco Control and Legislations in N...
Public Opinion and Compliance Survey on Tobacco Control and Legislations in N...
 
Spss and software
Spss and softwareSpss and software
Spss and software
 
Spss and software Application
Spss and software ApplicationSpss and software Application
Spss and software Application
 
Research types designs
Research types designs Research types designs
Research types designs
 
Unit 2 behavor health note
Unit 2 behavor health noteUnit 2 behavor health note
Unit 2 behavor health note
 

Recently uploaded

Call Girl Coimbatore Prisha☎️ 8250192130 Independent Escort Service Coimbatore
Call Girl Coimbatore Prisha☎️  8250192130 Independent Escort Service CoimbatoreCall Girl Coimbatore Prisha☎️  8250192130 Independent Escort Service Coimbatore
Call Girl Coimbatore Prisha☎️ 8250192130 Independent Escort Service Coimbatorenarwatsonia7
 
VIP Mumbai Call Girls Hiranandani Gardens Just Call 9920874524 with A/C Room ...
VIP Mumbai Call Girls Hiranandani Gardens Just Call 9920874524 with A/C Room ...VIP Mumbai Call Girls Hiranandani Gardens Just Call 9920874524 with A/C Room ...
VIP Mumbai Call Girls Hiranandani Gardens Just Call 9920874524 with A/C Room ...Garima Khatri
 
Ahmedabad Call Girls CG Road 🔝9907093804 Short 1500 💋 Night 6000
Ahmedabad Call Girls CG Road 🔝9907093804  Short 1500  💋 Night 6000Ahmedabad Call Girls CG Road 🔝9907093804  Short 1500  💋 Night 6000
Ahmedabad Call Girls CG Road 🔝9907093804 Short 1500 💋 Night 6000aliya bhat
 
Call Girl Bangalore Nandini 7001305949 Independent Escort Service Bangalore
Call Girl Bangalore Nandini 7001305949 Independent Escort Service BangaloreCall Girl Bangalore Nandini 7001305949 Independent Escort Service Bangalore
Call Girl Bangalore Nandini 7001305949 Independent Escort Service Bangalorenarwatsonia7
 
VIP Call Girls Pune Vrinda 9907093804 Short 1500 Night 6000 Best call girls S...
VIP Call Girls Pune Vrinda 9907093804 Short 1500 Night 6000 Best call girls S...VIP Call Girls Pune Vrinda 9907093804 Short 1500 Night 6000 Best call girls S...
VIP Call Girls Pune Vrinda 9907093804 Short 1500 Night 6000 Best call girls S...Miss joya
 
Kolkata Call Girls Services 9907093804 @24x7 High Class Babes Here Call Now
Kolkata Call Girls Services 9907093804 @24x7 High Class Babes Here Call NowKolkata Call Girls Services 9907093804 @24x7 High Class Babes Here Call Now
Kolkata Call Girls Services 9907093804 @24x7 High Class Babes Here Call NowNehru place Escorts
 
Call Girl Service Bidadi - For 7001305949 Cheap & Best with original Photos
Call Girl Service Bidadi - For 7001305949 Cheap & Best with original PhotosCall Girl Service Bidadi - For 7001305949 Cheap & Best with original Photos
Call Girl Service Bidadi - For 7001305949 Cheap & Best with original Photosnarwatsonia7
 
Russian Call Girls in Pune Riya 9907093804 Short 1500 Night 6000 Best call gi...
Russian Call Girls in Pune Riya 9907093804 Short 1500 Night 6000 Best call gi...Russian Call Girls in Pune Riya 9907093804 Short 1500 Night 6000 Best call gi...
Russian Call Girls in Pune Riya 9907093804 Short 1500 Night 6000 Best call gi...Miss joya
 
Call Girls Service in Bommanahalli - 7001305949 with real photos and phone nu...
Call Girls Service in Bommanahalli - 7001305949 with real photos and phone nu...Call Girls Service in Bommanahalli - 7001305949 with real photos and phone nu...
Call Girls Service in Bommanahalli - 7001305949 with real photos and phone nu...narwatsonia7
 
Artifacts in Nuclear Medicine with Identifying and resolving artifacts.
Artifacts in Nuclear Medicine with Identifying and resolving artifacts.Artifacts in Nuclear Medicine with Identifying and resolving artifacts.
Artifacts in Nuclear Medicine with Identifying and resolving artifacts.MiadAlsulami
 
Call Girls Hsr Layout Just Call 7001305949 Top Class Call Girl Service Available
Call Girls Hsr Layout Just Call 7001305949 Top Class Call Girl Service AvailableCall Girls Hsr Layout Just Call 7001305949 Top Class Call Girl Service Available
Call Girls Hsr Layout Just Call 7001305949 Top Class Call Girl Service Availablenarwatsonia7
 
Asthma Review - GINA guidelines summary 2024
Asthma Review - GINA guidelines summary 2024Asthma Review - GINA guidelines summary 2024
Asthma Review - GINA guidelines summary 2024Gabriel Guevara MD
 
Call Girls Service Jaipur Grishma WhatsApp ❤8445551418 VIP Call Girls Jaipur
Call Girls Service Jaipur Grishma WhatsApp ❤8445551418 VIP Call Girls JaipurCall Girls Service Jaipur Grishma WhatsApp ❤8445551418 VIP Call Girls Jaipur
Call Girls Service Jaipur Grishma WhatsApp ❤8445551418 VIP Call Girls Jaipurparulsinha
 
Call Girls Service Surat Samaira ❤️🍑 8250192130 👄 Independent Escort Service ...
Call Girls Service Surat Samaira ❤️🍑 8250192130 👄 Independent Escort Service ...Call Girls Service Surat Samaira ❤️🍑 8250192130 👄 Independent Escort Service ...
Call Girls Service Surat Samaira ❤️🍑 8250192130 👄 Independent Escort Service ...CALL GIRLS
 
Bangalore Call Girls Marathahalli 📞 9907093804 High Profile Service 100% Safe
Bangalore Call Girls Marathahalli 📞 9907093804 High Profile Service 100% SafeBangalore Call Girls Marathahalli 📞 9907093804 High Profile Service 100% Safe
Bangalore Call Girls Marathahalli 📞 9907093804 High Profile Service 100% Safenarwatsonia7
 
High Profile Call Girls Jaipur Vani 8445551418 Independent Escort Service Jaipur
High Profile Call Girls Jaipur Vani 8445551418 Independent Escort Service JaipurHigh Profile Call Girls Jaipur Vani 8445551418 Independent Escort Service Jaipur
High Profile Call Girls Jaipur Vani 8445551418 Independent Escort Service Jaipurparulsinha
 
Mumbai Call Girls Service 9910780858 Real Russian Girls Looking Models
Mumbai Call Girls Service 9910780858 Real Russian Girls Looking ModelsMumbai Call Girls Service 9910780858 Real Russian Girls Looking Models
Mumbai Call Girls Service 9910780858 Real Russian Girls Looking Modelssonalikaur4
 
Call Girl Surat Madhuri 7001305949 Independent Escort Service Surat
Call Girl Surat Madhuri 7001305949 Independent Escort Service SuratCall Girl Surat Madhuri 7001305949 Independent Escort Service Surat
Call Girl Surat Madhuri 7001305949 Independent Escort Service Suratnarwatsonia7
 
Call Girls Whitefield Just Call 7001305949 Top Class Call Girl Service Available
Call Girls Whitefield Just Call 7001305949 Top Class Call Girl Service AvailableCall Girls Whitefield Just Call 7001305949 Top Class Call Girl Service Available
Call Girls Whitefield Just Call 7001305949 Top Class Call Girl Service Availablenarwatsonia7
 

Recently uploaded (20)

Call Girl Coimbatore Prisha☎️ 8250192130 Independent Escort Service Coimbatore
Call Girl Coimbatore Prisha☎️  8250192130 Independent Escort Service CoimbatoreCall Girl Coimbatore Prisha☎️  8250192130 Independent Escort Service Coimbatore
Call Girl Coimbatore Prisha☎️ 8250192130 Independent Escort Service Coimbatore
 
VIP Mumbai Call Girls Hiranandani Gardens Just Call 9920874524 with A/C Room ...
VIP Mumbai Call Girls Hiranandani Gardens Just Call 9920874524 with A/C Room ...VIP Mumbai Call Girls Hiranandani Gardens Just Call 9920874524 with A/C Room ...
VIP Mumbai Call Girls Hiranandani Gardens Just Call 9920874524 with A/C Room ...
 
sauth delhi call girls in Bhajanpura 🔝 9953056974 🔝 escort Service
sauth delhi call girls in Bhajanpura 🔝 9953056974 🔝 escort Servicesauth delhi call girls in Bhajanpura 🔝 9953056974 🔝 escort Service
sauth delhi call girls in Bhajanpura 🔝 9953056974 🔝 escort Service
 
Ahmedabad Call Girls CG Road 🔝9907093804 Short 1500 💋 Night 6000
Ahmedabad Call Girls CG Road 🔝9907093804  Short 1500  💋 Night 6000Ahmedabad Call Girls CG Road 🔝9907093804  Short 1500  💋 Night 6000
Ahmedabad Call Girls CG Road 🔝9907093804 Short 1500 💋 Night 6000
 
Call Girl Bangalore Nandini 7001305949 Independent Escort Service Bangalore
Call Girl Bangalore Nandini 7001305949 Independent Escort Service BangaloreCall Girl Bangalore Nandini 7001305949 Independent Escort Service Bangalore
Call Girl Bangalore Nandini 7001305949 Independent Escort Service Bangalore
 
VIP Call Girls Pune Vrinda 9907093804 Short 1500 Night 6000 Best call girls S...
VIP Call Girls Pune Vrinda 9907093804 Short 1500 Night 6000 Best call girls S...VIP Call Girls Pune Vrinda 9907093804 Short 1500 Night 6000 Best call girls S...
VIP Call Girls Pune Vrinda 9907093804 Short 1500 Night 6000 Best call girls S...
 
Kolkata Call Girls Services 9907093804 @24x7 High Class Babes Here Call Now
Kolkata Call Girls Services 9907093804 @24x7 High Class Babes Here Call NowKolkata Call Girls Services 9907093804 @24x7 High Class Babes Here Call Now
Kolkata Call Girls Services 9907093804 @24x7 High Class Babes Here Call Now
 
Call Girl Service Bidadi - For 7001305949 Cheap & Best with original Photos
Call Girl Service Bidadi - For 7001305949 Cheap & Best with original PhotosCall Girl Service Bidadi - For 7001305949 Cheap & Best with original Photos
Call Girl Service Bidadi - For 7001305949 Cheap & Best with original Photos
 
Russian Call Girls in Pune Riya 9907093804 Short 1500 Night 6000 Best call gi...
Russian Call Girls in Pune Riya 9907093804 Short 1500 Night 6000 Best call gi...Russian Call Girls in Pune Riya 9907093804 Short 1500 Night 6000 Best call gi...
Russian Call Girls in Pune Riya 9907093804 Short 1500 Night 6000 Best call gi...
 
Call Girls Service in Bommanahalli - 7001305949 with real photos and phone nu...
Call Girls Service in Bommanahalli - 7001305949 with real photos and phone nu...Call Girls Service in Bommanahalli - 7001305949 with real photos and phone nu...
Call Girls Service in Bommanahalli - 7001305949 with real photos and phone nu...
 
Artifacts in Nuclear Medicine with Identifying and resolving artifacts.
Artifacts in Nuclear Medicine with Identifying and resolving artifacts.Artifacts in Nuclear Medicine with Identifying and resolving artifacts.
Artifacts in Nuclear Medicine with Identifying and resolving artifacts.
 
Call Girls Hsr Layout Just Call 7001305949 Top Class Call Girl Service Available
Call Girls Hsr Layout Just Call 7001305949 Top Class Call Girl Service AvailableCall Girls Hsr Layout Just Call 7001305949 Top Class Call Girl Service Available
Call Girls Hsr Layout Just Call 7001305949 Top Class Call Girl Service Available
 
Asthma Review - GINA guidelines summary 2024
Asthma Review - GINA guidelines summary 2024Asthma Review - GINA guidelines summary 2024
Asthma Review - GINA guidelines summary 2024
 
Call Girls Service Jaipur Grishma WhatsApp ❤8445551418 VIP Call Girls Jaipur
Call Girls Service Jaipur Grishma WhatsApp ❤8445551418 VIP Call Girls JaipurCall Girls Service Jaipur Grishma WhatsApp ❤8445551418 VIP Call Girls Jaipur
Call Girls Service Jaipur Grishma WhatsApp ❤8445551418 VIP Call Girls Jaipur
 
Call Girls Service Surat Samaira ❤️🍑 8250192130 👄 Independent Escort Service ...
Call Girls Service Surat Samaira ❤️🍑 8250192130 👄 Independent Escort Service ...Call Girls Service Surat Samaira ❤️🍑 8250192130 👄 Independent Escort Service ...
Call Girls Service Surat Samaira ❤️🍑 8250192130 👄 Independent Escort Service ...
 
Bangalore Call Girls Marathahalli 📞 9907093804 High Profile Service 100% Safe
Bangalore Call Girls Marathahalli 📞 9907093804 High Profile Service 100% SafeBangalore Call Girls Marathahalli 📞 9907093804 High Profile Service 100% Safe
Bangalore Call Girls Marathahalli 📞 9907093804 High Profile Service 100% Safe
 
High Profile Call Girls Jaipur Vani 8445551418 Independent Escort Service Jaipur
High Profile Call Girls Jaipur Vani 8445551418 Independent Escort Service JaipurHigh Profile Call Girls Jaipur Vani 8445551418 Independent Escort Service Jaipur
High Profile Call Girls Jaipur Vani 8445551418 Independent Escort Service Jaipur
 
Mumbai Call Girls Service 9910780858 Real Russian Girls Looking Models
Mumbai Call Girls Service 9910780858 Real Russian Girls Looking ModelsMumbai Call Girls Service 9910780858 Real Russian Girls Looking Models
Mumbai Call Girls Service 9910780858 Real Russian Girls Looking Models
 
Call Girl Surat Madhuri 7001305949 Independent Escort Service Surat
Call Girl Surat Madhuri 7001305949 Independent Escort Service SuratCall Girl Surat Madhuri 7001305949 Independent Escort Service Surat
Call Girl Surat Madhuri 7001305949 Independent Escort Service Surat
 
Call Girls Whitefield Just Call 7001305949 Top Class Call Girl Service Available
Call Girls Whitefield Just Call 7001305949 Top Class Call Girl Service AvailableCall Girls Whitefield Just Call 7001305949 Top Class Call Girl Service Available
Call Girls Whitefield Just Call 7001305949 Top Class Call Girl Service Available
 

Sampling

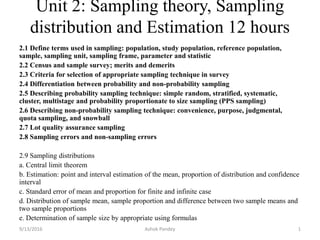
  • 1. Unit 2: Sampling theory, Sampling distribution and Estimation 12 hours 2.1 Define terms used in sampling: population, study population, reference population, sample, sampling unit, sampling frame, parameter and statistic 2.2 Census and sample survey; merits and demerits 2.3 Criteria for selection of appropriate sampling technique in survey 2.4 Differentiation between probability and non-probability sampling 2.5 Describing probability sampling technique: simple random, stratified, systematic, cluster, multistage and probability proportionate to size sampling (PPS sampling) 2.6 Describing non-probability sampling technique: convenience, purpose, judgmental, quota sampling, and snowball 2.7 Lot quality assurance sampling 2.8 Sampling errors and non-sampling errors 2.9 Sampling distributions a. Central limit theorem b. Estimation: point and interval estimation of the mean, proportion of distribution and confidence interval c. Standard error of mean and proportion for finite and infinite case d. Distribution of sample mean, sample proportion and difference between two sample means and two sample proportions e. Determination of sample size by appropriate using formulas 9/13/2016 Ashok Pandey 1
  • 2. 2.1 Define terms used in sampling: population, study population, reference population, sample, sampling unit, sampling frame, parameter and statistic 9/13/2016 Ashok Pandey 2
  • 3. Why sample? Save time and money More effort to ensure high-quality measurement if smaller sample 9/13/2016 3 Ashok Pandey
  • 4. Criteria for a Good Sample Samples can be selected in two ways • Purposive Sample • Random sample Purposive sample or Non-probability Sample Sample units are selected from the population to suit a specific purpose as per the desire of the investigator These samples serves very limited purpose 9/13/2016 4 Ashok Pandey
  • 5. Sample Size • The question remains as to what constitutes an adequate sample size. • Samples should be as large as a researcher can obtain with a reasonable expenditure of time and energy. • The recommended minimum number of subjects are as follows for the following types of studies: – 100 for a Descriptive Study – 50 for a Correlational Study – 30 in each group for Experimental and Causal-Comparative Study The use of 15 subjects per group should probably be replicated
  • 6. Examples of population and samples Situation Population Sample Sex ratio of births the world’s birth some hospital records Is my well water safe? Water in well Vial in lab Medical study people in Nepal some subjects 6 9/13/2016 Ashok Pandey
  • 7. Technical Terms • A sampling frame is a list of sampling units. • A sample is a collection of sampling units drawn from a sampling frame. • Parameter: numerical characteristic of a population • Statistic: numerical characteristic of a sample 9/13/2016 7 Ashok Pandey
  • 8. Sampling Terms • Target Population: – Specific pool of cases or sample that researchers wants to study. • Sampling Ratio: – Size of the sample / size of the target population. – For example – The population has 50,000 people, and a researcher draws a sample of 150 from it. Researchers sampling ratio is 150/50,000 = 0.03 or 0.3 percent. 9/13/2016 8 Ashok Pandey
  • 9. Sampling • Sampling is a process of systematically selecting cases for inclusion in a research project. • Sampling involves the selection of a number of study units from a defined study population. 9/13/2016 9 Ashok Pandey
  • 10. What is Sampling? • Sampling is the process of selecting observations (a sample) to provide an adequate description and robust inferences of the population • It is the process of selecting a sufficient number of elements from the population so that by studying the sample, and understanding the properties or characteristics of the sample subjects, it would be possible to generalise the properties or characteristics to the population elements. • The more representative the sample is of the population, the more generalizable are the findings of the research 10 9/13/2016 Ashok Pandey
  • 11. What is Sampling…. Population Sample Using data to say something (make an inference) with confidence, about a whole (population) based on the study of a only a few (sample). Sampling Frame Sampling Process What you want to talk about What you actually observe in the data Inference 11 9/13/2016 Ashok Pandey
  • 13. Sampling Frame • List of population units from which the sample units are to be selected. • If Sampling frame - not available, Prepare it – • From - Telephone Directories, Tax Records, Driver’s License Records. • A good sampling frame is crucial to good sampling. 9/13/2016 13 Ashok Pandey
  • 17. Steps in Sampling • Defining the population to be covered • Defining sampling units • Acquiring frame / list of the population elements • Deciding about the size of the sample • Deciding about the type of the sample to be used and • Testing the reliability of the sample 9/13/2016 17 Ashok Pandey
  • 18. Levels of sample selection Target population(s) - population(s) to which the results can be applied Source population - population(s) from which eligible subjects are drawn Eligible population - population(s) of subjects eligible for inclusion in study Study participants - individuals who contribute data to the study: results apply directly only to these subjects 9/13/2016 18 Ashok Pandey
  • 20. Factors to be considered in sampling process * Study Objectives - Descriptive vs. Analytic * Selection Criteria - Inclusion & Exclusion - Probability vs. Non-probability * Sampling Frame & Sampling Units - Unit - Time & Place * Strategies in approaching sampling units - Identification & Classification - Willing/Consent to Participate O P D 9/13/2016 20 Ashok Pandey
  • 21. 1 ) Is the population from which the sample is drawn consistent with the population of interest for the study? (generalizability/external validity) 2) Have the methods for selecting subjects or units biased the sample? (bias/internal validity) 3) Are the estimates or sample statistics sufficiently precise for the study purpose? (power/sample size/precision) Sampling Issues 9/13/2016 21 Ashok Pandey
  • 22. Sample Size Determination The researchers should consider various factors as follows; 1) Expense, time, labor and data collection tools. 2) Population size. 3) Similarity; the more of similar population, the usage of samples size will be small. If the population is very different, there will be plenty of variances, therefore, the usage of sample size will be large. 4) Accuracy 5) Sampling error 6) Reliability 9/13/2016 Ashok Pandey 22
  • 23. Requirements for estimation of Size of the sample An approximate idea of the estimate of the characteristic under observation Variability of this characteristic from unit to unit in the population Initial knowledge of the desired accuracy of the estimate of the characteristic under study Probability level within which the desired precision of estimates is to be maintained Availability of the experimental material, resources and other practical considerations 9/13/2016 23 Ashok Pandey
  • 24. Factors to determine sample size • Size of population • Resources – subjects, financial, manpower • Method of Sampling- random, stratified • Degree of difference to be detected • Variability (S.D.) – pilot study, historical • Degree of Accuracy (or errors) - Type I error (alpha) p<0.05 - Type II error (beta) less than 0.2 (20%) - Power of the test : more than 0.8 (80%) • Statistical Formulae • Dropout rate, non-compliance to Rx 24
  • 25. Sample size determination: 1. Sample size determination by using criteria - Hundreds of populations; use 15-30% of sample size - Thousands of populations; use 10-15% of sample size - Tens Thousands of populations; use 5-10% of sample size - Hundreds Thousands of population; use 1-5% of sample size 2. Sample size determination by calculation formulas. 3. Sample size determination by using tables. 4. Sample size determination by calculating computer programs. 9/13/2016 Ashok Pandey 25
  • 26.
  • 27. Calculation of sample size for field surveys For Field surveys to estimate the prevalence rates n = ( 4pq / L2 ) where n is the required sample size p is the approximate prevalence rate q= (1-p) L is the permissible error in the estimate of p stimates calculated with this sample size would be true in 95 out of 100 samples 100 samples 9/13/2016 27 Ashok Pandey Cochran Formula (Cochran, 1977)
  • 28. p = 40% q = (100-40 ) = 60% L = 5% of 40% = 2% n = ( 4 x 40 x 60) / ( 22 ) = (4 x 40 x 60 ) / 4 = 2400 2,400 persons are to be examined to estimate the prevalence rate with 5% error. If we increase the error percentage to 10% L=10% of 40% = 4 n = ( 4 x 40 x 60 ) / 16 = 600 9/13/2016 28 Ashok Pandey
  • 29. For finite population =n/1+n/N Where, N= Sampling frame population (3000) n= Required sample size (600) (600/1+600)/3000 =500 9/13/2016 Ashok Pandey 29
  • 30. HW (Rough) Prevalence: (Cite) Formula: 4PQ/L2 Where, P=18 Q=100-18=82 L=5% of 18 = 0.9 4*18*82/(5*5) = 236 Total population: 1920 Finite population: =n/1+n/N Where, Sample size: 211 Non-response rate 10% Required sample size: 211+21=232 9/13/2016 Ashok Pandey 30
  • 31. For Quantitative data, the sample size is calculated from the formula. n = (tα 2 x s2 ) / e2 n is the desired sample size s is the standard deviation of observations e is the permissible error in the estimation of mean difference tα is the value of t at 5% level from t tables 9/13/2016 31 Ashok Pandey
  • 32. In a survey to estimate the haemoglobin level If mean Hb% level is approximately 12gm% Standard deviation 1.5gm% Permissible error 0.5gm% s=1.5gms e = 0.5gms t0.05 can be taken as 2, as it is conventional to use 5% level of significance n = { 22 x (1.5) 2 } / (0.52 ) = (4 x 2.25 ) / (2.25 ) = 36 persons 9/13/2016 32 Ashok Pandey
  • 33. 9/13/2016 Ashok Pandey 33 Formulas for Sample Size (SS) For Infinite Sample Size SS = [Z2p (1 − p)]/ C2 For Finite Sample Size SS/ [1 + {(SS − 1)/Pop}] Where, •SS = Sample size •Z = Given Z value •p = Percentage of population •C = Confidence level •Pop = Population Check: Z Score Table
  • 34. 9/13/2016 Ashok Pandey 34 Question: Find the sample size for a finite and infinite population when the percentage of 4300 population is 5, confidence level 99 and confidence interval is 0.01? Solution: Z = From the z-table, we have the value of confidence level, that is 2.58 by applying given data in the formula: SS=(2.58)2×0.05×(1−0.05)0.012=316 Sample size for finite population =3161+316−14300=294 New SS = 294
  • 35. Probability proportionate to size sampling (PPS sampling) 9/13/2016 Ashok Pandey 35 Probability proportional sampling, usually known as probability proportional to size (PPS) sampling, is an unequal probability sampling technique, in which the probability of selection for each sampling unit in the population is proportional to an auxiliary variable.
  • 36. 36 Sampling with Probability Proportional to Size (PPS) • Probability of selection is related to an auxiliary variable, Z, that is a measure of “size” Example Number of households Area of farms • “Larger” units are given higher chance of selection than “smaller” units • Selection probability of ith unit is i = 1,2, … , N PPS Sampling ∑ = = N i i i i Z Z p 1
  • 37. 37 PPS Selection Procedures • Cumulative total method: with replacement • Cumulative total method: without replacement • PPS systematic sampling • Lahiri’s method PPS Sampling
  • 38. 38 Cumulative Total Method • Sampling unit: village • Measure of size: number of households in village • Selection probability: Select a sample of 5 villages using varying probability WR sampling, the size being the number of households Solution PPS Selection pi
  • 39. • Write down cumulative total for the sizes Zi, i=1,2..N • Choose a random number r such that 1 ≤ r ≤ Z • Select ith population unit if • Ti-1 ≤ r ≤ Ti where Ti-1 = Z1 + Z2 + .. + Zi-1 and Ti = Z1 + Z2 + .. + Zi Cumulative Total Method (Contd.) PPS Selection
  • 40. 40 • To select a village, a random number r, 1 ≤ r ≤ 700, is selected. • Suppose r = 259, Since 231 ≤ 259 ≤ 288, the 7th village is therefore selected. The next 4 random numbers to be considered are 548, 170, 231, 505. Hence the required sample selected using PPS with replacement are 16th, 5th, 7th, 15th . Note: The 7th village is selected twice. Cumulative Total Method (Contd.) PPS Selection
  • 41. 41 • For a PPSWR selection therefore the sample would be: 16th, 5th, 7th, 15th , with 7th village repeated. • For a PPSWOR selection, we have to continue further to get 5 distinct units in the sample. • Suppose the next random selected is r = 375, The required PPSWOR sample would be 16th, 5th, 7th, 15th & 11th . Cumulative Total Method (Contd.) PPS Selection
  • 42. 42 • Derive cumulative totals for the sizes Zi, i=1,2..N, and allot random numbers to different units. • Calculate interval k = ZN /n (in this case 700/5 = 140) • Select a random number r (say 101) from 1 to k; and obtain r+k, r+2k, r+3k, …, r+(n-1)k • In this case, the selected cumulative sizes are 101, 241, 382, 523 & 664. PPS Systematic PPS Selection
  • 43. 43 • Thus the selected units are: 3rd (for 101), 7th (for 241), 11th (for 382), 15th (for 523) & 20th (for 664) • Note: If any unit has size greater than k, it may be selected more than once. PPS Systematic (Contd.) PPS Selection
  • 44. 44 Lahiri’s Method • A procedure which avoids the need of calculating cumulative totals for each unit has been given by Lahiri (1951) Steps involved; 1. Select a random number i from 1 to N 2. Select another random number j, such that 1 ≤ j ≤ M, where M is either equal to the maximum of sizes Zi, i =1,2,.. N, or is more than the maximum size in the population. 3. If j ≤ Zi , the ith unit is selected, otherwise, the pair (i, j) of random numbers is rejected and another pair is chosen by repeating the steps (1) and (2) PPS Selection
  • 45. 45 Select a sample of 2 villages using varying probability WR sampling, the size being the number of households Solution • N =20, n=2 , M =58 • Select a random number i, 1 ≤ i ≤ 14, • Then a second random number j, 1 ≤ j ≤ 58, • Suppose the 1st pair of random number is (2, 30). Since 30 ≤ 45 thus 2nd village is selected . PPS Sampling Lahiri’s Method
  • 46. 46 Solution (continued) • Similarly we find the next pair of random number (12, 47) since 47 >30, the 12th village is not selected The 3rd pair ot random numbers (7, 40) results in the selection of 7th village since 40 ≤ 58 • Hence, the selected sample are 2nd and 7th villages. PPS Sampling Lahiri’s Method
  • 49. Probability sampling • Is the random selection of elements from the population. • Probability sampling is a technique in which the researcher chooses samples from a larger population using a method based on probability theory. For a participant to be considered as a probability sample, he/she must be selected using a random selection. • This statistical method used to select a sample from a population in such a way that each member of the population has a known, non-zero chance of being selected. The most critical requirement of probability sampling is that everyone in your population has a known and equal chance of getting selected. • Probability sampling uses statistical theory to randomly select a small group of people (sample) from an existing large population and then predict that all their responses will match the overall population. 9/13/2016 Ashok Pandey 49
  • 51. Advantages of probability sampling 1. It’s Cost-effective: This process is cost and time effective. A larger sample can also be chosen based on numbers assigned to the samples. Then you can choose random numbers from the more significant sample. 2. It’s simple and straightforward: Probability sampling is an easy way as it does not involve a complicated process. It’s quick and saves time. The time saved can thus be used to analyze the data and draw conclusions. 3. It is non-technical: This sampling method doesn’t require any technical knowledge because of its simplicity. It doesn’t require intricate expertise and is not at all lengthy. You can also avoid sampling errors. 9/13/2016 Ashok Pandey 51
  • 52. Methods of Sampling - Probability Sampling · · 1. Simple Random Sampling: Objective: To select n units out of N such that each NCn has an equal chance of being selected. Procedure: Use a table of random numbers, a computer random number generator, or a mechanical device to select the sample. 1 2 3 4 5 6 7 8 9 10 11 12 13 14 15 16 17 18 19 20 21 22 23 24 25 26 27 28 29 30 31 32 33 34 35 36 37 38 39 40 41 42 43 44 45 46 47 48 49 50 1 2 3 4 5 6 7 8 9 10 11 12 13 14 15 16 17 18 19 20 21 22 23 24 25 26 27 28 29 30 31 32 33 34 35 36 37 38 39 40 41 42 43 44 45 46 47 48 49 50 N = 50 n = 10 Sampling Frame 1 2 3 4 5 ….. 49 50 9/13/2016 52 Ashok Pandey
  • 53. Simple Random Sampling • Lottery Method – With replacement (Unrestricted random sampling ) – Without replacement (Restricted random sampling) • Random number table method 9/13/2016 53 Ashok Pandey
  • 54. TABLE OF RANDOM NUMBERS 53 74 23 99 67 61 32 28 69 84 94 62 63 38 06 86 54 99 00 65 26 94 02 82 35 30 58 21 46 06 72 17 10 94 25 21 63 43 36 82 69 65 51 18 37 88 61 38 98 25 37 55 26 01 91 82 81 46 74 71 02 63 21 17 69 71 50 80 89 56 38 15 64 55 22 21 82 48 22 28 06 00 61 54 85 07 26 13 89 01 10 07 82 04 59 63 58 54 16 24 15 51 54 44 82 00 62 61 34 85 27 84 87 61 48 64 56 26 90 18 03 92 18 27 46 57 99 16 96 56 30 33 62 95 30 27 59 37 75 41 66 48 86 97 08 45 93 15 22 60 21 75 46 91 98 77 07 08 55 18 40 45 44 75 13 90 24 94 01 85 89 95 66 51 10 19 34 88 15 84 72 84 71 14 35 19 11 58 49 26 50 11 88 78 28 16 84 13 52 53 94 53 75 45 45 17 75 65 57 28 40 19 72 12 25 12 96 76 28 12 54 22 01 11 95 25 71 96 43 31 67 72 30 24 02 94 08 63 38 32 50 44 66 44 21 66 06 58 05 62 68 15 22 66 22 15 86 26 63 75 41 99 58 42 96 24 40 14 51 23 22 30 88 57 95 67 9/13/2016 54 Ashok Pandey
  • 55. Mixed Sampling • Notice that from the first interval the choice of an element is on a random basis but the choice of the elements from subsequent intervals is dependent upon the choice from the first, and hence cannot be classified as a random sample. For this reason it has been classified here as mixed sampling. • Although the general procedure for selecting a sample by the systematic sampling technique is described above, one can deviate from it by selecting a different element from each interval with the Simple Random Sampling technique. By adopting, systematic sampling can be classified under probability sampling design. 9/13/2016 55 Ashok Pandey
  • 56. Mixed Sampling · · Systematic Sampling Procedure: 1. Number the units in the population from 1 to N; 2. Decide on the n (sample size) that you want or need; 3. Calculate the interval size k = N/n; 4. Randomly select an integer between 1 to k 5. Take every kth unit 1 2 3 4 5 6 7 8 9 10 11 12 13 14 15 16 17 18 19 20 21 22 23 24 25 26 27 28 29 30 31 32 33 34 35 36 37 38 39 40 41 42 43 44 45 46 47 48 49 50 N = 50 n = 10 k = 50/10 = 5 1 2 3 4 5 6 7 8 9 10 11 12 13 14 15 16 17 18 19 20 21 22 23 24 25 26 27 28 29 30 31 32 33 34 35 36 37 38 39 40 41 42 43 44 45 46 47 48 49 50 1 2 3 4 5 6 7 8 9 10 11 12 13 14 15 16 17 18 19 20 21 22 23 24 25 26 27 28 29 30 31 32 33 34 35 36 37 38 39 40 41 42 43 44 45 46 47 48 49 50 1 2 3 4 5 6 7 8 9 10 11 12 13 14 15 16 17 18 19 20 21 22 23 24 25 26 27 28 29 30 31 32 33 34 35 36 37 38 39 40 41 42 43 44 45 46 47 48 49 50 9/13/2016 56 Ashok Pandey
  • 57. Systematic random sampling 9/13/2016 Ashok Pandey 57 Procedure: Use a table of random numbers, a computer random number generator, or a mechanical device to select the sample. Example k = N/n =1920/210=9 1 2 3 4 5 6 7 8 9 10 11 12 13 14 15 16 17 18 19 20 21 22 23 24 25 26 27 28 ….. 190
  • 58. Systematic Sampling Advantages: 1) Do not need to know the entire sampling frame in advance, just the total number of sampling units; can be constructed as the study progresses, so ordering is by time of accrual 2) Often simpler to implement under field conditions than other sampling methods (e.g. easier to have interviewer to visit every 5th house on the block rather than to determine which houses are to be visited by means of a table of random numbers) 3) If a trend is present in the sampling frame, units will small values to units with large values, than a systematic sample will ensure coverage of the spectrum of units 9/13/2016 58 Ashok Pandey
  • 59. Systematic Sampling Disadvantage: 1) If cyclical trends exist in the data, a poor estimate of the mean will be obtained (e.g., the prevalence of bronchitis would be considerable higher if one sampled every 12th month starting in January than every 12th month starting in July) 9/13/2016 59 Ashok Pandey
  • 60. Methods of Sampling - Probability Sampling · · 2. Stratified Random Sampling, (quota random sampling) Procedure: 1. Divide the population into non-overlapping homogeneous subgroups (i.e., strata) N1, N2, N3, ... Ni, such that N1 + N2 + N3 + ... + Ni = N. 2. Do a simple random sample of f = n/N in each strata. 1 2 3 4 5 6 7 8 9 10 11 12 13 14 15 16 17 18 19 20 21 22 23 24 25 26 27 28 29 30 1 2 3 4 5 6 7 8 9 10 11 12 13 14 15 16 17 18 19 20 21 22 23 24 25 26 27 28 29 30 31 32 33 34 35 36 37 38 39 40 41 42 43 44 45 46 47 48 49 50 31 32 33 34 35 36 37 38 39 40 41 42 43 44 45 46 47 48 49 50 Sampling Frame .. 12 ….. 20 .. 1 30 31 … 50 N = 50 (N1 30; N2 =20) n = 10 f = 10/50 = 0.2 thus n1 = 0.2 x 30 = 6 n2 = 0.2 x 20 = 4 9/13/2016 60 Ashok Pandey
  • 61. Stratified Sampling Advantages: 1) Investigator can make certain that each subgroup in the population is represented; guarantees mean heights of each subgroup can be estimated separately in addition to the overall mean 2) When population divided into subgroups that are more homogeneous than population as a whole, a more precise estimate of population parameters are obtained than when a simple random sample is taken, because variance computed from the entire sample is based on each within-stratum variance 9/13/2016 61 Ashok Pandey
  • 62. Stratified Sampling Advantages: 3) Strata can be constructed so that those that are least expensive to study or have the largest variances or largest number of individuals can be sampled most heavily 4) Administratively it may be easier to deal with strata Disadvantage: Loss of precision can occur if very small numbers of units a sampled within individual strata; although under most circumstances, greater precision is attained by stratum-spec estimates of a homogeneous group 9/13/2016 62 Ashok Pandey
  • 63. Methods of Sampling - Probability Sampling · 4. Cluster (or Area) Random Sampling Procedure: 1. Divide population into clusters (usually geographic boundaries) 2. Randomly sample clusters 3. Measure all units within sampled clusters 1 2 3 4 5 6 7 8 9 10 N = 50 n = 22 35 36 37 38 39 40 41 42 43 44 45 11 12 13 14 15 16 17 18 19 20 21 22 23 24 25 26 27 28 29 30 31 32 33 34 46 47 48 49 50 1 2 3 4 5 6 7 8 9 10 28 29 30 31 32 33 34 46 47 48 49 50 · 9/13/2016 63 Ashok Pandey
  • 64. Cluster Sampling • A researcher first samples clusters, each of which contains elements, then draws a second sample from within the clusters selected in the first stage of sampling. Clusters are often geographic units (e.g. districts, villages) or organizational units (e.g. clinics, training groups). • Cluster sampling is usually less expensive than simple random sampling, but it is less accurate. A researcher who uses cluster sampling must decide the numbers of clusters and the number of elements within clusters. • For example – In a study of the KAP related to family planning in rural communities of a region, a list is made of all the villages. Using this list, a random sample of villages is chosen and all the adults in the selected villages are interviewed. 9/13/2016 64 Ashok Pandey
  • 65. Cluster Sampling Advantages: 1) One need not enumerate the entire population in advance, just the total number of clusters; then just the units of selected clusters 2) More economical than simple random sampling Disadvantage: Factor representing cluster effect must be accounted for in analysis, complex (violates assumption of independence) 9/13/2016 65 Ashok Pandey
  • 66. Multistage (Multi-cluster) Sampling Primary (larger) sampling units are first selected from a population Secondary (smaller) sampling units (e.g. city blocks) are sampled from within each chosen primary unit Can be extended so that tertiary units (e.g. households) or further (e.g. individuals) are selected within these secondary units Differs from clustering in that secondary units are sampled, whereas in cluster sampling all secondary units are included. 9/13/2016 66 Ashok Pandey
  • 67. Non-probability sampling Non-probability sampling is a method of selecting units from a population using a subjective (i.e. non-random) method. Since non-probability sampling does not require a complete survey frame, it is a fast, easy and inexpensive way of obtaining data. However, in order to draw conclusions about the population from the sample, it must assume that the sample is representative of the population. 9/13/2016 Ashok Pandey 67
  • 68. Non-probability sampling There are five key reasons behind this trend: • the decline in response rates in probability surveys; • the high cost of data collection; • the increased burden on respondents; • the desire for access to real-time statistics, and • the surge of non-probability data sources such as web surveys and social media. 9/13/2016 Ashok Pandey 68
  • 69. Example 1. An example of convenience sampling would be using student volunteers known to the researcher. Researchers can send the survey to students belonging to a particular school, college, or university, and act as a sample. 2. In an organization, for studying the career goals of 500 employees, technically, the sample selected should have proportionate numbers of males and females. Which means there should be 250 males and 250 females. Since this is unlikely, the researcher selects the groups or strata using quota sampling. 3. Researchers also use this type of sampling to conduct research involving a particular illness in patients or a rare disease. Researchers can seek help from subjects to refer to other subjects suffering from the same ailment to form a subjective sample to carry out the study. 9/13/2016 Ashok Pandey 69
  • 70. Convenience or Haphazard Sampling • Cheap and quick • Study units that happen to be available at the time of data collection are selected in the sample • Choose when population is not clearly defined, sampling units are not clear. • When a researcher haphazardly selects cases that are convenient researcher can easily get a sample that seriously misrepresents the population. – Some units over selected, other under selected or missed altogether – Causes ineffective, unrepresentative samples. 9/13/2016 70 Ashok Pandey
  • 71. Convenience or Haphazard Sampling • Examples: • The person-on-the-street interview conducted by television programs is an example of a haphazard sample. Television interviewers go out on the street with camera and microphone to talk to a few people who are convenient to interview. • A researcher wants to study the attitudes of villagers toward family planning services provided by MCH clinic. He decides to interview all adult patients who visit the out-patient clinic during one particular day. This is more convenient than taking a random sample of people in the village, and it gives a useful first impression. 9/13/2016 71 Ashok Pandey
  • 72. Purposive or Judgmental Sampling • Researcher deliberately selects certain units for study from the population • Choice of the selection is supreme and nothing is left to chance Appropriate in 3 situations: • For unique cases selection that are especially informative • For selection of members of difficult to reach, specialized population • Another situation for purposive sampling occurs when a researcher wants to identify particular types of cases for in-depth investigation. 9/13/2016 72 Ashok Pandey
  • 73. Types of purposive sampling • Maximum variation sampling. • Homogeneous sampling. • Typical case sampling. • Extreme (or deviant) case sampling. • Critical case sampling. • Total population sampling. • Expert sampling. 9/13/2016 Ashok Pandey 73
  • 74. Quota Sampling • Pre plan number of subjects in specified categories (e.g. 100 men and 100 women) • Once the quota sample fixes the categories and number of cases in each category, researcher uses convenient sampling 9/13/2016 74 Ashok Pandey
  • 75. Snowball Sampling • Selecting the cases in a network • Begins with one or a few people or cases and spread out on the basis of links to the initial cases 9/13/2016 75 Ashok Pandey
  • 76. Snowball • Recruiting people based on recommendation of people you have just interviewed • Useful for studying invisible/illegal populations, such as drug addicts Main person Friend Friend Friend Friend Friend Friend Friend Friend Friend Friend Friend Friend Friend Friend Friend Friend Friend Friend Friend
  • 77. Respondent-driven sampling (RDS) RDS is a type of snowball sampling used for analyzing characteristics of hidden or hard- to-reach populations. It was developed in 1997 by Dr. Douglas Heckathorn, a professor of Sociology at Cornell and has been applied to groups ranging from men who have sex with men, injection drug users, and children living on the street
  • 79. Others • Crowdsourcing: Crowdsourcing has been defined slightly differently by researchers from various areas. • Web panels: A web panel (or online or internet panel) could be defined as an access panel of people willing to respond to web questionnaires. 9/13/2016 Ashok Pandey 79
  • 80. 80 What is LQAS (Lot Quality Assurance Sampling)? • LQAS is a sampling method developed to control the quality of manufactured goods produced in ‘lots.’ • LQAS takes a small random sample and tests the sample for quality. • The sample will tell if program activities (agriculture, health, etc.) are meeting/not a performance benchmark • The sample size is chosen so that there is a high probability of determining what indicators in a given activity are meeting or not meeting the performance benchmark.
  • 81. 81
  • 82. Difference between non-probability sampling and probability sampling 9/13/2016 Ashok Pandey 82
  • 83. ERRORS IN RESEARCH Non-sampling errors • Coverage errors • Response errors • Non-response errors • Processing errors • Measurement errors • Estimation errors • Analysis errors Sampling errors • Sample size • Population size • Variability of the characteristic of interest • Sample plan 9/13/2016 83 Ashok Pandey
  • 84. Types of Survey Errors • Coverage error • Non response error • Sampling error • Measurement error Excluded from frame. Follow up on non responses. Chance differences from sample to sample. Bad Question!
  • 85. 1. Sampling error – random error- the sample selected is not representative of the population due to chance – The uncertainty associated with an estimate that is based on data gathered from a sample of the population rather than the full population is known as sampling error. – Sampling errors are the random variations in the sample estimates around the true population parameters. 85
  • 86. Sampling error cont’d… the level of it is controlled by sample size a larger sample size leads to a smaller sampling error. it decreases with the increase in the size of the sample, and it happens to be of a smaller magnitude in case of homogeneous population. When n = N ⇒ sampling error = 0  Can not be avoided or totally eliminated 86
  • 87. Sampling error cont’d… why do sample estimates have uncertainty associated with them? There are two reasons. Estimates of characteristics from the sample data can differ from those that would be obtained if the entire population were surveyed. Estimates from one subset or sample of the population can differ from those based on a different sample from the same population (sample to sample variations). 87
  • 88. The cause of sampling error Chance: main cause of sampling error and is the error that occurs just because of bad luck. Sampling bias: Sampling bias is a tendency to favor the selection of participants that have particular characteristics. The chance component (sometimes called random error) exists no matter how carefully the selection procedures are implemented, and the only way to minimize chance- sampling errors is to select a sufficiently large sample. 88
  • 89. 2. Non Sampling Error It is a type of systematic error in the design or conduct of a sampling procedure which results in distortion of the sample, so that it is no longer representative of the reference population. We can eliminate or reduce the non-sampling error (bias) by careful design of the sampling procedure and not by increasing the sample size. It can occur whether the total study population or a sample is being used. 89
  • 90. Non-sampling Error…… o The basic types of non-sampling error – Non-response error – Response or data error o A non-response error occurs when units selected as part of the sampling procedure do not respond in whole or in part – If non-respondents are not different from those that did respond, there is no non-response error – When non-respondents constitute a significant proportion of the sample (about 15% or more 90
  • 91. Non-sampling Error……. o A response or data error is any systematic bias that occurs during data collection, analysis or interpretation – Respondent error (e.g., lying, forgetting, etc.) – Interviewer bias – Recording errors – Poorly designed questionnaires 91
  • 92. Non-Sampling Error cont’d … Systematic error makes survey results unrepresentative of the target population by distorting the survey estimates in one direction. Random error can distort the results in any given direction but tend to balance out on average Thus, the total survey error 92 sampling error + non-sampling error
  • 93. Improving Response Rates Prior Notification Motivating Respondents Incentives Questionnaire Design and Administration Follow-Up Other Facilitators Callbacks Methods of Improving Response Rates Reducing Refusals Reducing Not-at-Homes
  • 94. 2.9 Sampling distributions a. Central limit theorem b. Estimation: point and interval estimation of the mean, proportion of distribution and confidence interval c. Standard error of mean and proportion for finite and infinite case d. Distribution of sample mean, sample proportion and difference between two sample means and two sample proportions 9/13/2016 Ashok Pandey 94
  • 95. Central limit theorem For simple random samples from any population with finite mean and variance, as n becomes increasingly large, the sampling distribution of the sample means is approximately normally distributed. 9/13/2016 Ashok Pandey 95
  • 96. n↑ Central Limit Theorem As the sample size gets large enough… the sampling distribution of the sample mean becomes almost normal regardless of shape of population x
  • 97. Normal Uniform Skewed Population n = 2 n = 30 X  X  X  X  General The Central Limit Theorem Applies to Sampling Distributions from Any Population
  • 99. 14-99 Standard Errors Standard Error (Z score) % of Area Approximate Degree of Confidence 1.00 68.27 68% 1.65 90.10 90% 1.96 95.00 95% 3.00 99.73 99%
  • 100. Central Limit Theorem: Proportions AND Means RULE: If many samples or repetitions of the SAME SIZE are taken, the frequency curve made from STATISTICS from the SAMPLES will be approximately normally distributed Categorical (2 outcomes) PROPORTIONS (𝒑’s): • Assumptions: 1. Population w/fixed proportion 2. Random sample from population 3. np5 and n(1-p)5 (“large” samples) • MEAN of samples 𝒑’s will be population proportion (p) • STANDARD DEVIATION of the sample proportions (𝒑′s) will be: Quantitative (Measurement) MEANS (𝑿’s ): • Conditions/Assumptions 1. If population bell-shaped (normal), random sample of any size 2. If population not bell-shaped, a large random sample ( 30) – MEAN of sample means (𝑿’s) will be population mean (𝝁) – STANDARD DEVIATION of the sample means (𝑿’s) will be: 𝒑  𝜇𝒑 = 𝒑  𝜇𝒙 = 𝝁
  • 101. Estimation: point and interval estimation of the mean, proportion of distribution and confidence interval • An estimator of a population parameter is – a random variable that depends on sample information . . . – whose value provides an approximation to this unknown parameter • A specific value of that random variable is called an estimate 9/13/2016 Ashok Pandey 101
  • 102. We can estimate a Population Parameter … Point Estimates with a Sample Statistic (a Point Estimate) Mean Proportion p x μ p̂ Variance Variance σ2 s2
  • 103. Point and Interval Estimates • A point estimate is a single number, • a confidence interval provides additional information about variability Point Estimate Lower Confidence Limit Upper Confidence Limit Width of confidence interval
  • 104. Confidence Intervals • How much uncertainty is associated with a point estimate of a population parameter? • An interval estimate provides more information about a population characteristic than does a point estimate • Such interval estimates are called confidence intervals
  • 105. Confidence Interval Estimate • An interval gives a range of values: – Takes into consideration variation in sample statistics from sample to sample – Based on observation from 1 sample – Gives information about closeness to unknown population parameters – Stated in terms of level of confidence • Can never be 100% confident
  • 106. Confidence Interval and Confidence Level • If P(a <  < b) = 1 -  then the interval from a to b is called a 100(1 - )% confidence interval of . • The quantity (1 - ) is called the confidence level of the interval ( between 0 and 1) – In repeated samples of the population, the true value of the parameter  would be contained in 100(1 - )% of intervals calculated this way. – The confidence interval calculated in this manner is written as a <  < b with 100(1 - )% confidence
  • 107. Estimation Process (mean, μ, is unknown) Population Random Sample Mean X = 50 Sample I am 95% confident that μ is between 40 & 60.
  • 108. Confidence Level, (1-) • Suppose confidence level = 95% • Also written (1 - ) = 0.95 • A relative frequency interpretation: – From repeated samples, 95% of all the confidence intervals that can be constructed will contain the unknown true parameter • A specific interval either will contain or will not contain the true parameter – The procedure used leads to a correct interval in 95% of the time... – ...but this does not guarantee anything about a particular sample. (continued)
  • 109. General Formula • The general formula for all confidence intervals is: • The value of the reliability factor depends on the desired level of confidence Point Estimate  (Reliability Factor)(Standard deviation)
  • 111. Confidence Interval for μ (σ2 Known) • Assumptions – Population variance σ2 is known – Population is normally distributed... – ....or large sample so that CLT can be used. • Confidence interval estimate: (where z/2 is the normal distribution value for a probability of /2 in each tail) n σ z x μ n σ z x α/2 α/2    
  • 112. Margin of Error • The confidence interval, • Can also be written as where ME is called the margin of error • The interval width, w, is equal to twice the margin of error n σ z x μ n σ z x α/2 α/2     ME x  n σ z ME α/2 
  • 113. Finding the Reliability Factor, z/2 • Consider a 95% confidence interval: z = -1.96 z = 1.96 .95 1    .025 2 α  .025 2 α  Point Estimate Lower Confidence Limit Upper Confidence Limit Z units: X units: 0  Find z.025 = 1.96 from the standard normal distribution table
  • 114. Common Levels of Confidence • Commonly used confidence levels are 90%, 95%, and 99% Confidence Level Confidence Coefficient, Z/2 value 1.28 1.645 1.96 2.33 2.58 3.08 3.27 .80 .90 .95 .98 .99 .998 .999 80% 90% 95% 98% 99% 99.8% 99.9%   1
  • 116. • If the population standard deviation σ is unknown, we can substitute the sample standard deviation, s • This introduces extra uncertainty, since s is variable from sample to sample • Therefore we use the t distribution instead of the normal distribution Confidence Interval for μ (σ2 Unknown)
  • 117. Student’s t Distribution • Consider a random sample of n observations – with mean x and standard deviation s – from a normally distributed population with mean μ • Then the variable follows the Student’s t distribution with (n - 1) degrees of freedom n s/ μ x t  
  • 118. Student’s t Distribution • The t is a family of distributions • The t-value depends on degrees of freedom (d.f.) – Number of observations that are free to vary after sample mean has been calculated d.f. = n - 1
  • 119. Student’s t Distribution t 0 t (df = 5) t (df = 13) t-distributions are bell- shaped and symmetric, but have ‘fatter’ tails than the normal Standard Normal (t with df = ∞) Note: t Z as n increases
  • 120. • Assumptions – Population standard deviation is unknown – Population is normally distributed • Use Student’s t Distribution • Confidence Interval Estimate: where tn-1,α/2 is the critical value of the t distribution with n-1 d.f. and an area of α/2 in each tail: Confidence Interval for μ (σ Unknown) n s t x μ n s t x α/2 1, - n α/2 1, - n     (continued) α/2 ) t P(t α/2 1, n   
  • 121. Student’s t Table Upper Tail Area df .10 .025 .05 1 12.706 2 3 3.182 t 0 2.920 The body of the table contains t values, not probabilities Let: n = 3 df = n - 1 = 2  = .10 /2 =.05 /2 = .05 3.078 1.886 1.638 6.314 2.920 2.353 4.303
  • 122. Distribution of sample mean, sample proportion and difference between two sample means and two sample proportions 9/13/2016 Ashok Pandey 122
  • 124. The sample proportion is the percentage of successes in n binomial trials. It is the number of successes, X, divided by the number of trials, n.  p X n  As the sample size, n, increases, the sampling distribution of approaches a normal distribution with mean p and standard deviation  p p p n ( ) 1 Sample proportion: 15 14 13 12 11 10 9 8 7 6 5 4 3 2 1 0 0.2 0.1 0.0 P(X) n=15, p = 0.3 X 14 15 13 15 12 15 11 15 10 15 9 15 8 15 7 15 6 15 5 15 4 15 3 15 2 15 1 15 0 15 15 15 ^ p 2 1 0 0 .5 0 .4 0 .3 0 .2 0 .1 0 .0 X P(X) n=2, p = 0 .3 10 9 8 7 6 5 4 3 2 1 0 0.3 0.2 0.1 0.0 P(X) n=10,p=0.3 X The Sampling Distribution of the Sample Proportion,  p
  • 125. The Sampling Distribution of a Difference Between Two Means
  • 126. Significance Tests for µ1 – µ2 Two-Sample t Test for the Difference Between Two Means