1. Anneliese Johnson
Lyme Disease Lab Report
Dr. Emms
December 16, 2015
Options for Controlling Lyme Disease in Humans in Doctor’s Park (Milwaukee County, WI)
Introduction
Lyme disease is a pathogenic disease caused by the bacterium Borrelia burgdorferi and
is commonly transmitted to humans via bites from lxodes scapularis, also known as a deer tick.
According to the Centers for Disease Control and Prevention, Lyme disease has many of the
same clinical symptoms as the flu during the first month of infection. Past that point, if left
untreated, symptoms start to become more serious, causing neurological and cardiac problems
that can be irreparable. Most cases, however, are diagnosed well before that point and are
treated with broad spectrum antibiotics such as doxycycline, amoxicillin, or cefuroxime axetil.
More severe cases often require intravenous antibiotics like penicillin or ceftriaxone (2015).
The reason that some incidences of Lyme disease reach the more severe stages of
infection is because the life cycle of this particular species of tick allows for feeding on humans
at a time when the tick is so small it is difficult to notice. The life cycle of a deer tick as
described by Ostfeld begins during late spring to early summer when it hatches from eggs laid
by the female during the previous winter. This hatched tick is then referred to as larvae which
then seek hosts. Because larvae are mostly immobile, they stay close to the forest floor and
infect primarily small mammals and birds. After taking a two to three day blood meal, the
blood-gorged tick drops off the host and molts, transitioning into the phase of the life cycle
known as a nymph. These nymphs then over-winter on or beneath the forest floor only to
emerge again the following spring to find a host for a three to five day blood meal. Following
this meal, the tick once again drops off and molts into the adult phase of its life. Adult ticks then
seek a final blood meal, often from Odocoileus virginianus, or white-tailed deer. This is actually
from where the name of the deer tick is derived. Following this last feeding, adult ticks
overwinter again and lay hundreds to thousands of eggs which hatch the following spring into
larvae, initiating the life cycle again (1997).
2. More often than not, ticks that infect humans do so while they are at the nymph stage
of the life cycle, because even though “infection, rarely, if ever, occurs during the first 24 hours
of nymphal feeding but becomes increasing likely after the tick has been attached for 48 hours
or longer”, nymphs are often too small for humans to detect on the skin (Radolf et al. 2012).
Because of their size, they can stay attached to a human host long enough for infection to occur
before dropping of and leaving no trace until 3 to 32 days later when the erythema migrans
rash that characterizes the disease appears on the skin.
In addition to the life cycle of the tick allowing it to feed on humans, there are also
environmental factors that increase the number of ticks in an area, which consequently
increases the prevalence of Lyme disease. For example, large percentages of land with a forest
habitat, make the perfect breeding grounds for deer ticks. According to the Minnesota
Department of Public Health, deer ticks prefer to populate areas with low-lying vegetation
because it provides the perfect shelter and place from which to search for prey (2015). The
humidity of forest habitat also plays a role in tick breeding habits. These environmental factors
all coincide to create an ideal habitat for deer ticks and therefore, the ideal habitat for Lyme
disease. This is an issue in the all of the Midwest but particularly, in the area of Wisconsin
known as Milwaukee County. In an article about the spread of deer ticks to this county, Perdue
(2010) says “A team of University of Wisconsin-Madison scientists recently surveyed Doctors
Park in Bayside for the presence of ticks and found evidence suggesting that ticks were not just
present in the county, but were living and reproducing there, too”. As a consequence of this
increase in the population size of the deer ticks in Wisconsin, Lyme disease rates have
skyrocketed, nearly 35 percent in 2010 according to Hogan (2011).
This particular study is being done to examine first of all, what ecological factors are
playing a role in this spread of Lyme disease and second of all, to develop a course of action
meant to decrease the prevalence of the disease in Doctor’s Park, the site of the first tick
findings in Milwaukee County. This requires examining all the species the area, the rate at
which they carry ticks, and the percentage of those ticks that are infected with the Borrelia
burgdorferi bacterium. Then this information will be compiled into treatment plans that may or
3. may not be entirely feasible. The ultimate goal of the experiment is to find the most beneficial
environmental change and a feasible way of implementing such a change.
Methods
In order to find such a feasible plan to reduce the prevalence of Lyme disease in
Doctor’s Park, the number of ticks and percentage of infected ticks must be determined.
Because it is impossible to physically account for every tick in the park, a simulation model is
used to estimate the total number and infection percentage of the deer ticks using the
population sizes of the mammals native to the area on which ticks often feed. These species
include: white-footed mouse, eastern chipmunk, white-tailed deer, raccoon, Virginia opossum,
striped skunk, short-tailed shrew, other shrews, red and gray squirrels, red fox, and coyote. The
simulation allows for the adjustment of the population size of any one specie or group of
species, the caveat being that the population size cannot increase or decrease by more than 80
percent. The reason that some of the mammals are grouped together is because realistically,
because they share much of the same niche, white-footed mice, squirrels, and chipmunks
cannot increase or decrease independent of one another. The two types of shrews involved in
the simulation are also grouped together. Based on the population sizes, the burden (average
number of ticks found on each species), and the competency (chance a tick with contract Lyme
disease from a particular host), the simulation calculates the NIP (nymphal infection
prevalence), total number of ticks per hectare, total infected ticks per hectare, and total hosts
per hectare. The total number of infected ticks per hectare is the best number for determining
the dangers of Lyme disease in the Doctor’s Park area.
Using the mathematical simulation described above, it was examined first of all what
would happen if the environment was left exactly the same, and secondly what would happen
if each species or group was reduced by 50 percent (with the exception of red foxes and
coyotes because their population size was already zero). The simulation run with no changes
made to the population sizes serves as a control group to which the rest of the results can be
compared. The second set of simulations addressing each species or group individually. By
changing the population sizes individually, the relative impact of a particular species on the
4. overall tick population is made clearer. In this set of simulations, the ones that reduced
nuisance species (raccoon and striped-skunk) were particularly examined because if reducing
these species had a significant impact on the tick infection rate, a treatment plan that did so
would would be doubly beneficial. It would reduce the number of animals that humans
consider to be a nuisance and would also address the growing problem of Lyme disease. An
additional set of more complex simulations where more than one species was manipulated at a
time were also run. These included reducing smalls rodents by 20 percent and increasing red
foxes to half their maximum population size, reducing small rodents by 50 percent and
increasing red foxes to half their population size, reducing small rodents and white-tailed deer
by 50 percent and increasing red foxes to half their population size, and reducing small rodents
by 50 percent and increasing both red foxes and coyotes to half their maximum population size.
The reason these more complex simulations were done is to examine the effects of population
size changes on species that are believed to be particularly influential on deer tick populations.
It has been long thought that white-tailed deer, the namesake of the deer tick were influential
of the tick populations. More recently, the fluctuations in Lyme disease risk have been
attributed more to small-
mammal hosts such as
white-footed mice that are
known to transmit the
bacterium to the ticks (Levi
et al. 2012). This set of
simulations which
manipulate more than one
species at one allow me to
examine how the
combinations affect the
risk of Lyme disease. For a
complete synopsis of the
management options see Table 1.
Option # Details
1 Change nothing
2
Reduce white-footed mouse, eastern chipmunk, and red and grey squirrels
by 50 percent
3 Reduce white-tailed deer by 50 percent
4 Reduce raccoons by 50 percent
5 Reduce Virginia opossums by 50 percent
6 Reduce striped skunk by 50 percent
7 Reduce all shrews by 50 percent
8 Increasered fox to 50 percent of maximum population
9 Increasecoyote to 50 percent of maximum population
10
Reduce white-footed mouse, eastern chipmunk, and red and grey squirrels
by 20 percent and increasered fox to 50 percent of maximum population
11
Reduce white-footed mouse, eastern chipmunk, and red and grey squirrels
by 50 percent and increasered fox to 50 percent of maximum population
12
Reduce white-footed mouse, eastern chipmunk, red and grey squirrels,
and white tailed deer by 50 percent and increasered fox to 50 percent of
maximum population
13 Reduce nuisancespecies (raccoon and skunk) by 50 percent
Table 1- Synopsis of Simulations to be run
5. Results
Before changing any population sizes, a simulation with no changes was run to provide a
baseline against which to compare simulation results where populations have been
manipulated. The results for this control run can be seen in Table 2 along with simulation
results for each of the tests where population size of one species was manipulated at a time. It
can be seen in this table that making no environmental changes would result in approximately
14,000 infected ticks per hectare. Removing half the rodents from the environment results in
about 9,500 ticks per hectare, which is a 32 percent decrease compared to doing nothing.
Reducing the deer population by 50 percent has much less of an impact on the tick population,
actually increasing the number of infected ticks per hectare to about 14,500, a four percent
increase from the control group. If raccoons, which are considered a nuisance species, are
reduced by 50 percent the number of infected ticks per hectare changes very little, increasing
only two percent from the control simulation. Reducing the percentage of opossums by 50
percent also causes an increase the number of infected ticks per hectare, increasing from
14,000 to about 16,500, an 18 percent increase. Skunks being reduced by 50 percent has a
virtually non-existent impact on the number of infected ticks, with fluctuations for the
Host Species Control Rodents Deer Raccoons Opossoms Skunks Shrews
Red
Fox Coyotes
White-footed mouse 1000 500 1000 1000 1000 1000 1000 1000 1000
eastern chipmunk 500 250 500 500 500 500 500 500 500
w hite-tailed deer 2.5 2.5 1.25 2.5 2.5 2.5 2.5 2.5 2.5
raccoon 2.5 2.5 2.5 1.25 2.5 2.5 2.5 2.5 2.5
Virginia opossum 10 10 10 10 5 10 10 10 10
striped skunk 0.5 0.5 0.5 0.5 0.5 0.25 0.5 0.5 0.5
short-tailed shrew 250 250 250 250 250 250 125 250 250
other shrew s 250 250 250 250 250 250 125 250 250
red and grey squirrel 80 40 80 80 80 80 80 80 80
red fox 0 0 0 0 0 0 0 2.5 0
coyote 0 0 0 0 0 0 0 0 1.25
NIP 49 44 50 49 51 49 49 61 42
total ticks 28340 21675 29236 28816 32446 28390 27463 11490 79249
total hosts 2096 1306 2094 2094 2091 2095 1846 2098 2097
total infected
ticks/hectare 13953 9561 14529 14233 16431 13985 13586 7041 33239
Table 2- Simulations in which one hostspecies (or group) was reduced by 50% (or increased to 50% of max valuefor foxes and
coyotes)
6. simulation being less than one percent change from the control. Similarly, removal of 50
percent of the shrews reduces the number of total infected ticks by only three percent.
However, the addition of 2.5 red foxes per hectare causes a sharp drop in the number of
infected ticks to about 7,000, a decrease of about 50 percent from the control simulation.
Conversely, the addition of 1.25 coyotes per hectare to the environment causes the number of
infected ticks per hectare
to skyrocket, reaching
33,000, an increase of 138
percent from the control
simulation.
The numbers of
infected ticks per hectare
shown in Table 1 allowed
me to select key species
that have a significant
impact on the infection
percentage and run
simulations involving the
manipulations of different
combinations. These key species included smalls rodents, red foxes, and coyotes. Simulations
including changes in the deer population size were also run because as mentioned previously, it
is commonly believed that the deer tick and deer population sizes are correlative. The last
simulation involved the reduction of both nuisance species (raccoon and skunk) by 50 percent
because of the desire of Milwaukee County inhabitants to rid the area of these species. The
results of this set of multi-specie simulations can be seen in Table 3.
The simulation results from Table 1 indicate that both a reduction in small rodents and a
presence of red foxes have the effect of reducing the total number of infected ticks per hectare.
With the exception of the nuisance species simulation, all simulations in table three are
manipulations of different combinations of those three species. Reducing rodents by 20 percent
species list
Rodents
(20%) and
Red Fox
Rodents
(50%), Red
Fox
Rodents
(50%),
Deer, and
Red Fox
Raccoons
and
Skunks
(Nuisance
Species)
White-footed mouse 800 500 500 1000
eastern chipmunk 400 250 250 500
w hite-tailed deer 2.5 2.5 1.25 2.5
raccoon 2.5 2.5 2.5 1.25
Virginia opossum 10 10 10 10
striped skunk 0.5 0.5 0.5 0.25
short-tailed shrew 250 250 250 250
other shrew s 250 250 250 250
red and grey squirrel 64 40 40 80
red fox 2.5 2.5 2.5 0
coyote 0 0 0 0
NIP 49 3 3 49
total ticks 8202 3751 3452 28866
total hosts 1782 1308 1307 2094
total infected ticks 4054 113 98 14265
Table 3- Simulations in which multiplehostspecies (or groups) were reduced by
20% or 50% (or increased to 50% of max value for foxes and coyotes)
7. while introducing 50 percent of the maximum number of red foxes results in about 4000
infected ticks per hectare (30 percent of the control value). Reducing rodent populations by 50
percent while increasing red fox populations reduces the number of infected ticks per hectare
even more to only 113 (less than 1 percent of control value). Reducing the deer population by
50 percent in junction with small rodents and increasing fox population size also results in a
very small number of infected ticks, only 98 or 0.7 percent of the control value. Lastly, the
reduction of nuisance
species increases the
number of infected ticks
per hectare by two
percent which is similar to
when both nuisance
species were manipulated
separately.
The results for
number of infected ticks
per hectare for every
simulation can be seen in
Figure 1, which clearly
shows that the host
species that have the
largest impact on this
number are small rodents,
and red foxes. Simulations
2, 8, 10, 11, and 12 all
reduced the number of
small rodents and
increased the number of
red foxes and in each
0
5000
10000
15000
20000
25000
30000
35000
1 2 3 4 5 6 7 8 9 10 11 12 13
NumberofinfectedTicksperHectare
Simulation Number
Figure1 Total infected ticks/hectarefor Each
Simulation
0
5000
10000
15000
20000
0 200 400 600 800 1000 1200 1400
NumberofInfectedTicksperHectare
Number of Small Rodents (Based on White Footed Mouse)
Figure2 Number of Infected Ticks per Hectare vs.
Number of Small Rodents (Based on White-
footed Mice population size)
8. simulation, the number of
infected ticks per hectare
dropped significantly. To
see specific correlations
between the size of
populations of these key
species assumming all
other species remain at
original population size,
see Figures 2, and 3.
Figure 2 shows the
positive correlation
between the number of
small rodents and number of infected ticks per hectare and Figure 3 shows the negative
correlation between the number of red foxes and the number of infected ticks per hectare.
Based on this information, we can conclude that as the population size of small rodents
decreases and the population size of red foxes increases, the number of infected ticks per
hectare will decrease. This is why the simulations where both these things occurred had the
lowest number of infected ticks per hectare.
Discussion
When looking at the results of the simulations in the context of Doctor’s Park in
Wisconsin, there are several options. Though simulations were run for manipulation of every
species, several options (4,5,6,7, and 9 according to Table 1) either had so little bearing on tick
infection rate or caused the rate to skyrocket and therefore were discarded when examining
management options for Doctor’s Park. That being said, the first potential management plan
(option 1 in Table 1) is always to do nothing. If the ecosystem of the park is left exactly as it is,
the average number of ticks per hectare will remains around 14,000 and the prevalence of
Lyme diease will stay stay the same, about 17.2 incidence (number of confirmed cases per
0
2000
4000
6000
8000
10000
12000
0 1 2 3 4 5 6
NumberofInfectedTicksperHectare
Number of Red Foxes per Hectare
Figure3 Number of Infected Ticks per Hectare vs.
Number of Red Foxes
9. 100,000 population) according to the Center for Disease Control and Prevention stastistics
(2014). I am aware that this is not the ideal solution, but it is an excellent baseline against which
to compare the rest of the options that the simulations, in combination with knowledge of the
Borrelia burgodorferi bacterium, point towards. It is also an option should issues of cost or
public concern hinder any changes to the current ecosystem of the park.
The second management plan (option 2 in Table 1), is to address the large population of
small rodents in the park. By reducing the population size of these species by 50 percent, the
number of infected ticks per hectare will also be reduced by about 32 percent, theoretically
leading to a signficant decrease in Lyme disease incidence. This is logical when examined in
context with the life cycle of the tick. When a tick is in the larvae stage, it has little to no
mobility and therefore must feed on whatever is close to the ground, usually small rodents. If
the larvae ticks cannot find such a blood meal, they die, therefore reducing the number of total
ticks (and consequently infected ticks) in the environment. Additionaly, as Figure 2 shows, the
number of infected ticks per hectare continues to decrease as the population size of the small
rodents decreases. Therefore, reduction in population size of small rodents would likely have a
positive impact on the incidence of Lyme disease in humans.
A third management plan (option 3 in Table 1) is to reduce the number of deer in the
park by 50 percent. However, although the deer tick’s name implies it prefers deer, the ticks
that feast on deer are primarily in the adult stage of the life cycle. Additionally, though deer are
a favorable host for ticks, the ticks they carry have been infected with Lyme disease bacterium
long before taking a blood meal on the deer (Ostfeld 1997). Therefore, it follows that reducing
the number of deer in the park would do little to reduce the number of infected ticks per
hectare, a theory which is corroborated by simulation results in which the number in question
increased 4 percent from the control simulation where no changes were made. Consequently,
reducing the population of deer would do little to lower the risk of Lyme disease to humans.
In response to inquires from county inhabitants about the populations of nuisance
species, simulations looking at their effect on the number of infected ticks were also done
(option 13 in Table 1). These simualtions indicate that removal of the species from the
environment have effects of less than three percent increase or decrease of infected tick
10. numbers. Therefore, this fourth management plan, though appealing for other reasons, is not
practicle in regard to decreasing the risk of Lyme disease for humans.
A fifth option (option 8 in table 1) is the introduction of red fox to Doctor’s Park, a
species which is not currently part of the park’s ecosystem. According to the simulation results,
increasing the number of red fox per hectare to 2.5 would lower the number of infected ticks
by about 50 percent compared to option 1, which is to do nothing. This is logical because red
foxes have both an ability to kill and dietary preference for small mammals such as mice,
chipmunks, and squirrels, which are often carriers of the Lyme disease pathogen. They are also
highly adaptable to human-dominated landscapes, thus making them a good choice for an area
such as Doctor’s Park which frequently hosts humans (Levi et al. 2012).
One final option (option 12 in Table 1) is to combine both a reduction of small mammals
with the introduction of red foxes, which essentially combines the two most efficient options
described so far. A 50 percent reduction in small mammals combined with the increase of red
foxes to 2.5 per hectare would result, according to the simulation in only 113 infected ticks per
hectare, less than one percent of the control situation value. For the same reasons as desribed
in options one and five, this is an effective option for reducing the risk of Lyme disease to
humans.
Even though all six options are theoretically possible, some can be prioritized ahead of
others due to first of all, the extent to which they reduce the risk of Lyme disease and secondly,
the practicality of implementation. There is one advantage of option one in comparison to the
rest. Because nothing is done, it will not cost anything right now. That being said, this course of
action could incur future costs in terms of medical care and public concern over high incidence
of Lyme disease in the human population. Option three, remvoing deer from the habitat does
not have decrease the number of infected ticks at all and therefore is not recommended.
Similarly, option four, though ridding the area of the so-called nuisance species has no effect on
the tick population and is therefore not a good option.
The management plans that are the best options for Doctor’s Park are plans two, five
and six. Plan two involves the removal of 50 percent of the small rodents from the park, a
process which would drive the number of infected ticks per hectare down to 32 percent of
11. current values. A common way of actually removing these rodents involves the use of
rodenticides, however, because the anticoagulants commonly used could potentially be
consumed by other species, this is not the course of action I would recommend. More recently,
studies looking at immunocontraceptives as a way of controling the size of mouse populations
have been done. One of the reasons that this method of biological control is starting to gain
traction is because it prevents the reproduction of organisms without killing them. However,
when reproduction is slowed or stopped, the death rate of the population is higher than the
birth rate, effectively causing the population to shrink, which is the goal in Doctor’s Park.
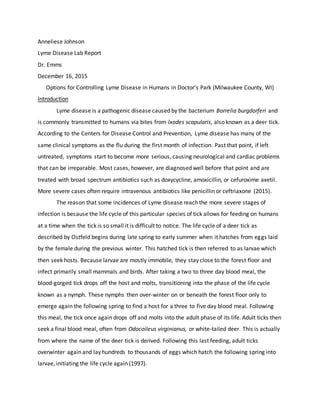
According to a study by Chambers et al., currently, there are three possible ways to distribute
these immunocontraceptives. The first option involves the use of non-disseminating (non-
spreading) genetically modified organisms in baits.The second option, which is delivery by
synthetic means such as injection is really only feasible in humans and pet vaccines, not wildlife.
The third option is using disseminating (spreading) GMOs like viruses or bacteria (2014). Based
on this information, the first option is often the one chosen for control of rodents due to social
and economic reasons, however, the
third option is likely more effective.
The study done by Chambers et al.
suggests the use of the mouse
cytomegalovirus as a vector for the
immunocontraceptive. Figure 4
describes the advantages of both the
first and third option and as can be
seen, a viral-delivered
immunocontraceptive has many more advantages. In particular, it is more cost effective
because no human interference is needed once the infectious agent is in the population and is
also species specific which means is would have little to no risk to species other than the mice
and other small rodents.
Contrastingly, option five requires the removal of nothing from the environment by
humans. Instead, red foxes would be introduced to the park. These fox are highly effective in
Figure 4- Advantages of two methods of immunocontraceptive delivery
12. lowering populations of small rodents as well, causing nearly a 50 percent decrease in the
number of infected ticks per hectare. That drop translates to a significant drop in the risk of
Lyme disease in humans as well. In regard to the practicality of introducing these species to the
area, it is certianly possible. According to the National Wildlife Federation, red fox are highly
adaptable both in terms of habitat and food sources and can survive also most anywhere (n.d.).
Additionally, the Department of Natural Resources in Wisconsin already lists the red fox as a
species native to the state, therefore decreasing risk of introducing the fox in Doctor’s Park. As
shown by Figure 3, any addition of red fox to the area decreases the number of infected ticks
per hectare. Because of this, if inhabitants of the area and visitors to the park do not the idea of
having so many fox around, it would be possible to reduce the number of fox while still having
the desired effect on tick population.
Finally, the last option to is to both remove 50 percent of the small rodent population
and add 2.5 red fox per hectare to the park. This would result in reducing the number of
infected ticks per hectare to less than one percent of the current value, effectively almost
completely eliminating the risk of Lyme disease for humans. This could be done by combining
the use of a viral-vector immunocontraceptive for small rodents and an introduction of red fox
to the park. Though this option may be more expensive, it does result in a significantly larger
decrease in infected ticks, and consequently the risk of Lyme disease compared to the other
plans.
My recommendation is this last option. Though the use of a viral-vector
immunocontraceptive may seen controversial, most of the concerns surrounding the technique
can be abated because of the species specific vector and the fact that the vaccine itself is not
causing any deaths of mice, it is only preventing the contraception and birth of new mice,
allowing the death rate to rise above the birth rate, which causes a decrease in population size.
Addtionally, though people may not be fond of the idea of fox in the park, the benefit of the
species introduction is too great to ignore. Because of the adaptability of the red fox,
introduction to the area would be relatively unproblematic and would work in tandem with the
reduction in small rodents to significantly reduce the risk of Lyme disease in humans, which was
the long-term goal of this study.
13. Works Cited
Blacklegged Ticks (Deer Tick, Bear Tick). (n.d.).
http://www.health.state.mn.us/divs/idepc/dtopics/tickborne/ticks.html. Accessed
December 13, 2015.
Chambers L.K., Lawson M.A., Hinds L.A. n.d. Biological Control of Rodents- the Case for Fertility
Control Using Immunocontraception. 215-234.
Hogan, K. (2011, July 9). Lyme disease on the rise in Wisconsin. Journal Sentinel.
Levi T., Kilpatrick A.M., Mangel M., Wilmers C.C. 2012. Deer, predators, and the emergence of
Lyme disease. Proceedings of the National Academy of Sciences of the United States of
America. 109: 10942-10947.
Red Fox. (n.d.). https://www.nwf.org/Wildlife/Wildlife-Library/Mammals/Red-Fox.aspx.
Accessed December 13, 2015.
Lyme Disease. (2015, November 18). http://www.cdc.gov/lyme/. Accessed December 13, 2015.
Ostfeld R.S. 1997. The Ecology of Lyme-Disease Risk: Complex interactions between seemingly
unconnected phenomena determine risk of exposure to this expanding disease.
American Scientist. 85: 338-346
Perdue, S. (2012, June 14). Deer ticks advance on Milwaukee County. Journal Sentinel.
Radolf J.D., Caimano M.J., Stevenson B., Hu L.T. 2012. Of ticks, mice and men: understanding
the dual-host lifestyle of Lyme disease spriochaetes. Nature Reviews. 10: 87-99.
Wisconsin furbearers. (n.d.). http://dnr.wi.gov/topic/wildlifehabitat/furbearers.html. Accessed
December 13, 2015.