Genetic Dna And Bioinformatics ( Accession No. Xp Essay
POSTER LOOK
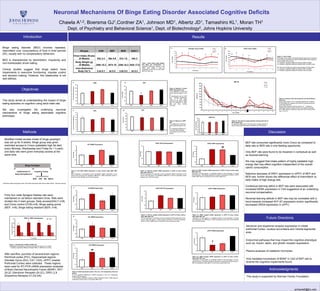
1. Neuronal Mechanisms Of Binge Eating Disorder Associated Cognitive Deficits
Introduction Results
Methods
3C 4C 4D
Groups CON BEP BER DAILY
Chow Intake (Kcals)
(9 Weeks) 63± 2.4 58± 0.6 61± 1.8 54± 2
Body Weight (g)
(9 Weeks) 349± 18.3 347± 18 339± 16.3 343± 17.6
Intra-Abdominal
Body Fat % 3.4± 0.1 4± 0.2 3.8± 0.2 4± 0.3
Binge eating disorder (BED) involves repeated,
intermittent over consumptions of food in brief periods
(2h), usually with no compensatory behaviors.
BED is characterized by disinhibition, impulsivity and
non-homeostatic driven eating.
Clinical studies suggest that binge eaters have
impairments in executive functioning, impulse control
and decision making. However, this relationship is not
well defined.
This study aimed at understanding the impact of binge
eating episodes on cognition using adult male rats.
We also investigated the underlying neuronal
mechanisms of binge eating associated cognitive
phenotype.
Modified limited access model of binge paradigm
was set up for 8 weeks. Binge group was given
restricted access to Crisco (palatable high fat diet)
every Monday, Wednesday and Friday for 1 h each,
and daily rats were given everyday access at the
same time.
Forty four male Sprague-Dawley rats were
maintained on ad libitum standard chow. Rats were
divided into 4 main groups: Daily access(DAILY,n=8)
and Chow control (CON,n=8), Binge eating prone
(BEP, n=8), Binge eating resistant (BER, n=8).
After sacrifice, punches of several brain regions:
Perirhinal cortex (PrC), Hippocampal regions
(Dentate Gyrus (DG), CA1, CA3), mPFC (medial
Prefrontal Cortex) were collected. These regions
were used for RT-PCR mRNA expression analyses
of Brain Derived Neurotrophic Factor (BDNF), 5HT-
2A,2C (Serotonin Receptor-2A,2C), DRD1,2,4
(Dopamine Receptor D1,D2,D4).
BEP rats consumed significantly more Crisco as compared to
daily rats or BER rats in one feeding opportunity.
Only BEP rats were found to be impaired in contextual as well
as reversal learning.
We may suggest that intake pattern of highly palatable high
energy diet may effect cognition independent of the overall
caloric consumption.
Selective decrease of DRD1 expression in mPFC of BEP and
BER rats, further shows the differential effect of intermittent vs.
daily intake of high energy diet.
Contextual learning deficit in BEP rats were associated with
increased BDNF expression in CA3 suggestive of an underlying
neuronal compensation.
Reversal learning deficits in BEP rats may be correlated with a
trend towards increased 5HT-2C expression and/or significantly
decreased DRD4 expression in mPFC.
0
20
40
60
80
100
120
CON BEP BER DAILY
TotalTimeSpentExploring(s)
NORA
0
10
20
30
40
50
CON BEP BER DAILY
%NovelObject
NOR
*
B
0
10
20
30
40
50
60
70
80
CON BEP BER DAILY
TotalTimeSpentExploring(s)
NPRA
0
10
20
30
40
50
60
CON BEP BER DAILY
%NovelPlace
NPRB
20
30
40
50
60
70
80
90
100
CON BEP BER DAILY
TotalTimeSpent(s)
BM-Probe
0
0.5
1
1.5
2
CON BEP BER DAILY
FoldChange
PrC BDNF Expression
0
0.5
1
1.5
2
CON BEP BER DAILY
FoldChange
DG BDNF ExpressionA
0
0.5
1
1.5
2
2.5
CON BEP BER DAILY
FoldChange
CA1 BDNF ExpressionB
0
0.5
1
1.5
2
2.5
3
3.5
CON BEP BER DAILY
FoldChange
CA3 BDNF ExpressionC
##
0
0.5
1
1.5
CON BEP BER DAILY
FoldChange
mPFC 5HT-2A Expression
0
0.5
1
1.5
2
2.5
CON BEP BER DAILY
FoldChange
mPFC 5HT-2C Expression
0
0.5
1
1.5
2
2.5
3
3.5
CON BEP BER DAILY
FoldChange
mPFC DRD1 Expression
##
##
0
0.5
1
1.5
CON BEP BER DAILY
FoldChange
mPFC DRD2 Expression
0
0.5
1
1.5
CON BEP BER DAILY
FoldChange
mPFC DRD4 Expression
#
0
20
40
60
80
100
120
140
160
180
200
1 2 3 4 5 6 7 8 9 10 *1 *2 *3 *4 *5 *6
BEP
BER
DAILY
CON
Latency(s)
No. of Trials
BM-*RL
**
Future Studies
Acknowledgement
Figure 1: Classification of BEP and BER rats
Classification was based on calories consumed from Crisco over 4 weeks.
* indicates a significant difference between BEP vs. BER rats (*p<0.001).
Figure 4: Behavior in Novel
Object Recognition test.
A- No difference in total time
spent exploring object A and
B.
B- Recollection trial for NOR
test. * indicates Significantly
lower % of time spent
exploring novel object in BEP
rats as compared to BER,
daily and chow controls
(*p<0.05).
Figure 3: Crisco Intake
A:Average Crisco Intake (one feeding opportunity) during 8 weeks of
Crisco access. Significant increase in between BEP rats compared to
daily and BER rats (p<0.001).
”A” indicates a significant difference between BEP and BER,
“B” indicates a significant difference between BEP and BER, Daily.
B: Total Crisco Intake per week during 8 weeks of Crisco intake.
“C” indicates a significant difference between BEP and BER,
“D” indicates a significant difference between Daily and BER
Figure 5: Behavior in NPR
test
A-no differences in total time
spent exploring object A and
B.
B- no significant difference in
% of time spent exploring
novel place in any of the four
groups.
Figure 6: Latency to find the escape box during the Barnes
maze test
Barnes Maze (trials:1-10), no significant differences in latency
to find escape box, between any of the four groups across any
of the trials observed.
Barnes Maze Reversal Learning (trials:1-6), ** indicates a
significant increase in latency to find ‘new’ position of escape
box in BEP rats as compared to daily and chow controls in trial
one (**p<0.01).
Figure 8: Time spent in target quadrant during probe trial of
Barnes Maze test.
No significant differences in the time spent in target quadrant in
barnes maze probe trial observed between any of the groups.
Figure 9: PrC Bdnf mRNA expression in chow control, daily, BER, BEP
rats.
Bdnf expression is expressed as the normalized relative expression to the
control chow fed group.No significant difference in Bdnf expression levels in
perirhinal cortex between any of the four groups.
Figure 10: Bdnf expression levels in DG, CA1, CA3 respectively of the four
groups.
A, B- No significant differences in BDNF expression in DG, CA1 respectively,
between the four groups.
C- ## indicates significant increase in Bdnf expression levels in BEP group as
compared to chow control in CA3 region (##p<0.05).
Figure 11: 5HT-2C receptor mRNA expression in mPFC of chow control,
daily, BER, BEP rats.
5HT-2C expression is expressed as the normalized relative expression to the
control chow fed group. A trend towards increase in 5HT-2C expression
levels in mPFC of BEP rats as compared to chow controls (p=0.08).
Figure 13: DRD2 receptor mRNA expression in mPFC of chow control,
daily, BER, BEP rats.
Expression of these genes is normalized relative to the expression in control
chow fed group. No difference in DRD2 expression levels were found between
any of the four groups.
Future Directions
Acknowledgments
Discussion
0
5
10
15
20
25
30
35
40
1 2 3 4 5 6 7 8
Crisco(Kcals)
Average Crisco Intake BEP
BER
DAILY
Time (Weeks)
B
A
B
B
B B B
A
0
20
40
60
80
100
120
140
160
1 2 3 4 5 6 7 8
Crisco(Kcals)
Time (Weeks)
Total Crisco Intake BEP
BER
DAILY
C
C
D
D
D
D D
B
C C
Table 1: Chow Intake, Body Weight,
and Body Fat Composition. No
significant differences between chow
intake, body weight or body fat
composition of the chow control, BEP,
BER and Daily rats.
Figure 11: 5HT-2A receptor mRNA expression in mPFC of chow control,
daily, BER, BEP rats.
5HT-2A expression is expressed as the normalized relative expression to the
control chow fed group. No significant difference in 5HT-2A expression levels
between any of the four groups.
Figure 12: DRD1 receptor mRNA expression in mPFC of chow control, daily,
BER, BEP rats.
Expression of these genes is normalized relative to the expression in control
chow fed group. ## indicates significant increase in expression of DRD1 in mPFC
of BEP, BER rats as compared to chow controls (##p<0.01).
Figure 14: DRD4 receptor mRNA expression in mPFC of chow control,
daily, BER, BEP rats.
Expression of these genes is normalized relative to the expression in control
chow fed group. # indicates significant decrease in expression of DRD4 levels in
BEP as compared to daily (#p<0.01) and chow controls (#p<0.05)
Objectives
achawla5@jhu.edu
Binge Paradigm
W1 W5 W8
Cognitive Testing
NOR-Novel Object Recognition NPR- Novel Place Recognition BM- Barnes Maze, BM-RL –Reversal Learning
NOR NPR BM BM-RL
Establishment of
Binge Eating Behavior
0
10
20
30
40
1 2 3 4
BEP BER
BEP vs. BER Classification
AverageCriscoIntake(Kcals)
Time (Weeks)
*
* *
*
Chawla A1,2, Boersma GJ1,Cordner ZA1, Johnson MD1, Albertz JD1, Tamashiro KL1, Moran TH1
Serotonin and dopamine receptor expression in orbital
prefrontal Cortex, nucleus accumbens and Ventral tegmental
area.
Endocrinal pathways that may impact the cognitive phenotype
such as: Insulin, leptin, and ghrelin receptor expression.
Plasma analyses of metabolic hormones.
Viral mediated knockdown of BDNF in CA3 of BEP rats to
reverse the cognitive impairments found.
This study is supported by Klarman Family Foundation.
Dept. of Psychiatry and Behavioral Science1, Dept. of Biotechnology2, Johns Hopkins University