
Recommended
Recommended
More Related Content
What's hot
What's hot (20)
Similar to Harvard case study analysis anirudh garg
Similar to Harvard case study analysis anirudh garg (20)
Recently uploaded
Recently uploaded (20)
Harvard case study analysis anirudh garg
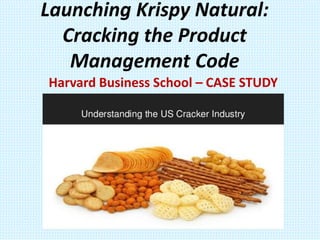
- 1. Launching Krispy Natural: Cracking the Product Management Code Harvard Business School – CASE STUDY
- 2. INDEX 1) Pemberton introduction and their products 2) About US cracker industry and players in it 3) Krispy inc. brand 4) Relaunch of Krispy natural and strategies used. 5) Results and findings
- 3. Candler Enterprises products: Beverage Division Pemberton Products Pet Care Division Quick Service Restaurant
- 4. Pemberton: PRODUCTS • Pemberton was the snack food division of Candler Enterprises, a multinational beverage and snack goods manufacturer. The majority of Pemberton’s sales were from packaged food bars, cookies, and other sweet baked goods; their market-leading brands were Softies cookies and Home-style muffins and doughnuts. • Ashley Marne – Executive Vice President, Sales and Marketing. • Brandon Fredrick- Marketing director for Pemberton Pemberton’s Income as a percent of sales (2011) – Sales 100% COGS 78.8% Brand Advertising & Marketing 7.7% Pretax Contribuition 13.5% Profit After Tax 7.7%
- 5. Brand Positioning and operating strategies of Pemberton • Market Leader in U.S Cookie & Bakery Snacks Segment. • Operated Dozens of Plants and world renowned product development labs. • Constant Innovations in Recipes and new ranges. • Customer friendly and specific to their needs. • DSD (Direct Store Delivery) distribution system was installed for customer satisfaction.
- 6. What is DSD Distribution System? • Products directly delivered to retail outlets. • No wholesalers warehouses and distribution centres were involved which helped in maintaining transparency of sales. • Common for products with low shelf life like – Soft Drinks, Chips, Baked Goods It was estimated the DSD system cost Pemberton approximately 20 cents of every sales dollar.
- 7. TASKS PERFORMED BY DSD REPRESENTATIVES: • Delivered products directly to the retail outlets. • Conducted in-store merchandising • Did price promotions • Had a check on shelf inventory
- 8. • Control over the shelf space • More accurate forecasting • Reduced Stock-Outs • Quicker turnover of products CONCLUDING : DSD helped in Maximization of Sales and Profit for Pemberton and was beneficial for Pemberton as well as Retailer. ADVANTAGES OF INSTALLING DSD DELIVERY SYSTEM
- 9. VISION AND AIMS OF THE COMPANY: (1) building a collection of attractive, durable brands (2) leveraging leading marketing, sales and DSD systems to increase revenue and profits (3) building or acquiring capabilities in salty snack categories.
- 10. U.S CRACKER INDUSTRY: - Retail cracker sales in the United States reached an estimated $6.9 billion in 2011 - 74% consumers ate crackers on a regularly basis. - 34% consumers ate them as a part of weekly diet. All other Crackers Saltines Crackers with Filling Graham Crackers Breadsticks/matzoh
- 11. BIG PLAYERS OF THE CRACKER SECTOR: • Kraft Food Inc.(Nabisco Brands) • Kellogg Co. (Sunshine, Keebler, Carrs and Austin brands) • Pepperidge Farm(Goldfish brands)
- 12. STATING SOME FACTS: The broad “all other” crackers segment experienced a 2.1% CAGR for the period from 2008 to 2010. Retail sales of “all other” crackers in the United States were estimated at ~$5.1 billion in 2011, a 6.2% increase over 2010.
- 13. After flat sales from 2005 through 2009, the crackers-with-filling segment experienced the strongest segment growth of approximately 14% in 2010. Annual growth was forecasted between 10–14% for the segment over the next several years. Retail sales of crackers with filling in the United States were estimated at ~$660 million in 2011, an 11% increase over 2010.
- 14. The original Krispy Inc.(2008) • Had been into single serve cracker product ranges. • Competed with “all other” crackers and crackers- with-filling. • Had a limited range of crackers. Was known a “Grab & Go” Product – Strong presence in vending machines and convenience stores.
- 15. PRODUCT RANGE OF THE COMPANY: -The flagship product was a package containing six round toasted cracker sandwiches with cheese filling, available in 3 flavour options. -Krispy also offered a flat cracker sold in 1.5 ounce bags with 2 flavour options
- 16. INITIAL INVOLVEMENT OF PEMBERTON: • In 2008 Pemberton took the first steps to enter the salty snack market with the acquisition of Krispy Inc. • Pemberton hoped to increase volume through wider distribution in supermarkets and better placement using Pemberton displays.
- 17. WHEN EXPECTATIONS FAIL STATING THE FIGURES: Sales (2009) Performance Planned Sale Actual Sale % Sale to Plan Krispy Retail $97.5 $50.8 52.1% Krispy Vend $23.4 $18.0 76.9% Total Krispy Sales $120.9 $68.8 56.9%
- 18. REASONS OF FAILURES AS STATED BY THE COMPANY HEADS: • limited product line, which made it difficult to command any sort of presence in supermarkets. • Taste survey showed the product did not deliver the flavour satisfaction scores we expected. • Didn’t satisfy the customers looking for healthy snacks. BUT STILL BELIEVING IN THE COMPANY THE HEADS STATED “ I still believe in Krispy, and with a tweaking of the product and marketing strategy, it can provide an attractive growth opportunity”.
- 19. THE TURNING POINT FOR THE COMPANY LAUNCH OF: KRISPY NATURAL
- 20. PRODUCT DEVELOPMENT STRATEGY • Pemberton R&D Labs worked upon product taste and quality. • Krispy Natural would be made from 100% whole wheat and other all natural ingredients, with approximately 150 calories, 6 grams of fibre and 3 grams of protein per serving. • Launched new flavours and attractive packaging. • Multiple serves packaging also adopted. • Krispy Natural focused on increasing package sizes to multiple-servings and improving taste so that consumers would prefer Krispy Natural to competitor brands at least two-to-one.
- 21. NEW MARKET RANGE: Cracker with filling options would feature: White Cheddar Smoked Gouda Chipotle Cheddar Creamy Swiss Tomato Basil Vegetable Herb. Flat cracker flavours would include: Cracked Pepper & Olive Oil, Sundried Tomato, Smoked Cheddar Roasted Garlic.
- 22. MARKETING STRATEGY: • Heavy Advertising, Promotions and market tests. • Adoption of Pull Marketing Strategy • trade promotions
- 23. PRODUCT DISTRIBUTION STRATEGY: • Continued DSD Distribution effectively • Optimizing the product for a longer shelf life. • Specially hired people – “Krispy Force” for proper distribution and product promotions.
- 24. PRICE RANGE OF THE COMPANY: • Krispy Natural sought a premium pricing strategy. Management felt pricing of approximately 155% the category average cost per ounce was reasonable considering the product’s superiority. • for each package would be similar to competitors in the category, but there would be less quantity or weight in the Krispy Natural package
- 25. TEST PERIOD OVER, RESULT TIME Estimated Dollar Shares of Market Columbus Pre-test Market Columbus Post Southeast Pre-test Market Southeast Post Kraft 40% 33% 34% 32% Kellogg 25% 22% 23% 22% Pepperidge Farm 11% 10% 10% 10% Krispy 0% 18% 9% 10%
- 26. 2 SCHOOL OF THOUGHTS WERE THERE REGARDING THE SUCCESS OF THE CAMPAIGN: 1) The large chain headquarter buyers were particularly impressed with the consumer research results and inventory turn estimates for Krispy Natural. We created a comprehensive sales presentation with category expansion estimates and a competitor analysis of projected turns per year that really blew them away. They also loved all the promotional activity and consumer advertising. The pull marketing really created a buzz and customers were coming to the stores asking for Krispy Natural by name. 2) The positive test market results were driven by significant price discounts, couponing, and sampling, which were not sustainable on a national level. Also, there were those in the industry who felt the taste preference claims of Krispy Natural were inflated and the flavour was no better than current brand offerings
- 27. AFTER THE MIXED RESPONSES FROM THE ANALYSTS IT STILL REMAINED A DOUBT IF THE COMPANY IS READY TO BE LAUNCHED AT A NATIONAL SCALE OR NOT.
- 28. This case study analysis was done by ANIRUDH GARG ,BITS PILANI during a marketing internship under PROF. SAMEER MATHUR , IIM LUCKNOW