Kalyani Nagar & Escort Service in Pune Phone No 8005736733 Elite Escort Servi...
Food security in russia
1. Special Article
Food Security in Russia:
Economic Growth and Rising
Incomes are Reducing Insecurity
William Liefert
Abstract: Russia’s food security problem is not inadequate availability of food.
Although production and consumption of livestock products have dropped substan-tially
during the transition period following the dissolution of the Soviet Union, total
caloric availability per capita per day in 1999 was only 3 percent lower than at the
start of the reform process in 1992. The main food security problem is inadequate
access to food by certain socioeconomic groups, which lack sufficient purchasing
power to afford a minimally healthy diet. However, the country’s improved macro-economic
performance since 1999, with gross domestic product growing at an aver-age
annual rate of about 6 percent, has reduced poverty, and thereby the number of
food insecure households. A serious food-related health problem is in fact over-weight
and obesity, which have increased during transition and currently affect over
half the adult population.
Keywords: Russia, food security, access, purchasing power, policy reform, poverty,
consumers.
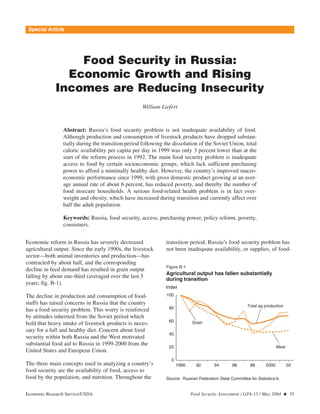
Economic reform in Russia has severely decreased
agricultural output. Since the early 1990s, the livestock
sector—both animal inventories and production—has
contracted by about half, and the corresponding
decline in feed demand has resulted in grain output
falling by about one-third (averaged over the last 5
years; fig. B-1).
The decline in production and consumption of food-stuffs
has raised concerns in Russia that the country
has a food security problem. This worry is reinforced
by attitudes inherited from the Soviet period which
hold that heavy intake of livestock products is neces-sary
for a full and healthy diet. Concern about food
security within both Russia and the West motivated
substantial food aid to Russia in 1999-2000 from the
United States and European Union.
The three main concepts used in analyzing a country’s
food security are the availability of food, access to
food by the population, and nutrition. Throughout the
transition period, Russia’s food security problem has
not been inadequate availability, or supplies, of food-
Figure B-1
Agricultural output has fallen substantially
during transition
Index
Grain
Total ag production
Meat
1990 92 94 96 98 2000 02
100
80
60
40
20
0
Source: Russian Federation State Committee for Statistics-b.
Economic Research Service/USDA Food Security Assessment / GFA-15 / May 2004 35
2. stuffs. Although consumption of high-value livestock
products has declined, consumption of staple foods
such as bread and potatoes has remained steady or
even increased. The drop in consumption of livestock
goods is lower than the decrease in domestic output,
given that during transition Russia has become a
major importer of meat (in particular poultry from the
United States).
Russia’s main food security problem is inadequate
access to food by certain socioeconomic groups.
Transition initially resulted in a large share of the popu-lation
moving into poverty, because of both unemploy-ment
and real income-eroding inflation, such that more
people had insufficient purchasing power to afford a
minimally healthy diet. The most food insecure groups
are those with the following traits: low income, large
households, and no access to a garden plot on which
they can grow food. However, Russia’s improving
macroeconomic performance over the past few years,
involving rising gross domestic product (GDP) and
personal income, has substantially reduced the size of
the population living below the poverty line, to about 15
percent by 2003. The decline in poverty has conse-quently
decreased the number of food insecure individu-als,
such that by 2003 the share of the population that is
food insecure might be as low as 6 percent.
Russians have a traditional dietary preference for live-stock
products, such as meat, dairy products, and eggs,
which are heavy in fat, protein, and cholesterol.
During the Soviet period, state authorities strengthened
such preferences by releasing recommended food
consumption “norms” heavily favoring livestock prod-ucts.
Despite the fall in intake of these products during
transition, overweight and obesity, which affect half
the adult population, have been a more serious health
problem than underweight or malnutrition. Lifestyle
behaviors, such as lack of physical exercise, have
probably played a key role in this development.
Availability
Throughout the transition period, Russia’s combined
domestic production and imports of foodstuffs have been
sufficient to maintain adequate food supplies. In 1999,
total caloric availability per capita per day was only 3
percent below that in 1992 (2,880 calories compared
with 2,940; Sedik et al.). This is well above the
FAO/WHO (Food and Agriculture Organization/
World Health Organization) guideline for minimum
dietary energy requirements for Russia of 1,970 calories.
Although agricultural output, especially of livestock
products, has fallen during transition, the decline has
been an inevitable part of market reform. Reform has
adjusted the production and consumption of high-value
foodstuffs to better reflect Russia’s real national prod-uct
and income in a way that should increase
consumer welfare over time. Russia’s experience in the
restructuring of its agricultural production and
consumption during transition is in fact representative
of that of all the countries of the former Soviet bloc.1
Beginning in the early 1970s, the Soviet Union
(USSR) began expanding its livestock sector, a policy
generally copied by its Eastern European satellite
countries. The campaign succeeded, and by 1990 live-stock
herds and meat production in the USSR (as well
as East European countries) were about 50 percent
higher than in 1970. Because the main reason for
expanding the livestock sector was to improve living
standards by increasing consumption of high-value
livestock products, the government did not want
consumers to have to pay the high cost of livestock
production. Thus, consumer prices for livestock goods
were set far below production costs. ERS research
shows that in 1986, consumer prices for livestock
goods in the USSR and many East European countries
were about half the prices received by livestock
producers (Liefert and Swinnen).2
Massive subsidies to both producers and consumers
were required to cover the gap. By 1990, state budget
subsidies to the agro-food economy in the USSR
equaled about 11 percent of GDP (World Bank, p.
138), with the bulk going to the livestock sector. By
1990, per capita consumption of meat and other live-stock
products in the USSR and other bloc countries
was on a par equal to that in most rich Western coun-tries.
For example, in 1990, per capita consumption of
meat in Russia, Poland, and Romania was about equal
to that in Britain (at about 75 kilograms a year), and in
1 For detailed analysis as to how reform has restructured agricul-tural
production and consumption in not only Russia, but all the
transition economies of the former Soviet bloc, see Liefert and
Swinnen, and Cochrane et al.
2 Because consumer retail prices for foods include costs for pro-cessing
and distribution as well as the cost of primary agricultural
production, the consumer prices used to compute this ratio are
the prices paid by the immediate purchasers of the primary agricul-tural
products (typically processors). Soviet policy was to apply
the subsidies to agriculture specifically at the processing stage,
such that processors' purchaser prices were below the prices
received by agricultural producers.
36 Food Security Assessment / GFA-15 / May 2004 Economic Research Service/USDA
3. Hungary it was higher (FAO). Since per capita GDP
and income in these planned economies were at most
half that of the developed Western economies, the
former were producing and consuming livestock prod-ucts
at a much higher level than one would predict
based on their real income (Sedik). Further evidence
that these countries were overconsuming livestock
products relative to their real income is that in the
more successfully reforming transition economies
whose real GDP has surpassed the pre-reform level,
consumption of livestock products is still below pre-reform
volumes. In 2000, real per capita GDP in
Poland, Hungary, and the Czech Republic was, respec-tively,
43, 12, and 10 percent higher than in 1990
(PlanEcon-a), while per capita consumption of meat
was 4, 12, and 24 percent lower, respectively (FAO).
The lead policy of Russia’s economic reform begun in
1992 was price liberalization, accompanied by the
slashing of subsidies to producers and consumers. The
freeing of prices led to huge economywide inflation,
which substantially reduced consumers’ real incomes
as prices rose by a greater percentage than wages and
salaries. In 1992 alone, per capita consumer real
income in Russia fell 47 percent (PlanEcon-b).
Incomes also fell because of a rise in unemployment
or underemployment during transition, as old jobs
were lost or scaled back faster than new jobs were
created. Although in 2002 Russia’s official unemploy-ment
rate was only 8 percent, this figure probably
understates real unemployment. Also, much of the
employed labor force is underemployed (and as a
result poorly paid). In 2002, Russian per capita real
income was still about 35 percent below that in 1991.
Livestock products have high income elasticity of
demand compared to other foodstuffs, which means
that demand is fairly responsive to changes in income.
Consequently, falling income particularly hurt the live-stock
sector, as consumers shifted demand away from
high-value (and high-cost) foods (fig. B-2). Reform in
fact created entirely new goods and, in particular, serv-ices
(ranging from legal and financial services to car
repair and health clubs), which were unavailable under
the old regime and to which demand has turned during
reform. The demand-driven downsizing of the live-stock
sector also lowered demand for animal feed
(feed grains and oilseeds), which helps explain why
Russia’s grain output has also plummeted during tran-sition.
However, consumer demand in Russia for staple
foods, such as bread and potatoes, has remained
steady, or even increased (fig. B-2).
The drop in production and consumption of livestock
products has therefore been an inevitable part of market
reform, as consumers’ desires for goods replaced plan-ners’
preferences as the dominant force in determining
what goods are produced and consumed. The move in
consumer demand away from high-value livestock prod-ucts
to other goods and services is part of the economy-wide
restructuring of consumer demand that in the long
run will increase consumer welfare, as producers
respond to what consumers want to purchase at existing
prices. It might seem surprising to describe livestock
products as goods more favored by planners than
consumers. Yet, when the prices of goods began to
Figure B-2
Changes in per capita food consumption: 1990 to 2000
Percent
Meat Milk Sugar Cereals
20
10
0
-10
-20
-30
-40
-50
-60
-45 -44
-26
Source: Russian Federation State Committee for Statistics-b.
11
Potatoes
Vegetables Fruit
-1
-3 -3
Economic Research Service/USDA Food Security Assessment / GFA-15 / May 2004 37
4. reflect the full cost of their production, and consumers’
real incomes were adjusted to correct for the distorted
prices of the pre-reform period, consumers switched
from buying high-cost livestock products to other goods
and services (see Liefert et al.).
Although production of agricultural goods has fallen
during transition, consumption has dropped less than
output. By the early 2000s, Russia was a net importer
of many foodstuffs, especially of meat and other live-stock
products. In fact, imports in 2002 accounted for
over half of all poultry consumption, with the bulk
coming from the United States, and about a quarter of
all consumption of beef and pork (mainly from the
European Union). Russia’s imports of livestock prod-ucts
indicate uncompetitiveness in these products vis-à-
vis the world market, which is supported by the fact
that when Russia began its reform in the early 1990s,
domestic producer prices for most agricultural prod-ucts
were higher than world prices (OECD-a). More
specifically, Liefert finds that Russia has a general
comparative disadvantage in agricultural outputs
compared with agricultural inputs, and a comparative
disadvantage in producing meat compared with grain.
Although Russia’s agricultural uncompetitiveness has
contributed to the overall decline in agricultural
production during transition, its large food imports
have had the effect of raising overall food availability
and consumption to levels higher than would exist in
the absence of trade. If Russians have the necessary
purchasing power, they can obtain through market
purchases an adequate supply of food, whether it is
produced domestically or imported.3
The only food availability problem of any seriousness
during transition has occurred when grain surplus-producing
regions within the country banned or
restricted grain outflows. The result has been that
grain-deficit regions in the north and east have been
unable to obtain needed supplies. Although imports
could conceivably make up any shortfalls, the affected
regions tend to be geographically isolated, such that
imports have difficulty penetrating, or only with high
transport and transaction costs. Also, because the
regional bans can be imposed without much warning,
deficit regions might lack the time to acquire substitute
foreign supplies. Although the outflow restrictions
violate federal law, the federal government has not
been able to prevent them.
Controls on grain outflows usually occur when poor
harvests raise concerns by local authorities that
regional production will not satisfy local requirements.
Russia’s bumper grain harvests of 2001 and 2002
largely eliminated these measures, but poor harvests
could bring them back.
Access
The main food security problem in Russia during transi-tion
has been insufficient access to food by certain
socioeconomic groups. The transition experience
increased poverty in Russia, such that part of the popu-lation
has insufficient purchasing power to afford a
minimally healthy diet. Based on per capita food avail-ability
data and assumptions concerning the distribution
of caloric consumption throughout the population, FAO
estimates that in 1996-98 about 6 percent of Russia’s
population had inadequate food consumption (defined
by FAO and throughout this article as daily caloric
intake below the FAO/WHO/UNU minimum daily
requirement for Russia of 1,970 calories; Sedik et al.).
The incidence of inadequate food consumption in
Russia can also be roughly estimated from the Food
Security Survey done for FAO by Russia’s Association
Agro in 11 Russian oblasts (regions) in December
2000-January 2001 (Sedik et al.). The survey was
limited to households (including single-person ones) at
or below the official poverty line. The survey found
that 41 percent of the poor experienced inadequate
food consumption. In 2000, 29 percent of the Russian
population had money incomes below the poverty line,
and in 2001 the figure fell slightly to 28 percent
(Russian Federation State Committee for Statistics-b).
If one assumes no individuals or households above the
poverty line were food inadequate, one can estimate
the share of the country’s total population that was
food inadequate by multiplying the percentage that
was poor (29 percent in 2000) by the percentage of
poor who were food inadequate (41 percent). The
resulting figure is 12 percent. The most likely reason
why this calculation for 2000 finds a greater incidence
of food inadequacy than the FAO does for 1996-98
based on food availability is that Russia’s severe
economic crisis that struck in 1998 reduced GDP and
personal incomes, and thereby increased poverty.
3 In 2003, Russia imposed tariff-rate quotas for its imports of beef
and pork, and a pure quota for imports of poultry. The annual low-tariff
quota for beef (0.42 million metric tons) and pork (0.45 mil-lion
tons) and quota for poultry (1.05 million tons) were set at
about two-thirds of the volume of imports in 2003. Although these
trade restrictions should reduce domestic meat consumption, they
will not in any way threaten food security.
38 Food Security Assessment / GFA-15 / May 2004 Economic Research Service/USDA
5. The major cause of the growth in poverty during tran-sition
has been the decline in real per capita income
(as discussed earlier), the two big drops occurring in
the first half of the 1990s and in 1998-99 following the
economic crisis that hit in August 1998. Not only have
incomes dropped, but the move from a planned to a
market economy has made the distribution of income
more unequal. In 1990, the top 20 percent of income
earners received 33 percent of all income and the
bottom 20 percent received only 10 percent. By 2000,
the share of the top 20 percent had risen to 48 percent,
and that of the bottom 20 percent had fallen to 6
percent (Russian Federation State Committee for
Statistics-b).
Aggravating the poverty-generating effects of the
decline in income, and the growing inequality of
income distribution, has been the weakening of the
state social welfare system. During transition, both the
federal and regional governments have faced severe
funding constraints for social welfare expenditure. The
state welfare system has been unable to maintain a
safety net guaranteeing that all individuals live above
the poverty level and have a minimally healthy diet. In
2002, social welfare transfers from the state comprised
a larger share of personal income than in 1992—35
percent versus 31 percent (Mroz et al.). Yet, given that
real income fell substantially during this period, the
value of total social welfare transfers in real terms
clearly dropped.
Pensions have continued to be the most important state
transfer payment, though they have steadily declined in
real terms—from 1994 to 1999 by 52 percent, mainly
because nominal payments were not adjusted for infla-tion
(OECD-b). Certain transfer programs of the Soviet
period, however, have suffered even larger reductions,
one example being universal child allowances. These
payments fell in real terms from 1994 to 1999 by 60
percent, and by the late 1990s the bulk of eligible
households were receiving no benefit whatsoever
(OECD-b). Medical and educational services have dete-riorated
during the transition period, such that formal or
informal charges have become necessary for service.
Most social welfare benefits in fact favor households
with above-average incomes. In 1998, the top 30
percent of income earners received 48 percent of all
benefits, while the bottom 40 percent received only 25
percent (OECD-b). Subsidies favoring the better off
include those for housing, fuel, and transport.
A factor that has greatly mitigated the food insecurity
risk to the population from falling money income and
the weakening of the social welfare system is that
most Russians have a farm or garden plot on which to
grow foodstuffs. All households on former state and
collective farms independently operate a plot of land,
averaging about half a hectare in size, used to produce
livestock products as well as potatoes, vegetables, and
fruit. Seventy-one percent of urban residents also have
a garden plot (though only 46 percent in oblast capital
cities), usually located at their country dacha, or
cottage (Sedik et al.). The garden plots also typically
grow potatoes, vegetables, and fruit, thereby providing
a valuable supplement to households’ food supply
obtained from commercial purchase. A garden plot
appears to be a sufficient guarantee in Russia against
food insecurity.
A recent FAO study found that the most food insecure
groups in Russia are those with one or more of the
following traits: low income, large households, and no
garden plot (Sedik et al.). Table B-1 gives results from
the FAO-sponsored survey on food security in Russia
by Association Agro, which (as discussed earlier)
covers only the poor, not the entire population.
Nonetheless, the table shows a clear inverse relation-ship
between income and inadequate food consump-tion.
Fifty-seven percent of individuals in the lowest
income decile (among the poor) had inadequate
Table B-1—Food inadequacy among the poor
negatively correlated with income
Per capita Food
monthly cash Average inadequate
and plot income consumption population
(Kcal/capita/day) Percent
Lowest decile 1,995 57
Second decile 2,176 46
Third decile 1,935 64
Fourth decile 2,273 38
Fifth decile 2,191 46
Sixth decile 2,280 38
Seventh decile 2,223 43
Eighth decile 2,376 41
Ninth decile 2,551 29
Highest decile 3,128 13
All poor households 2,326 41
Note: The table covers only the population living at or below the
poverty level.
Source: Sedik, Wiesmann, and Sotnikov.
Economic Research Service/USDA Food Security Assessment / GFA-15 / May 2004 39
6. consumption, compared with only 13 percent in the
highest income decile (also among only the poor).
Table B-2, which draws from the same survey, shows a
positive relationship between family size and inade-quate
food consumption. Only 16 percent of 1-adult-only
households are food inadequate (daily per capita
consumption below 1,970 calories); 28 percent of 2-
adult-only households are food inadequate; 50 percent
of households with 2 adults, 3 or more children, and
no relatives; and 73 percent of households with 1
adult, 3 or more children, and no relatives.
The third main trait of the food insecure is that they have
no garden plot on which to grow food (mainly potatoes,
vegetables, and fruit). Given that urban dwellers are less
likely to have a garden plot than the rural population,
they have a higher incidence of food inadequacy.
During the last few years, the macroeconomic situation
in Russia has improved substantially, such that poverty is
declining (Russian Federation State Committee for
Statistics-b). Since 1999 (the year following Russia’s
serious financial crisis), GDP has grown at an average
annual rate of 6 percent. The unemployment rate has
dropped from 12 to 8 percent, though much underem-ployment
continues. From 1999 to 2002, real wages rose
by about one-third. GDP growth has increased govern-ment
revenue, making more funding available for social
welfare expenditures. From 1999 to 2002, real govern-ment
expenditures on welfare increased by about two-thirds.
The resulting decline in poverty in all likelihood
has reduced the size of the food insecure population.
Most macroeconomic forecasters predict that Russia’s
GDP will continue to grow throughout the decade at 4-
5 percent a year. Such growth should further reduce
poverty and food insecurity. Yet, forecasters acknowl-edge
that Russia’s macroeconomic improvement is
fragile, and could be reversed. Two of the main
reasons for Russia’s macroeconomic turnaround
following the financial crisis of 1998 was the rise in
world energy prices and the severe depreciation of the
ruble, in both nominal and real terms. Energy exports
(mainly oil and natural gas) continue to provide about
half of Russia’s hard currency export earnings, as well
as government tax revenue. A major downturn in
world energy prices would severely hurt state finances.
The depreciation of the ruble following the financial
crisis substantially improved the price competitiveness
of all Russia’s tradable goods, providing an engine for
GDP growth. However, since 1999 the ruble has been
appreciating in real terms, as the inflation rate has
exceeded any nominal depreciation in the exchange
rate. Macroeconomic forecasters (such as PlanEcon)
believe that the ruble is still undervalued in real terms,
and that real appreciation should continue in the short
to medium term. By harming the competitiveness of
Russian industry and agriculture, real appreciation of
the currency has the isolated effect of inhibiting GDP
and income growth.
Nutrition
Sedik et al. argue that in Russia overweight and
obesity are more serious health problems than under-weight
or nutritionally deficient diets. More than half
of the adult population is overweight or obese (fig. B-
3), and for those aged 60 and above the figure is about
two-thirds. (In the figure, the obese are not included
among the overweight.) This challenges any belief that
the elderly in Russia suffer from food insecurity more
than other age groups. In even the lowest income
groups, overweight and obesity are much more
common than underweight, though a correlation exists
between overweight and income. Obesity has in fact
increased during transition, rising from 23 percent of
the population in 1992 to 33 percent in 2000.
Table B-2—Food inadequacy among the poor
positively correlated with household size
Food
Average inadequate
Household type consumption population
(Kcal/capita/day) Percent
All household members 2,326 41
Children 2,259 42
Pensioners 2,537 28
By household type
1 adult only 3,341 16
1 adult, 1-2 children, no relatives 2,304 34
1 adult, 1-2 children, relatives 1,811 41
1 adult, 3+ children, no relatives 1,665 73
1 adult, no children, relatives 2,099 62
Pensioner family of 1 2,873 19
2 adults only 2,608 28
2 adults, 1-2 children, no relatives 2,142 48
2 adults, 1-2 children, relatives 2,209 45
2 adults, 3+ children, no relatives 2,128 50
2 adults, 3+ children, relatives 2,650 35
Note: The table covers only the population living at or below the
poverty level.
Source: Sedik, Wiesmann, and Sotnikov.
40 Food Security Assessment / GFA-15 / May 2004 Economic Research Service/USDA
7. Figure B-3
Overweight and obesity is a serious problem:
Adults 30+
Percent
40 Underweight Overweight Obese
Sep. 1992 Oct. 2000
35
30
25
20
15
10
5
0
Source: Zohoori, Gleiter, and Popkin.
One reason for the prevalence of overweight and
obesity in Russia is traditional dietary preferences for
animal products high in protein and fat, to the relative
neglect of vegetables and fruit. The Soviet policy of
pushing the production and consumption of livestock
goods during the 1970s and 1980s, which included the
publication of recommended food consumption
“norms,” catered to these preferences. During transi-tion,
the per capita consumption of healthier foods
such as vegetables and fruit initially dipped, but has
since rebounded to close to pre-reform levels. Per
capita consumption of sugar has fallen, that of bread
products has remained steady, while that of potatoes
has risen (fig. B-2).
It seems paradoxical that although consumption of
high fat and cholesterol livestock products as well as
sugar has fallen substantially during the transition
period—along with total per capita caloric consump-tion—
overweight and obesity have increased. Part of
the explanation appears to be that overweight and
obesity have grown disproportionately among the
elderly. The elderly in fact have not economically
suffered unduly during transition relative to the overall
population, as indicated by an elderly poverty rate in
recent years below that of the population as a whole
(Russian Federation State Committee for Statistics-a).
They have become more overweight while other
groups have suffered more from declining food intake.
Another likely cause of overweight and obesity is that
society in general has become less physically active
and healthy, a plausible response to the psychological
tensions experienced by many during transition. The
combination of a high fat and cholesterol diet in
Russia and inadequate exercise results in high preva-lence
of cardiovascular disease, diabetes, and cancer.
These diseases have all increased during transition,
and therefore have contributed to the disturbing rise in
Russian mortality rates and fall in life expectancy
during transition (especially for men). Male life
expectancy in Russia fell from 64 years in 1990 to 58
years in 2002 (Russian Federation State Committee for
Statistics-b).4
Although malnutrition is not a serious problem in
Russia for either children or adults, the country suffers
from some specific micronutrient deficiencies. Most of
the Russian population (both children and adults) are
deficient in iodine (70 percent), fluoride, and selenium
(Sedik et al.). Iodine deficiency is the second most
common micronutrient deficiency in the world,
suffered by one-third of the earth’s population, and the
most common cause of preventable mental retardation.
Conclusion
The two main food-related problems in Russia are
inadequate access to food by a minority of the popula-tion,
and overweight and obesity. Russia’s most food
insecure groups have the following traits: low income,
large households, and urban residency with no garden
plot. Targeted transfers of food or money to such
groups could therefore be a cost-effective way to
reduce food insecurity.
The agricultural establishment in Russia argues for a
different response to the problem, and in fact identifies
the problem differently. Agricultural interests contend
that the drop in production and consumption of live-stock
products during transition is evidence by itself of
a serious food security problem, and uses the argument
to lobby for increased state support and trade protec-tion.
Yet, as mentioned before, food consumption
measured in per capita caloric intake has dropped only
marginally during transition. Although consumption of
high-value and high-cost livestock products has fallen
substantially, consumption of staple foods such as
bread and potatoes has remained steady or even
increased. Russia does not suffer from inadequate food
4 Other likely reasons for increasing mortality include the surge in
alcohol consumption and growing demoralization and depression
from the disruptions and pressures of reform, which increase acci-dents,
murders, and suicides.
Economic Research Service/USDA Food Security Assessment / GFA-15 / May 2004 41
8. availability. Raising subsidies and trade protection for
Russian agriculture in order to improve food security
through increased domestic production of foodstuffs
would be an expensive and inefficient response to a
misdiagnosed problem.
Russia’s improving macroeconomic performance of
the past few years has substantially reduced poverty
and improved access to food by the poor. The macro-economic
upturn expands the income of the poor by
reducing unemployment and increasing real wages. In
addition, economic growth raises government revenue,
which can be used to strengthen the social welfare
system. Projected annual growth rates of GDP and
personal income over the coming decade of 4-5
percent provide a basis for believing that Russia’s food
security will improve rather than worsen. State policies
that promote growth and macroeconomic stability
would therefore also improve food security.
Although the Soviet practice of pushing heavy
consumption of livestock products has been largely
discontinued, Russians retain traditional preferences
for livestock products heavy in fat, protein, and choles-terol—
such as meat, dairy products, and eggs. This
contributes to the second major food-related
problem—overweight and obesity—which increased
during transition. The growth in obesity has probably
contributed to the rise in the mortality rate and drop in
life expectancy (especially among males) during tran-sition.
Public promotion of a diet involving more
vegetables and fruit, as well as of behavioral changes
such as more exercise, would bring health benefits.
U.S. and Western Food Aid to Russia
In 5 years during the period 1990-2000, food security
concerns about Russia motivated the United States
and other Western countries, mainly the European
Union (EU), to provide food aid to the country. The
main reason these years generated aid was poor
Russian grain harvests caused largely by bad weather.
The largest aid package was given in 1999-2000,
motivated mainly by Russia’s lowest grain harvest
in 50 years (48 million metric tons). Both the
United States and EU provided aid, with some
targeted specifically to needy social groups and
regions. The U.S. package involved 3.1 million tons
of commodities. Of that total, 1.9 million tons of
commodities were donated, including 1.7 million
tons of wheat from the Commodity Credit
Corporation and 0.2 million tons of various
commodities from the U.S. Food for Progress
Program. The donations were worth $589 million,
broken down into $409 million for the commodities
and $180 million for transportation. The United
States also gave Russia a $520 million trade credit
to purchase 1.3 million tons of commodities such as
corn, soybeans, and meat under P.L. 480 Title I. The
EU package provided 1.8 million tons of agricul-tural
goods (including 1 million tons of wheat)
worth $470 million (Liefert and Liefert).
EU food aid shipments, as well as much of the U.S.
aid, were sold on the market at existing prices, with
the revenue going to the state pension fund.
However, part of the Food for Progress donation
was distributed by private voluntary organizations to
the poor, while the remainder was sold, with the
revenue supporting seed research institutes and
credit facilities.
42 Food Security Assessment / GFA-15 / May 2004 Economic Research Service/USDA
9. Reference
Cochrane, N., B. Bjornlund, M. Haley, R. Hoskin, O.
Liefert, and P. Paarlberg. Livestock Sectors in the
Economies of Eastern Europe and the Former
Soviet Union: Transition from Plan to Market and
the Road Ahead. Economic Research Service, U.S.
Dept. of Agriculture, Agricultural Economic Report
No. 798, February 2002.
Economic Research Service (ERS), U.S. Dept. of
Agriculture. Estimates of Producer and Consumer
Subsidy Equivalents: Government Intervention in
Agriculture, 1982-92. Statistical Bulletin No. 913,
Washington, DC, December 1994.
Food and Agriculture Organization (FAO). FAOSTAT
Database (electronic subscription product).
Liefert, W. “Comparative (Dis?)Advantage in Russian
Agriculture.” American Journal of Agricultural Eco-nomics
84, 3:762-767, August 2002.
Liefert, W., and O. Liefert. “Russia’s Economic Crisis:
Effects on Agriculture.” Agricultural Outlook, Eco-nomic
Research Service, U.S. Dept. of Agriculture,
Washington, DC, June 1999, pp. 15-18.
Liefert, W., and J. Swinnen. Changes in Agricultural
Markets in Transition Economies. Economic
Research Service, U.S. Dept. of Agriculture, Agri-cultural
Economic Report No. 806, Washington,
DC, February 2002.
Liefert, W., B. Lohmar, and E. Serova. “Transition and
Food Consumption.” Presented at the Meeting of
the International Association of Agricultural Econo-mists
in Durban, South Africa, August 2003.
Mroz, T., L. Henderson, M. Bontch-Osmolovski, and
B. Popkin. Monitoring Economic Conditions in the
Russian Federation: The Russia Longitudinal Moni-toring
Survey 1992-2002. Report submitted to the
U.S. Agency for International Development. Car-olina
Population Center, University of North Car-olina,
March 2003.
Organization for Economic Cooperation and Develop-ment
(OECD-a). Review of Agricultural Policies:
Russian Federation. Paris, 1998.
Organization for Economic Cooperation and Develop-ment
(OECD-b). The Social Crisis in the Russian
Federation. Paris, 2001.
PlanEcon-a. Review and Outook for Eastern Europe.
Washington, DC, annual.
PlanEcon-b. Review and Outlook for the Former Soviet
Republics. Washington, DC, annual.
Russian Federation State Committee for Statistics-a.
Dokhodi, Rakhodi, i Potreblenie Domashnukh
Khoziaisvto (Household Income, Expenditures, and
Consumption). Moscow, Russia, annual, see 2000
and 2002.
Russian Federation State Committee for Statistics-b.
Rossiiskii Statisticheskii Ezhegodnik (Russian Statis-tical
Yearbook). Moscow, annual.
Sedik, D. “A Note on Soviet Per Capita Meat Con-sumption.”
Comparative Economic Studies 35,
3:39-48, Fall 1993.
Sedik, D., D. Wiesmann, and S. Sotnikov. Food Secu-rity
in the Russian Federation. Food and Agriculture
Organization, Rome, Italy, 2004.
World Bank. Food and Agricultural Policy Reforms in
the Former USSR: An Agenda for the Transition.
Studies of Economies in Transition, Paper No. 1,
Washington, DC, 1992.
Zohoori, N., K. Gleiter, and B. Popkin. Monitoring
Health Conditions in the Russian Federation: The
Russia Longitudinal Monitoring Survey 1992-2002.
Report submitted to the U.S. Agency for Interna-tional
Development, Carolina Population Center,
University of North Carolina, March 2001.
Economic Research Service/USDA Food Security Assessment / GFA-14 / February 2003 43