1 statistical description
•Download as DOCX, PDF•
0 likes•1,669 views

Stats Practice material

Recommended
More Related Content
What's hot
What's hot (20)
Similar to 1 statistical description
Similar to 1 statistical description (20)
More from Anas Farooq Maniya AFM
More from Anas Farooq Maniya AFM (12)
Recently uploaded
Recently uploaded (20)
1 statistical description
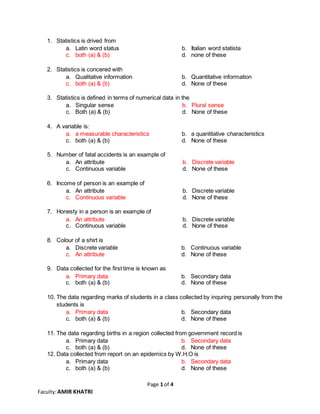
- 1. Page 1 of 4 Faculty:AMIR KHATRI 1. Statistics is drived from a. Latin word status b. Italian word statista c. both (a) & (b) d. none of these 2. Statistics is concered with a. Qualitative information b. Quantitative information c. both (a) & (b) d. None of these 3. Statistics is defined in terms of numerical data in the a. Singular sense b. Plural sense c. Both (a) & (b) d. None of these 4. A variable is: a. a measurable characteristics b. a quantitative characteristics c. both (a) & (b) d. None of these 5. Number of fatal accidents is an example of a. An attribute b. Discrete variable c. Continuous variable d. None of these 6. Income of person is an example of a. An attribute b. Discrete variable c. Continuous variable d. None of these 7. Honesty in a person is an example of a. An attribute b. Discrete variable c. Continuous variable d. None of these 8. Colour of a shirt is a. Discrete variable b. Continuous variable c. An attribute d. None of these 9. Data collected for the first time is known as a. Primary data b. Secondary data c. both (a) & (b) d. None of these 10. The data regarding marks of students in a class collected by inquring personally from the students is a. Primary data b. Secondary data c. both (a) & (b) d. None of these 11. The data regarding births in a region collected from government record is a. Primary data b. Secondary data c. both (a) & (b) d. None of these 12. Data collected from report on an epidemics by W.H.O is a. Primary data b. Secondary data c. both (a) & (b) d. None of these
- 2. Page 2 of 4 Faculty:AMIR KHATRI 13. Some of the important sources of secondary data are a. Central & state governments published data b. IMF & UNO c. Magazines & journals d. All of these 14. In which method of collection of primary data, the amount of non-responses is maximum? a. Mailed questionnaire b. Interview method c. Observation method d. All of these 15. The most attractive method of data presentation is a. Tabular b. Textual c. Classification d. Graphical 16. The classification of data according to occurrence of time is known as a. Chronological b. Geographical c. Qualitative d. Quantitative 17. State-wise growth rate for the year 2013-2014 is a. Chronological b. Geographical c. Qualitative d. Quantitative 18. Classification on the basis of attributes is ………… classification. a. Chronological b. Geographical c. Qualitative d. Quantitative 19. The following series is type of Village A B C D E Population 25000 37750 40000 20000 15750 a. Time series b. Qualitative c. Geographical d. Chronological 20. The nuymber of observations corresponding to a particular class is known as ……… of that class. a. Class length b. Mid value c. Frequency d. None of these 21. The frequency of a variable is always in a. Ratio b. A fraction c. An integers d. Percentage 22. The ratio of the frequency of a given class to the corresponding class interval is known as a. Frequncy density b. Mid value c. Relative frequency d. None of these
- 3. Page 3 of 4 Faculty:AMIR KHATRI 23. The ratio of the frequency of a given class to the total frequency is known as a. Frequncy density b. Mid value c. Relative frequency d. None of these 24. Relative frequency for a particular class a. Lies between 0 & 1 b. Lies between 0 & 1, both inclusive c. Lies between -1 & 0 d. Lies between -1 & 1 25. The mid values of a frequency distribution is 2.5, 7.5, 12.5, …… the first class is a. 1 – 4 b. 0 – 5 c. 2 – 3 d. None of these 26. Diagrammatic representation of data is done by a. Diagrams b. Charts c. Pictures d. All of these 27. For tabulation, ‘Caption’ is a. The upper part of the table b. The lower part of the table c. The heading of horizontal rows d. The heading of vertical columns 28. For tabulation, ‘Stub’ is a. Left part of the table describing the columns b. Right part of the table describing the columns c. Left part of the table describing the rows d. Left part of the table describing the rows 29. The entire upper part of a table is known as a. Body b. Box head c. Caption d. Stub 30. The unit of measurement in tabulation is shown in a. Body b. Box head c. Caption d. Stub 31. In tabulation, source of the data, if any is shown in the a. Box head b. Body c. Footnote d. Caption 32. Multiple line chart is applied for a. Showing multiple charts b. Two or more related time series when variable are expressed in same units. c. Two or more related time series when variable are expressed in different units. d. None of these 33. Vertical bar diagram is applicable when a. The data are qualitative b. The data are quantitative c. The data vary over time d. None of these 34. Pie diagram is used for a. Computing different components & their relation to the total
- 4. Page 4 of 4 Faculty:AMIR KHATRI b. Representing qualitative data in a circle c. Representing quantitative data in a circle d. None of these 35. Which of the following consist of a set of continuous rectangles whose areas are proportional to the frequncies. a. Bar diagram b. Divided bar diagram c. Pie diagram d. Histogram 36. Histogram cannot be constructed for a. Frequency distribution with unequal class lengths b. Frequency distribution with open-end classes c. Both (a) & (b) d. None of these 37. Ogive is a a. Line diagram b. Bar diagram c. both (a) & (b) d. none of these 38. In histogram, the classes are taken as a. Overlapping b. Non overlapping c. both (a) & (b) d. none of these 39. Mode of a distribution can be obtained from a. Histogram b. Less than type ogive c. more than type ogive d. frequency polygon 40. Using less than type ogives which of the following can be determined? a. Median b. Quartiles c. Deciles d. All of these 41. Which of the following is a closed graph? a. frequency polygon b. frequency curve c. histogram d. all of these 42. Joining the mid points of the bars of the histogram with a smooth curve gives. a. frequency polygon b. frequency curve c. less than type ogive d. none of these 43. most of the commonly used frequency curves are a. U shaped b. J shaped c. Bell shaped d. Mixed 44. The following data relate to the marks of 50 students: Marks 0 – 20 20 – 40 40 – 60 60 – 80 80 – 100 No. of Students 2 12 17 11 8 What is the percentage of students getting less than 40 marks? a. 52 b. 4 c. 24 d. 28