
Recommended
More Related Content
Similar to Education poll of the south fact sheet r2
Similar to Education poll of the south fact sheet r2 (20)
More from Analisa Sorrells
More from Analisa Sorrells (20)
Recently uploaded
Recently uploaded (20)
Education poll of the south fact sheet r2
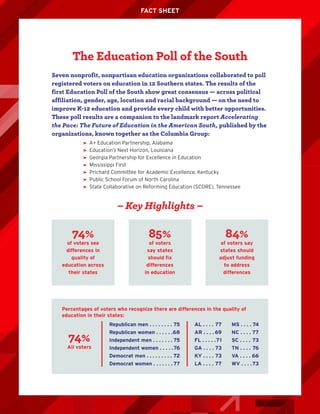
- 1. Seven nonprofit, nonpartisan education organizations collaborated to poll registered voters on education in 12 Southern states. The results of the first Education Poll of the South show great consensus — across political affiliation, gender, age, location and racial background — on the need to improve K-12 education and provide every child with better opportunities. These poll results are a companion to the landmark report Accelerating the Pace: The Future of Education in the American South, published by the organizations, known together as the Columbia Group: ‰ A+ Education Partnership, Alabama ‰ Education’s Next Horizon, Louisiana ‰ Georgia Partnership for Excellence in Education ‰ Mississippi First ‰ Prichard Committee for Academic Excellence, Kentucky ‰ Public School Forum of North Carolina ‰ State Collaborative on Reforming Education (SCORE), Tennessee FACT SHEET The Education Poll of the South – Key Highlights – 74% of voters see differences in quality of education across their states 85% of voters say states should fix differences in education 84% of voters say states should adjust funding to address differences 74% All voters Republican men . . . . . . . . 75 Republican women . . . . . .68 Independent men . . . . . . . 75 Independent women . . . . .76 Democrat men . . . . . . . . . 72 Democrat women . . . . . . . 77 AL . . . . 77 AR . . . . 69 FL . . . . .71 GA . . . . 73 KY . . . . 73 LA . . . . 77 MS . . . . 74 NC . . . . 77 SC . . . . 73 TN . . . . 76 VA . . . . 66 WV . . . .73 Percentages of voters who recognize there are differences in the quality of education in their states:
- 2. FACT SHEET The Education Poll of the South – Key Highlights – 85% All voters Republican men . . . . . . . . 85 Republican women . . . . . .82 Independent men . . . . . . .83 Independent women . . . . 83 Democrat men . . . . . . . . . 90 Democrat women . . . . . . 88 AL . . . . 83 AR . . . .84 FL . . . . 73 GA . . . . 79 KY . . . . 86 LA . . . . 89 MS . . . . 87 NC . . . .88 SC . . . . 86 TN . . . . 88 VA . . . . 88 WV . . . .87 Percentages of voters who say states should take action to correct these differences in education: 84% All voters Republican men . . . . . . . . 79 Republican women . . . . . . 77 Independent men . . . . . . . 77 Independent women . . . . 82 Democrat men . . . . . . . . . 86 Democrat women . . . . . . . 91 AL . . . . 81 AR . . . .83 FL . . . . 75 GA . . . . 78 KY . . . . 83 LA . . . . 84 MS . . . .80 NC . . . . 86 SC . . . . 86 TN . . . . 81 VA . . . . 84 WV . . . 86 Percentages of voters who say their states should adjust school funding to ensure greater fairness between wealthy and poor communities: WHO WAS POLLED? ‰ 2,200 registered voters across 12 states (including only northern Florida and southern Virginia). ‰ Demographics roughly matched voters in each state by gender and racial/ethnic background. ‰ Urban, suburban and rural voters were represented in proportion to their status as registered voters in each state. ‰ Income levels also were represented in proportion to their status as registered voters in each state. The Education Poll of the South was conducted in October 2017 by Public Opinion Strategies of Alexandria, Va. For complete details, visit www.acceleratingthepace.org.