1. International Journal of Business and Management; Vol. 10, No. 10; 2015
ISSN 1833-3850 E-ISSN 1833-8119
Published by Canadian Center of Science and Education
194
Analysis of Relevance Concept of Measurement Capm Return and Risk
of Shares
Aminullah Assagaf1
1
Post Graduate Program University Dr. Soetomo, Surabaya, Indonesia
Correspondence: Priyono, Post Graduate Program University Dr. Soetomo, Surabaya, Indonesia. E-mail:
priyono.unu_sidoarjo@yahoo.com
Received: August 6, 2015 Accepted: September 10, 2015 Online Published: September 18, 2015
doi:10.5539/ijbm.v10n10p194 URL: http://dx.doi.org/10.5539/ijbm.v10n10p194
Abstract
This study aims to ensure that the concept of CAPM still have strong relevance for use by financial experts,
decision makers or management of companies and investors in the capital market to determine or quantify the risk
or beta (β) shares.
The method used is the econometric approach and try to compare earlier research model that has been used by
researchers and financial experts in several different places and periods. The selected sample is the most actively
traded shares on the Indonesian Stock Exchange (BEI) in the period September to November 2014. The data used
is data weekly or every Wednesday, to avoid anomalies or abnormalities price on Monday and Friday.
The results obtained from this study are: (A) model that has been used or developed but the result is the same in the
valuation of the beta (β), but differ in the value of alpha (α) in each of these models, because the risk free return (Rf)
constant during the observation period, or there will be differences in the value of beta (β) and alpha (α) when Rf is
varied during the observation period. (B) According to research data, the ratio of non-linear or quadratic models is
more relevant to use in assessing beta stocks, as comparison determinant coefficient (R2
) of linear and non-linear
models for the entire company shares were observed. (C) Results of measurement estimate stock return (Ri) both
with linear and non-linear models, shows that the concept is still relevant or CAPM model used in the
measurement of beta (β) shares. (D) non-linear model based Ln can not be used when there are negative returns or
loss, as in this study, the data to for transformation will an error and SPSS simulation process can not be done. (E)
In addition to the concept of CAPM still there are many important things that must be considered in relation to the
risk and return of investment.
Keywords: capital asset pricing model (CAPM), arbitrage pricing theory (APT), capital investment
1. Introduction
The concept of capital asset pricing model or CAPM is the traditional concepts that are often found in the books of
financial management, and is widely used by financial experts, management or enterprise decision makers and
investors in the analysis of investment in the capital market. The concept is relatively simple CAPM application
because the data is relatively easy to obtain through various information media. Data availability and relatively
easy to obtain in the form of time series and cross section so facilitate researchers.
to access from a variety of sources available either manually or online system. Time series data are available
various alternatives in the form of an annual period, quarterly, monthly, weekly and daily. Departing from the ease
of data acquisition and understanding of CAPM concepts, so widely used in research and investment decisions in
the stock market. On the other hand, the concept of CAPM is also heavily criticized, as in the study of Farma and
Frence (1992) in Brigman and Houston (2010) who found that there was no historical relation between stock
returns (Ri) and beta (β) market (Rm). Furthermore, studies Farma and France (2001) in Harjito and Martono
(2012) suggested that there are two variables that are consistently associated return stock that is (a) the size of the
company and (b) the ratio of market to book value. The study also found that smaller companies provide higher
yields, and higher return on stocks with market-to-book ratio is low. Instead after controlling for size company and
market-to-book ratio, they found no association between beta stocks with the rate of return or return these shares.
The weakness of the CAPM concept feared by researchers and analysis, then they do innovation in a way modify
or develop independent variables were considered related and not covered by the concept of CAPM. They
2. www.ccsenet.org/ijbm International Journal of Business and Management Vol. 10, No. 10; 2015
195
developed a model with variables that are considered more relevant, known as multivariable models. in
multivariable model is assumed that the risk is caused by several factors, while the concept of CAPM measure of
risk is confined to the return market (Rm). This multivariable models as a positive step that is considered important
in the theory of financial science, but still has weakness when applied in decision making. This is why the concept
of CAPM remains the most widely used method of estimating the stock return. CAPM concept is still quite
relevant and has the advantage, but in the development of the future is still possible to do modifications and
enhanced as was done in this study. Previous models that have been developed to improve the CAPM concept as
mentioned above, which adds several independent variables, but among the variables used in econometric turned
out to contain weakness in the form of violation of classical assumptions in shape multicollinearity or there is a
relationship between independent variables. Consequences for violations of the assumption of multicollinearity
both statistically and in theory, it is not valid models used to estimate the dependent variable. Variable use inflation,
interest rates and foreign exchange rates, in theory all three interrelated or occur multicollinearity among these
variables, so it is not valid to use in assessing stock returns (Ri). In addition, the three variables included in the
variable mentioned already market return (Rm) composite stock price index or CSPI used in CAPM model.
Empirical evidence shows that multicollienarity between variable inflation, interest and foreign exchange rates, for
example (a) originated from changes in the dollar exchange rate will push up the price of the product in the country
that uses the currency component of foreign and other related products in the market mechanism. (B) the price rise
could potentially bring wisdom monetary authorities to curb inflation through changes in prevailing interest rates.
Raise interest rates by the central bank is due to reasons of macro economic theory, namely the general interest
must be greater than inflation in order to avoid rush or withdrawal society massively because the return on savings
is less than the value inflation lowering the intrinsic value of the money saved in the bank. Another way people are
in a rush to move their funds in accounts dollars or other foreign currencies, which have an impact on the value of
the rupiah is getting worse, inflation is increasing, then the interest rises, and so on. Where the benefits of the
concept of CAPM because only the market return (Rm) as the only independent variable used in measuring the
impact on stock returns (Ri) was observed. The views of experts and practitioners who wish to modify and enhance
the CAPM concept as found in the approach Arbitrage Pricing Theory (APT), but the result is not optimal, because
of the weakness of the model innovation that is causing the invalid multicollinearity used in the valuation of stock
return (Ri). Based on the description above, in this study will be assessed the level of relevance of CAPM concept
that uses linear models, while the socio-economic conditions increasingly complex and takes place nonlinear. that
become the central issue in this study is whether the concept of CAPM is still relevant and reasonably fit for use in
measuring the value of beta (β) stock and stock return prediction (Ri) was observed. The objective was to examine
the relevance and appropriateness of the use of the concept of CAPM in an era of increasingly advanced
technological developments and increasingly complex business environment, by comparing the CAPM concept
with a model that will be developed.
Then the results will be tested or proved by using time series data development market return ( Rm ) to changes in
stock return ( Ri ) seed company or the most active stocks traded on the Indonesia Stock Exchange .
2. Literature Review and Reserach Hypothesis
The model capital asset pricing model , or CAPM not only as an abstract theory which is much discussed in various
literature sumer but this model has contributed and appeal of many parties to implement it in decision-making ,
notably by financial experts , management companies and investors .
CAPM model uses a variable stock return (Ri) , return free risk (Rf) and the market return (Rm), which is described
in equation form :
where
Ri = return of shares required by securities i;
Rf = risk-free return or return free risk;
Rm = market return or return market;
Βi = beta coefficient on the variable ( Rm-Rf) against securities i;
Assuming , as in Husnan (2009 ) , namely :
a. Short sales allowed, that it can not sell the securities which are owned and use the cash generated to purchase
other securities.
b. There is a risk freelending and borrowing rate.
c. Not considering the tax borne by the investor or tax free.
3. www.ccsen
d. The inv
homogene
Based on t
(SML) or l
SML slop
increment
risk premi
Because th
invest in th
higher the
investmen
low risk pr
Risk free r
premium o
Applicatio
1). Resear
stocks sele
2). Miller
According
3). In Balc
4). Studies
1994 to No
The estima
Adjusted R
(F-statistic
Besides us
1). The no
Scholes (1
net.org/ijbm
vestors have th
eous expectatio
the CAPM equ
line securities
e of shares in
of risk (Rm -
ium. Therefore
he height of the
he economy, b
level of the sto
nt shares in the
remiums and t
return (Rf) bas
of inflation or i
ons CAPM for
rch conducted
ected sample a
and Scholes
g to him, if we
Rit =
ck research, Jen
s conducted Hu
ovember 1996
ation results w
R-sqaured 0.35
c) 0.00039 and
sing the model
on-linear mode
972) referred
Intern
he same hopes
on.
uation can be d
markets or sec
ndicated by the
Rf), the greate
e, the slope of
e risks in the e
but on the capit
ock return. Thi
stock exchang
the possible ac
sed on the retu
inflation rate i
concept asses
by Lintner pu
and is expresse
(1972) in Hus
want to estima
= RFT + βi (R
nsen, and Scho
R
usnan (2009),
6, uses monthly
with simulation
R
539 which me
d prob (t-statist
l above, then th
l with data tran
to above.
national Journal
and risks tent
described the le
curities market
Ri = R
e beta (β) desc
er the beta (β),
f the SML lin
economy or the
tal market phen
is has caused t
ges, the higher t
cquisition of sh
urns as interes
is still at the bo
s beta stock, c
ublished in Do
ed in the model
Rit = α
snan (2009) m
ate beta with C
RMT + RFT) +
oles (1972) as
Rit - RFT = αi +
reported that t
y data, with the
Rit Ln = Ln
n data through
Rit Ln = Ln Ln
eans Rm able
tic) 0.0004.
he study will d
nsformation to
l of Business and
196
tag ingkat expe
evel of stock r
ts the followin
Rf + βi (Rm - Rf)
cribe the magn
, the slope of S
ne also shows
e increasingly
nomenon that
the views high
the possibility
hares lower ret
st consisting o
oundary contro
an be seen in t
ouglas (1968)
l as follows.
αi + βi Rmt + e
mentions the p
CAPM, the equ
eit. Or Rit = α
in Husnan (20
+ βi (RMT + R
the assessment
e following mo
Ln αi + βi Rm
software Micr
n 0.0139 + 1.2
to explain 35.
develop the mo
o the Ln, as a r
d Management
ected profit fro
returns are exp
ng lines.
f)
nitude of chan
SML more upr
the level of ri
steep SML sho
occurs the gre
risk high retur
of obtaining th
turn.
f (a) inflation-
ol by governm
the following s
as in Husnan
eit
possibility of b
uation that sho
αt + βi (RMT +
009), using the
RFT) + eit
t of beta stock
odel.
mt + eit
roTSP.60.
2048 Rmt
.39% change p
odel.
research model
V
om an investm
ressed as the s
nges in stock
right, which m
isk aversion h
ows the relucta
eater the stock'
rn, ie the highe
he return. Conv
-free real rate
ent and monet
several previou
(2009), estima
bias due to er
ould be used is
+ RFT) + eit
e following mo
ks on the stock
prob Ri with a
l development
Vol. 10, No. 10;
ment opportuni
security marke
return (Ri) at
means the highe
has been some
ance of investo
s risk premium
er the risks face
versely if a low
of return and
tary authorities
us studies:
ating a beta of
rrors in estima
:
odel:
Gresik period
a significance
Balck, Jensen
2015
ity or
t line
each
er the
how.
ors to
m, the
ed on
w risk,
(b) a
s.
f 301
ating.
d July
level
n, and
4. www.ccsenet.org/ijbm International Journal of Business and Management Vol. 10, No. 10; 2015
197
Ln (Rit - RFT) = Ln Ln αi + βi (RMT + RFT) + eit
2). The non-linear model with the transformation of data into a quadratic, as a research model development Balck,
Jensen, and Scholes (1972) referred to above.
(Rit - RFT) 2 = αi + βi (RMT + RFT) 2 + eit
3. Research and Methodolody
3.1 Model Analysis
Based on the model that has been used earlier as noted above, this study used a more relevant model to estimate
beta stocks. And as a comparison, the study also used simulated by using the model as in the previous studies and
literature review reserach hyphothesis mentioned above.
To prove the relevance of the model, then the selected samples in this study are the stocks of companies included in
the category of seed stock or the most actively traded on the Indonesia Stock Exchange. The data used are time
series period September to November 2014 using weekly data on every Wednesday. Wednesday consideration is
to obtain a rational price levels or avoid contention anomalies or abnormalities presumption stock market prices on
Monday and Friday.
From these data dioleh appropriate measurement method that has been determined, the calculation is then
processed through SPSS software version 22. In the simulation process, use the model as mentioned above, then
the results were compared between one model with other models. Results of the comparison and analysis
conducted in the end can be described estimation models are more relevant in assessing stock beta (β) and stock
return (Ri).
The model used in this study consisted of a model of linear and non-linear models as follows:
a. Model-1
Lintner study that was published by Douglas (1968) as in Husnan (2009).
Rit = αi + βi Rmt + eit
b. Model-2
Study Miller and Scholes (1972) as in Husnan (2009).
Rit = αt + βi (Rmt- RFT) + eit
c. Model-3
Black studies, Jensen, and Scholes (1972) as in Husnan (2009).
Rit = RFT + βi (Rmt- RFT) + eit
For the econometric estimation for which data are available and the process of regression calculations with SPSS
version 22, the simplified model used in the form of the following equation.
Rit - RFT = αi + βi (Rmt- RFT) + eit
d. Model-4
Non-linear models were developed in the form of quadratic.
(Rit - RFT) 2 = αi + βi (Rmt - RFT) 2 + eit
e. Model-5
Non-linear models developed by Husnan (2009).
Rit Ln = Ln Ln αi + βi Rmt + eit
f. Model-6
Non-linear models were developed from studies Black, Jensen, and Scholes (1972).
Ln (Rit - RFT) = Ln Ln αi + βi (Rmt- RFT) + eit
To prove the ability of the model to explain the phenomenon in terms of the return shares with a market return, will
be proven by the statistics and their relevance to actual conditions. The statistics will be compared mainly to the
beta coefficient stock, constants, the significance of the relationship between these variables and accuracy of
models used or the appropriate amount of determinand coefficient (R2
).
5. www.ccsenet.org/ijbm International Journal of Business and Management Vol. 10, No. 10; 2015
198
3.2 Determination of the Sample
To illustrate the relevance of CAPM kosep then in the study carried out observations of some leading stocks or the
most actively traded on the Indonesia Stock Exchange during the period September to November 2014 using a
sample weekly period as mentioned above, namely the period of 2 September 2014 until 12 November 2014 .
Shares of the company were chosen as samples are (a) International Astra or ASII, industrial or automotive
business, (b) Bank Central Asia or BBCA, banking business, (c) Bank Negara Indonesia 1946 or BBNI, banking
business, (d) Warehouse salt or GGRM, the tobacco industry, (e) Hero Super Market or HERO, retail business, (f)
Indofood Super Market or INDF, business retal and foodstuffs, (g) Kimia Farma or KAEF, binis pharmacy, (h)
Gas perusahaa or PGAS, gas fuel business, (i) Cement Cibinong or SMCB, cement industry, (j) Wijaya Karya
Beton or WTON, konstrusi service businesses, and (k) Unilever Indonesia or UNVR, distributor business.
3.3 The Definition and Measurement of Variables
The type of data collected from these companies are stock returns or Ri, return market or Rm and return free risk or
Rf.
(A) Return of shares or Ri, is the rate of return or income derived from each of the company's shares as a result of
changes in prices between the time or in every week as measured by calculation,
Ri = (Pit - Pit-1) / Pit-1
If the price happens (Pit) is greater than the price of the previous week (Pit-1), then there is a return or income, the
opposite occurs when the price of (Pit) lower than the previous week (Pit-1), then the negative returns or loss , On
the price difference divided by the price of the previous week (Pit-1), so that the quantity of stock returns (Ri).
(B) Return Rm market or obtained from the difference between the composite stock price index that occurred at
that time (IHSGt) with the composite share price index of the previous week (IHSGt-1). Positive difference shows
the income or return, otherwise the negative difference between the period showed a negative return or loss. Of the
difference is then divided by the composite stock price index the previous week (IHSGt-1), in order to obtain the
magnitude of the market return (Rm) which is depicted in the following formulation:
Rm = (IHSGit – IHSGit-1) / IHSGit-1
(C) Return Rf as free of risk or risk-free rate of return , in this case used the average deposit interest rate between
banks . The deposit rate is expressed in annual percentage , so as to obtain a weekly risk-free return , the percentage
of the split 52 or 52 weeks a year . Return free of risk or Rf formulated namely.
Rf = Return of risk free annual / 52
In the measurement of a relatively short period of time , then return free risk or risk-free rate of return tend to be
constant , but in the long term are likely to change .
4. Research and Discussion
4.1 Data Research
Based on the results of research on secondary data obtained from the Indonesia Stock Exchange through
www.invessmentworld / bei / prices / stock can be obtained and calculated the amount of stock return ( Ri ) , the
market return ( Rm ) and the risk free return ( Rf ) required for calculates coefficients beta stock ( Rm - Rf ) and
alpha (α) will be done using SPSS software version 22. research data were calculated using the method of
measurement as set forth in reseach and methodology referred to above with the following results
6. www.ccsenet.org/ijbm International Journal of Business and Management Vol. 10, No. 10; 2015
199
Source : Indonesia stock exchange (http://wwww.duniainvestasi.com/bei/prices/stock).
1). Estimation Model-1
The estimation results with SPSS 22: using Lintner models are loaded by Douglas ( 1968) as in Husnan (2009 ) ,
Rit = αi + βi Rmt + eit
Stock beta coefficient (β) and alpha (α) of the equation Model -1 above , can be seen on each company observed as
set forth in the following table:
Source : Indonesia stock exchange (http://wwww.duniainvestasi.com/bei/prices/stock).
-Lintner model implementation as table calculation results SPSS version 22 mentioned above, showing beta (β)
shares and alpha (α) as follows,
-Beta (β) shares the company's overall result was observed consistently positive, which means that the higher the
risk of the stock, the greater the possibility of obtaining a stock return (Ri).
-Beta (β) stock shows the magnitude of the changes that will occur in the stock return (Ri) when there is a change of
one unit in the variable (Rm - Rf).
-Value or quantity of Beta (β) shares, vary from one company to another company. This is mainly due to the
performance of the company and the company's operating conditions in the face of changes in the macroeconomic
environment or market that is reflected by the stock price index (CSPI). This can be seen in companies that have a
relatively high beta stocks than other companies such as Unilever (UNVR) distribsi sector, following Bank Negara
Indonesia 1946 (BBNI) banking sector, Kimia Farma (KAEF) pharmaceutical sector and Indonesia Astra
Year Market R Risk Free
2014 ASII BBCA BBNI GGRM HERO INDF KAEF PGAS SMCB WTON UNVR (Rm) (Rf)
02-Sep
10-Sep 0,00280 0,00296 0,00046 0,00079 0,00218 0,00014 0,00671 0,00025 0,00295 0,01688 0,00077 (0,01127) 0,00115
17-Sep 0,00006 0,00009 0,00003 0,00248 0,00067 0,00028 0,00005 0,00000 0,00004 0,00009 0,00053 0,00881 0,00115
24-Sep 0,00013 0,00030 0,00151 0,00032 0,00074 0,00002 0,00068 0,00005 0,00031 0,00062 0,00037 (0,00274) 0,00115
01-Okt 0,00084 0,00184 0,00232 0,00004 0,00000 0,00014 0,00071 0,00032 0,00191 0,00268 0,00020 (0,00640) 0,00115
08-Okt 0,00194 0,00172 0,00302 0,00002 0,00000 0,00137 0,01032 0,00095 0,00012 0,01069 0,00157 (0,03548) 0,00115
15-Okt 0,00211 0,00017 0,00214 0,00097 0,00145 0,00158 0,00585 0,00014 0,00051 0,00958 0,00026 0,00089 0,00115
22-Okt 0,00050 0,00070 0,00236 0,00040 0,00229 0,00111 0,00067 0,00020 0,00043 0,00383 0,00082 0,02245 0,00115
29-Okt 0,00235 0,00066 0,00020 0,00004 0,00152 0,00094 0,00101 0,00146 0,00290 0,00009 0,00090 (0,00004) 0,00115
05-Nov 0,00010 0,00047 0,00003 0,00684 0,00108 0,00004 0,02063 0,00003 0,00423 0,00125 0,00068 (0,00144) 0,00115
12-Nov 0,00042 0,00034 0,00087 0,00059 0,00050 0,00016 0,00118 0,00013 0,00001 0,00150 0,00004 (0,00355) 0,00115
Stock Return (Ri)
Stock Return (Ri), Market Return (Rm) dan Risk Free (Rf)
No. Code Company α β Rm R
2
1 ASII Astra Internasional -0,0043 1,240 0,287
2 BBCA BCA 0,012 0,724 0,121
3 BBNI BNI 0,0113 1,570 0,380
4 GGRM Gudang Garam 0,0094 0,198 0,006
5 HERO Hero Super Market 0,0037 0,969 0,176
6 INDF Indofood Super Market -0,0056 0,400 0,061
7 KAEF Kimia Farma 0,0108 2,674 0,292
8 PGAS Perusahaan Gas 0,0037 0,360 0,072
9 SMCB Semen Cibin (Holcim Indo) -0,0230 0,555 0,088
10 WTON Wijaya Karya Beton 0,0217 2,148 0,199
11 UNVR Unilever Indonesia -0,0008 1,231 0,507
Ri = α + βRm + ei
7. www.ccsenet.org/ijbm International Journal of Business and Management Vol. 10, No. 10; 2015
200
International (ASII) sector otomotive. Otherwise some companies are not sensitive to changes in its return when
there is a change in Rom as the company Gudang Garam (GGRM) and Business Process Gas cigarette sector
(PGAS) fuel sector. Beta stocks showed a relatively very small stock returns have changed very little when there is
a change in Rm. Such conditions can be stated that the company has an operational system performance and stable
business that are less affected to market changes, such as tobacco consumption and relatively stable gas on stable
economic conditions or crises. The risk is relatively small shares of the investor but it is less interesting, because
they expect return derived from changes in stock prices
- I- Alpha (α) shows the influence of other factors not accounted for in the study, so that in case the condition Rm
= 0, then the stock return (Ri) of alpha (α). In the econometric analysis model assumed that other factors constant
alpha (α) is expressed as a constant.
- The results of the above study showed the amount of alpha (α) is not consistent between one company with
another company. There are 4 companies that have a magnitude of alpha (α) which is negative as the company (a)
International Astra Indonesia (ASII) automotive sector, (b) Super Market Indofood (INDF) sector of foodstuffs, (c)
Cement Cibinong (SMCB) cement production, and (d) Unilever Indonesia (UNVR) distribution sector. While
other companies have a value of alpha (α) is positive.
- Alpha (α) value negative indicates that there are other factors that are not accounted for in market variables that
negatively affect stock return is concerned, and vice versa in case the value of alpha (α) is positive. Other variables
that are not accounted for in these models but have an influence on stock returns (Ri) among other fundamental
corporate performance appropriate operational condition, so although the market return (Rm) does not change,
then returns appropriate shares will receive the amount of alpha (α), and suffered losses when the value of alpha (α)
is negative.
- This model does not use the CAPM model as a whole because it ignores the return free risk factor (Rf) or just use
factor Rm, so the beta is generated possibility of a different result when compared to that using the CAPM model
(Rm - Rf) as independent variables
- 1. Estimation Model - 2
- The estimation results with SPSS 22: using the model Miller and Scholes (1972 ) in Husnan (2009 ) ,
- Rit = αt + βi ( Rmt- RFT ) + eit
- Stock beta coefficient (β) and alpha (α) from the equation model - 2 above , can be seen on each company
observed as set forth in the following table.
Source : Indonesia stock exchange (http://wwww.duniainvestasi.com/bei/prices/stock).
- Beta (β) observed overall stock company, the result was consistently positive, which means the higher the risk
more and more stock likely acquire stock returns. This is consistent with the Model - 1 above, which shares the
beta coefficient or positive and is equal between the Model-1 with Model-2. This happens because the risk free
return (Rf) value constant during the observation period. When changes or variations to the risk free return (Rf)
during the observation period coefficient or beta stocks will differ in value.
No. Code Company α β(Rm - Rf) R
2
1 ASII Astra Internasional -0,0029 1,240 0,287
2 BBCA BCA 0,013 0,724 0,121
3 BBNI BNI 0,0131 1,570 0,380
4 GGRM Gudang Garam 0,0097 0,198 0,006
5 HERO Hero Super Market 0,0048 0,969 0,176
6 INDF Indofood Super Market -0,0051 0,400 0,061
7 KAEF Kimia Farma 0,0139 2,674 0,292
8 PGAS Perusahaan Gas 0,0042 0,360 0,072
9 SMCB Semen Cibin (Holcim Indo) -0,0223 0,555 0,088
10 WTON Wijaya Karya Beton 0,0241 2,148 0,199
11 UNVR Unilever Indonesia 0,0006 1,231 0,507
Ri = α + β(Rm - Rf) + ei
8. www.ccsenet.org/ijbm International Journal of Business and Management Vol. 10, No. 10; 2015
201
- Alpha (α) obtained the same tendency with the model-1 above that the 3 companies that together have an alpha (α)
is negative, while the company Unilever Indonesia (UNVR) and other companies have value of alpha (α) is
positive. The value of alpha (α) is different than the Model-1 mainly because it takes into account the Model-2
return free risk factor (Rf) in measuring return market that expressed in (Rm-Rf).
- Model - 2 is not use Rf as a constant variable in the equation as the CAPM model:
Ri = Rf + βi (RMT + RFT) + eit
but using a model or equation:
Ri = α + βi (RMT + RFT) + eit
Supposedly relevant to the CAPM model are:
Ri - Rf = α + βi (RMT + RFT) + eit
Analyzes relevant to the CAPM model used on the Model - 3 below.
1. Estimation Model - 3
The estimation results with SPSS 22: using the model developed in the study Balck, Jensen, and Scholes (1972) as
in Husnan (2009),
Rit = RFT + βi (Rmt - RFT) + eit
For the econometric estimation for which data are available and the process of regression calculation, the
simplified models in the form of the following equation,
Rit - RFT = αi + βi (Rmt - RFT) + eit
Stock beta coefficient (β) and alpha (α) from the equation model - 3 above, can be seen on each company observed
as set forth in the following table.
Source : Indonesia stock exchange (http://wwww.duniainvestasi.com/bei/prices/stock).
- Beta (β) observed overall stock company, the result was consistently positive, which means the higher the risk the
greater the possibility of obtaining shares of stock return. This is consistent with the Models 1 and -2 above, the
beta coefficient, or positive stock and the value is the same, this is mainly due to the risk free return (Rf) of its
constant value during the observation period. When changes or variations to the risk free return (Rf) during the
observation period, the beta coefficient stock (β) will differ in value.
- The results of the above study showed the amount of alpha (α) is not consistent from one company to the other
company. There are 4 companies have a magnitude of alpha (α) is negative or equal to -1 Model, namely the
company (a) International Astra Indonesai (ASII) automotive sector, (b) Super Market Indofood (INDF) sector of
foodstuffs, (c) Cement cibinong (SMCB) and cement production (d) Unilever Indonesia (UNVR) distribution
sector. While other companies have a value of alpha (α) is positive.
No. Code Company α β(Rm - Rf) R
2
1 ASII Astra Internasional -0,0040 1,240 0,287
2 BBCA BCA 0,012 0,724 0,121
3 BBNI BNI 0,0120 1,570 0,380
4 GGRM Gudang Garam 0,0085 0,198 0,006
5 HERO Hero Super Market 0,0037 0,969 0,176
6 INDF Indofood Super Market -0,0063 0,400 0,061
7 KAEF Kimia Farma 0,0127 2,674 0,292
8 PGAS Perusahaan Gas 0,0030 0,360 0,072
9 SMCB Semen Cibin (Holcim Indo) -0,0235 0,555 0,088
10 WTON Wijaya Karya Beton 0,0230 2,148 0,199
11 UNVR Unilever Indonesia -0,0005 1,231 0,507
Ri - Rf = α + β(Rm - Rf) + ei
9. www.ccsenet.org/ijbm International Journal of Business and Management Vol. 10, No. 10; 2015
202
- Conclusion The comparison between the 3 models, it turns out there is no difference if it is used to estimate the
stock beta (β), so it can be stated that the 3 models have the same ability to measure the level of risk and stock
return (Ri).
- To see the excellence and relevance of measurements of beta (β) stock, then in this study developed a model
non-linear through the transformation of data into a quadratic Ln and as the Model- 4, Models - 5 and Models - 6
below.
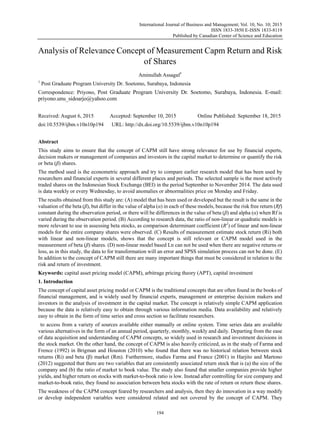
1. Estimation Model - 4
The estimation results with SPSS 22: Non Linear models in quadratic form , as follows ,
(Rit - RFT) 2 = αi + βi ( Rmt- RFT ) 2 + eit
Stock beta coefficient (β) and alpha (α) from the equation model - 4 above , can be seen on each company observed
as set forth in the following table.
Source : Indonesia stock exchange (http://wwww.duniainvestasi.com/bei/prices/stock).
Model-4 non-linear or quadratic shape, which is the development of Model-3 above. Non-linear model estimation
results indicate as follows,
- Coefficient, or beta (β) and constant or alpha (α) different from the results of the linear model simulation or
model-3.
- The value of beta (β) shares are not consistently positive as Model-3. There are 3 companies which had a beta
value of shares (β) is negative, the company (a) Gudang Garam (GGRM) with the tobacco industry or the beta
coefficient stock: -1.317, (b) Hero Supermarket (HERO) retail sector with a beta coefficient or stock: - 0.473, (c)
Cement Cibinong (SMCB) cement industry with a beta coefficient or stock: -1.178. While other companies have
a share beta coefficient (β) is positive as it did in Model-3, but different quantity or value.
- The value of beta (β) shares were negative indicates that the addition of a variable (Rm- Rf) would lead to a
decrease in stock returns (Ri) of beta (β) shares. This means that the stock returns negatively or inversely
proportional to the risk of the stock. Which means that the greater the risks faced, the smaller the stock return.
This is particularly relevant when compared with the company's business operations,
(A) Gudang Garam (GGRM) the tobacco industry, in the event of an increase in JCI is marked by the influence of
macroeconomic variables, the interest of investors to buy shares in the company is reduced, because the raw
materials are still the dominant cigarette industry uses imported components such as tobacco and others.
(B) Hero Super Market (HERO) retail business, JCI is not so encouraging increase in stock return (Ri) of this
company, because the components of the product resulting from a large number of goods sold still rely on imported
raw materials. As a result, the stock return (Ri) will tend to weaken if there is an increase or a composite stock price
index in Indonesia Stock Exchange Composite Index.
(C) Cement Cibinong (SMCB) cement industry, the increase in JCI weakening the stock return (Ri) is the cement
industry. This is mainly due to the consumption of cement in the country is much related to the progress of
No. Code Company α β(Rm - Rf) R
2
1 ASII Astra Internasional 0,0010 0,598 0,056
2 BBCA BCA 0,001 0,790 0,125
3 BBNI BNI 0,0009 1,659 0,391
4 GGRM Gudang Garam 0,0015 -1,317 0,070
5 HERO Hero Super Market 0,0011 -0,473 0,060
6 INDF Indofood Super Market 0,0004 0,736 0,262
7 KAEF Kimia Farma 0,0041 3,337 0,046
8 PGAS Perusahaan Gas 0,0003 0,428 0,145
9 SMCB Semen Cibin (Holcim Indo) 0,0016 -1,178 0,104
10 WTON Wijaya Karya Beton 0,0035 5,608 0,170
11 UNVR Unilever Indonesia 0,0004 0,856 0,657
(Ri - Rf)
2
= α + β(Rm - Rf)
2
+ ei
10. www.ccsenet.org/ijbm International Journal of Business and Management Vol. 10, No. 10; 2015
203
infrastructure construction. When turmoil macroeconomic variables that cause the JCI rises, then the impact will
affect the price of raw materials required by the construction, and it also means that demand for cement will be
affected. In the prediction of stock return (Ri) conducted by investors in the shares of the cement industry is going
to decline that caused the stock price does not go up and result in a stock return (Ri) decreases
The accuracy of the linear model (Model-3) and non- linear models (Model-4) can be determined by comparing the
R2
deteminand coefficients obtained between the two models mentioned above. Determinant coefficient shows
ability to explain the change in the dependent variable stock return (Ri) as a result of changes in market returns
independent variables and risk free return (Rm - Rf). The greater the value of the determinant coefficient (R2
)
shows the better the model. Based on this view and pay attention determinant coefficient (R2
) of each company of
the 2 models in question, it can be concluded that the non- linear models or model - 4 is more relevant to use in
measuring the beta value of the company.
1). Estimation Model -5
Assessment of beta stocks as non linear models developed by Husnan (2009),
Rit Ln = Ln Ln αi + βi Rmt + eit
This model can not be used because the data available there is a negative return or loss, so the process was not
carried out due to an error preformance transformation into value Ln, so that can not be processed through
SPSS seftware. Ln non-linear models can be used when a data field is available change or are non-negative or
positive returns or losses.
2). Estimation Model - 6
Beta assessment of other stocks, as the development of studies Balck, Jensen, and Scholes (1972) as in Husnan
(2009) but using a non-linear models as follows,
Ln (Rit - RFT) = Ln Ln αi + βi (Rmt - RFT) + eit
Model-6 is the same as the Model-5, the available data can not be processed by Ln because negative returns or
loss will occur error when transformed into value Ln. Ln non-linear models can be used when a data field is
available change or are non-negative or positive returns or do not experience a loss.
5. Conclussion and Limitation Study
5.1 Conclussion
Based on the description above, can be summarized as follows:
1). Assessment of beta (β) stock produce the same figures for the use of Model 1, Model 2 and Model-3 because
the risk free return (Rf) constant during the observation period. If there is variation in the risk free return (Rf)
during the observation period, the stock beta (β) will differ among the 3models mentioned.
2). The constant or alpha (α) differ between Model 1, Model 2 and Model-3 because there is a different treatment to
retrun free risk indicators (Rf), namely (a) Model-1 does not use return free risk (Rf), (b) Model-2 using a risk
Code Model -3 Model -4 Diff
ASII 0,287 0,598 0,310
BBCA 0,121 0,790 0,669
BBNI 0,380 1,659 1,279
GGRM 0,006 -1,317 -1,324
HERO 0,176 -0,473 -0,648
INDF 0,061 0,736 0,675
KAEF 0,292 3,337 3,046
PGAS 0,072 0,428 0,356
SMCB 0,088 -1,178 -1,266
WTON 0,199 5,608 5,409
UNVR 0,507 0,856 0,349
COEFFICIENT DETERMINAND (R
2
)
11. www.ccsenet.org/ijbm International Journal of Business and Management Vol. 10, No. 10; 2015
204
free return (Rf) only independent variable (Rm - Rf), (c) Model-3 using a risk free return (Rf) on stock return
(Ri - Rf) and the market return (Rm-Rf)
3). Comparison of linear and non-linear models showed that non-linear or quadratic superior and more relevant use
in estimating beta stocks. This is evidenced in the determinant coefficient (R2
) which obtained the larger
number of non linear model for the entire company that was observed during the period.
4). The results of the estimation of measurement stock return (Ri) both with linear and non-linear models, shows
that the concept or CAPM model is still relevant in measuring the beta (β) shares. Selection of the best models
and relevant in measuring the beta (β) stock, is dependent on the distribution of the data and suitability in the
selection of a good model of linear and non-linear.
5). The non-linear model with base Ln can not be used in this study because there are negative returns or loss,
resulting in an error when transformed into value Ln, and can not be done with SPSS simulation process.
Non-linear models Ln base on Model-5 and Model-6 can be used in other studies when the data in the form of
a positive return or no loss.
5.2 Limitation Study
In the implementation of the capital asset pricing model, or CAPM, experts in finance, management or decision
makers in the company and investors, should be aware of the limitations of the predictive ability of the risk and the
return generated by the CAPM model. There are several other important matters related to risk and stock return.
This is relevant with a view Husnan (2009) related to matters associated with risk and stock return. The important
thing in question is (a) there is a relationship between risk with return or return on investment, (b) diversification is
very important in reducing the level of risk without reducing the level of return, (c) return or refund is real
important things in investments, and contrast with the return nominal, (d) the risk of investment is usually
influenced by the duration period of an investment, which in the short term the possibility of such shares in the
long-term risk but the risk is relatively low, and (e) there is no guarantee that the past will be repeated in the future,
especially when associated with risk and investment returns of the past.
References
Agus, H. M. (2012). Financial management. Publisher Ekonisia.Yogyakarta
Agus, H., & Martono. (2012). Financial Management. Publisher Ekonisia. Yogyakarta
Aminullah, A. (2011). Financial Management-Concepts and Applications. Smart Media Publisher.
Sidoarjo-Surabaya.
Aminullah, A. (2011). Financial Management-Concepts and Intelligent Media Aplikasi. Publisher.
Sidoarjo-Surabaya.
Aminullah, A. (2013a). Econometrics-SPSS applications. Smart Media Publisher. Sidoarjo-Surabaya.
Aminullah, A. (2013b). Ekonometrika – Aplikasi SPSS. Penerbit Media Cerdas.Sidoarjo-Surabaya.
Arthur J. K., John, D., Martin, J., William, P. D. F., & Scott, J. R. (2010). Financial Management-Principles and
Application. Publisher PT. PT index. Jakarta.
Arthur, J. K., John, D. M., William, P. J., David, F., & Scott, J. R. (2010). Financial Management Principles and
Application. publisher PT Indeks. Jakarta.
Bambang, R. (2008a). Basics Company Spending. Publisher BPFE. Yogyakarta.
Bambang, R. (2008b). Basics Spending Companies. publisher BPFE. Yogyakarta.
Darmawan, S. (2010). Financial Management. Publisher Partners Media Discourse. Jakarta.
Eugene, F. B., & Joel, F. H. (2014). Basics of Financial Management. Essentials of Financial Management.
Publisher Salemba Emat. Jakarta.
Eugene, F., Brigham, D., & Joel, F. H. (2014). Basics of Financial Management. Essentials of Financial
Management. Penerbit Salemba Four. Jakarta.
Ganjar, C. P., & Mohammad, M. C.(2004). Option Capital Asset Pricing Model (CAPM) and Arbitrage Pricing
Theory (APT) Return on Acurasi Impredicting Stock Manufacturing Industry Before and During Economic
Crisis. Social Dynamics Research Journal, 5, 125-139.
Ganjar, C., Premananto, D., & Muhammd, M. (2004). Comparation Option Capital Asset Pricing Model (CAPM)
and Arbitrage Pricing Theory (APT) Acurasi Impredicting Stock Return on Manufacturing Industry Before
12. www.ccsenet.org/ijbm International Journal of Business and Management Vol. 10, No. 10; 2015
205
and During Economic Crisis. Dynamics Research Journal Social, 5(2), 125-139.
Isnurhadi. (2014). Analysis Model CAPM In Predicting Stock Return Rate Shariah and Conventional (Case
Study in Indonesia Stock Exchange). Scientific Journal of Applied Business Management, 11(1).
Lecturer Faculty of Economics, University of Sriwijaya
Isnurhadi. (2014). Analysis of CAPM Model In Predicting Stock Return Rate Shariah and Conventional (Case
Study in Indonesia Stock Exchange). Scientific Journal of Applied Business Management.
Jeffrey, M. W. (2006). Introductory Econometrics-A Modern Approach. South Western Cengage Learning.
Michigang State University. United State.
Kasmir. (2009). Introduction to Financial Management. Publisher Kencana Pranada Media Group. Jakarta.
Musdalifah,A. (2009). Analysis on Capital Asset Pricing Model (CAPM) and Arbtrage Pricing Theory (APT) in
Predicting Stock Return of Manufacture Industry Listed In Indonesia Stock Exchange. UNHAS Graduate
Program. Makassar.
Ni, K., Ayu, S., & Made, M. I. (2013). Comparison of CAPM with APT in Predicting Stock Return. Jurna code:
Jpakuntansidd130493, Jpakuntansi2013.
Sparta. (2010). Analysis of CAPM, APT, Monday Effect and Efficiency of Capital Markets in Financial Sector in
BEI (period from January to June 2010). Journal of Finance and Banking, 7(1).
Sri, D. A. A. (2010). Advanced Financial Management. Graha Science Publishers. Yogyakarta.
Suad, H. (2009). Portfolio Theory foundations and Aanalisis Securities. Publishers and Printing Unit School of
Management YPKN. Yogakarta.
Suad, H. (2010). Financial Management-Theory and Application (Long-Term Decision). Publisher BPFE.
Yogyakarta.
Suad, H., Enny, P., & Dasar, D.(1998). Financial Management. Publisher UPP AMP YPKN. Yogyakarta.
Sutrisno. (2012). Financial Management - Theory and Applications. Publisher Ekonisia. Faculty of Economics of
UII. Yogyakarta.
The World Investment-Indonesia Stock Exchange data. (2008-2015). Stock Price Data Indonesia Stock Exchange.
Jakarta. Retrieved from http://www.duniainvestasi.com/bei/
Copyrights
Copyright for this article is retained by the author(s), with first publication rights granted to the journal.
This is an open-access article distributed under the terms and conditions of the Creative Commons Attribution
license (http://creativecommons.org/licenses/by/3.0/).