1. www.sfaresearch.com
www.sfaresearch.com
Disclaimer: This report has been prepared by SFA. The information and opinions contained herein have been compiled or arrived at based upon information obtained from sources believed to be reliable and in good faith. Such
information has not been independently verified and no guaranty, representation or warranty, express or implied is made as to its accuracy, completeness or correctness. All such information and opinions are subject to change without
notice. This document is for information purposes only. Descriptions of any company or companies or their securities mentioned herein are not intended to be complete and this document is not, and should not be construed as, an
offer, or solicitation of an offer, to buy or sell any securities or other financial instruments. SFA may, to the extent permissible by applicable law or regulation, use the above material, conclusions, research or analysis before such
material is disseminated to Public. This document may not be reproduced, distributed or published for any purposes.
Synergistic Financial Advisors Research
Weekly Market Review
Market Summary
Despite healthy corporate result announcements and the amendments to the capital
gains tax regime, volumes were particularly lower on a WoW basis. Contrary to last
week, there was limited flurry of activity as investors remained cautious waiting on
further confirmations from the Ministry of Finance on the materialization of the CGT
regime. The news surrounding the Supreme Court’s hearing on charging the Prime
Minister also was reflective in cautious trading. Resultantly, mixed investor sentiment
was evident throughout the week as average daily volumes declined by 36.8 percent to
91.76 million shares as compared to previous week's 145.24 million shares.
While the market gained 100 points WoW; market capitalization increased by PKR 11
billion to PKR 3.12 trillion. The index closed at 11,983 on Friday gaining 53 points in the
last trading session. On Friday, a total of 149 stocks gained, 82 lost and 78 were
unchanged. Top sectors included Financial Services, Chemicals and Personal Goods with
JSCL, ENGRO and ANL as the top gainers within these sectors. JSCL was the volume
leader with 33.10 million shares gaining PKR 0.69 to close at PKR 7.46. ENGRO was the
fifth in terms of volume traded with 4.85 million shares, losing PKR 0.03 to close at Rs
122.04. FFC traded 3.02 million shares losing PKR 1.91 to close at Rs 182.77.
Highlights
PKR 17.50 in dividends and soaring profits for Pakistan Oil Fields – POL posted a higher
PAT which stood at PKR 6.17 billion for HY12 with an interim cash dividend of PKR 17.50
per share. The pre-tax profit jumped to Rs 9.39 billion compared to PKR 7.15 billion in
the corresponding period in 2010. EPS jumped to PKR 26.08 during HY12 compared to
PKR 21.99 in the same period last year.
Pakistan’s Debt Standing – The Debt Policy Statement issued by the Ministry of Finance
total debt stood at PKR 10,996 billion for 1QFY12 which rose by 2.7%. Total public debt
as a percentage of GDP was reported at 52.6% for 1QFY12 from 59.3% during FY11. This
quarter witnessed a massive retirement of PKR 104 billion in the stock of central bank
borrowing. The instruments under the NSS umbrella contributed approximately PKR 45
billion to the total stock of domestic debt within Pakistan. Notably, funds raised through
the NSS contribute 28 percent to total domestic debt. The country’s External Debt and
Liabilities (EDL) stock was recorded at USD 60.1 billion as of June 30, 2011, resulting in a
growth of 8.1 percent. This increase was due to a depreciation of US Dollar against other
major international currencies. Pakistan’s external debt and debt servicing in terms of
foreign exchange earnings stood at 1.3 times and 11.4 percent during 2010-11 as
compared to 1.5 times and 16.5 percent, respectively in 2009-10. In addition, repayment
of the IMF tranche is further expected to pressurize external debt servicing.
Economic Highlights – Supported by a boost in commercial banks’ reserves; in the week
ending on 27 Jan 12, FOREX reserves rose marginally to USD 16.87 billion from USD
16.80 billion in the previous week. Reserves held by commercial banks rose to USD 4.35
billion compared to USD 4.25 billion in the previous week.
The SBP Governor stated that inflationary pressures will continue to persist during FY13
as the government is braced with the challenge of meeting federal revenue targets,
which could eventually raise government borrowing.
Our Picks for the Week – Our top five scrips based on dividend yields are NBP, PTC, INIL,
SEPL and FFBL with D/P of 16.96, 15.16, 14.58, 13.48 and 13.05 respectively.
Future Outlook
Going forward, investor behaviour will be subject to the uncertainty surrounding the Supreme Court’s hearing for the Prime Minister upon
him being summoned to court on Feb 13. The IMF is expected to review Pakistan’s economic situation in the days ahead and Feb 11 is to
witness a monetary policy review meeting in which it is expected that the status quo is to be maintained on account of persistently weak
fiscal and external accounts. We anticipate hefty payouts including dividend payments to be announced in several sectors which will
contribute to enhancing momentum in the market. In addition, the actual implementation of the CGT regime will prove to be the catalyst in
the days ahead.
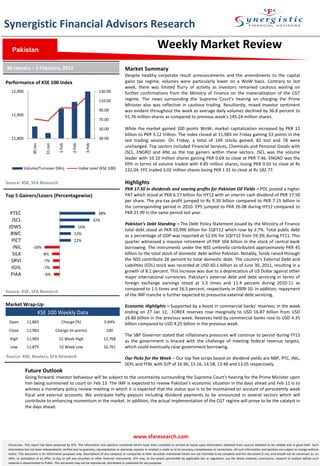
Performance of KSE 100 index
Source: KSE, SFA Research
Top 5 Gainers/Losers (Percentagewise)
Source: KSE, SFA Research
Market Wrap-Up
KSE 100 Weekly Data
Open 11,883 Change (%) 0.84%
Close 11,983 Change (in points) 100
High 11,983 52 Week High 12,768
Low 11,875 52 Week Low 10,761
Source: KSE, Reuters, SFA Research
30.00
50.00
70.00
90.00
110.00
130.00
11,800
11,900
12,000
30-Jan
31-Jan
1-Feb
2-Feb
3-Feb
Volume/Turnover (Mn) Index Level (KSE 100)
38%
32%
16%
12%
12%
-16%
-8%
-7%
-7%
-6%
PTEC
JSCL
JDWS
BWC
PICT
INIL
SILK
SRVI
IGIIL
PIAA
Pakistan
30 January – 3 February, 2012
2. www.sfaresearch.com
www.sfaresearch.comDisclaimer: This report has been prepared by SFA. The information and opinions contained herein have been compiled or arrived at based upon information obtained from sources believed to be reliable and in good faith. Such
information has not been independently verified and no guaranty, representation or warranty, express or implied is made as to its accuracy, completeness or correctness. All such information and opinions are subject to change without
notice. This document is for information purposes only. Descriptions of any company or companies or their securities mentioned herein are not intended to be complete and this document is not, and should not be construed as, an
offer, or solicitation of an offer, to buy or sell any securities or other financial instruments. SFA may, to the extent permissible by applicable law or regulation, use the above material, conclusions, research or analysis before such
material is disseminated to Public. This document may not be reproduced, distributed or published for any purposes.
Synergistic Financial Advisors Research
Investor Type Buy Volume Buy Value Sell Volume Sell Value Net Volume Net Value (PKR) Amount in USD
Foreign Individual 35,150 1,277,519 (94,350) (1,187,000) (59,200) 90,518 1,006
Foreign Corporates 1,060,617 120,099,251 (5,124,291) (206,890,456) (4,063,674) (86,791,204) (964,347)
Overseas Pakistani 1,068,742 1,068,742 1,068,742 1,068,742 1,068,742 1,068,742 1,068,742
Total 2,468,167 2,468,167 2,468,167 2,468,167 2,468,167 2,468,167 2,468,167
Source: NCCPL
Foreign Investors Portfolio Investment
Global Markets
Americas, Asia Pacific Europe, Africa, Middle East
Index Open Closing
Change in
Points
Change in
Percentage Index Opening Closing
Change in
Points
Change in
Percentage
DJIA 12,660.50 12,862.20 201.70 1.59% Euro Stoxx 50 2,436.62 2,515.15 78.53 3.22%
S&P 500 1,316.33 1,344.90 28.57 2.17% FTSE 100 5,733.45 5,901.07 167.62 2.92%
NASDAQ Composite 2,816.55 2,905.66 89.11 3.16% CAC 40 3,318.76 3,427.92 109.16 3.29%
S&P/TSX Composite 12,466.50 12,577.30 110.80 0.89% DAX 6,511.98 6,766.66 254.68 3.91%
NIKKEI 225 8,841.22 8,831.93 -9.29 -0.11% IBEX 35 8,657.30 8,861.20 203.90 2.36%
HANG SENG 20,501.70 20,757.00 255.30 1.25% SWISS Market 6,033.52 6,153.31 119.79 1.99%
TOPIX 761.13 760.69 -0.44 -0.06% QE 8,434.70 8,636.37 201.67 2.39%
CSI 300 2,504.09 2,506.09 2.00 0.08% DFM GI 1,405.82 1,435.96 30.14 2.14%
Source: Bloomberg Source: Bloomberg
Global Data
30 January – 3 February, 2012
8,300
8,360
8,420
8,480
85
95
105
115
9-Jan 14-Jan 19-Jan 24-Jan 29-Jan 3-Feb
Brent Crude (USD/bbl) WTI Crude (USD/bbl) Copper USD/Ton
33
34
35
36
1,730
1,740
1,750
1,760
30-Jan 31-Jan 1-Feb 2-Feb 3-Feb
GOLD (USD/Ounce) SILVER FUTURE (USD/Ounce)
Economic Data Money Market FOREX Commodity Prices
Economic Data Metric
Period of
Measurement Amount Tenor Bid Offer Currency Buy (PKR) Sell (PKR) Energy
GDP PKR in Mn FY11 18,062,901 1 - Week 11.52 12.02 USD 90.40 90.80 BRENT CRUDE FUTR (USD/bbl.) 114.58
Per Capita Income PKR FY11 107,505 2 - Week 11.53 12.03 CAN 89.90 90.90 WTI CRUDE FUTURE (USD/bbl.) 97.84
M1 PKR in Mn 11-Nov 4,915,575 1 - Month 11.52 12.02 EUR 118.20 119.40 Precious Metals
M2 PKR in Mn 11-Nov 6,651,663 3 - Month 11.54 11.79 GBP 142.50 144.00 GOLD 100 OZ FUTR (USD/t oz.) 1,740.30
Exports USD in Mn Jul-Dec, FY12 11,237 6 - Month 11.58 11.83 AUD 96.00 97.00 SILVER FUTURE (USD/t oz.) 33.75
Imports USD in Mn Jul-Dec, FY12 22,713 9 - Month 11.62 12.12 JPY 1.18 1.19 Industrial Metals
Balance of Trade USD in Mn Jul-Dec, FY12 (11,476) 1 - Year 11.66 12.16 HKD 11.10 11.80 COPPER FUTURE (USD/lb.) 390.15
Current Account USD in Mn Jul-Dec, FY12 (2,154) 2 - Year 11.75 12.25 SAR 24.00 24.35 Agriculture
Capital Account USD in Mn Jul-Dec, FY12 70 3- Year 11.84 12.34 AED 24.52 24.92 COTTON NO.2 FUTR (USD/lb.) 96.34
Domestic debt PKR in Bn 30-Nov-11 6,779 SOYBEAN FUTURE (USD/bu.) 1,232.50
External debt USD in Mn 30-Sep-11 46,372 WHEAT FUTURE(CBT) (USD/bu.) 660.75
Foreign Currency Reserve USD in Mn 30-Dec-11 12,799 CORN FUTURE (USD/bu.) 644.5
Source: SBP, FBR Source: www.forex.com.pk Source: BloombergSource: SBP