1. ASIAN INSIGHTS VICKERS SECURITIES
sa- AH
Star Wars quotes that can describe
2017 critical market factors
• Ten critical factors will drive relative share
price performance in 2017
• We like China banks, oil, telecom, non-bank
financials, and HK & global banks
• Our top picks are Angang, BOC, China Life,
China Unicom, CNOOC, HSBC, Kingsoft,
Nameson, Tencent, and Value Partners
Sorry for the delay. I planned to work on this report over the
holidays, but I ended up watching all Star Wars episodes to
commemorate Carrie Fisher. One takeaway from my binge
watching was finding Star Wars quotes that can describe
some of 2017’s critical market factors:
“I felt a great disturbance in the Force, as if millions of
voices suddenly cried out in terror and were suddenly
silenced.” –Obi Wan. Millions of US Democrats were
shocked last Nov. We may see a similar shock if Euroskeptic
parties win in key European elections. Expect more CNY
depreciation pressure if Euro’s viability is questioned.
“Join me, and together we can rule the galaxy as father
and son” –Darth Vader. Donald Trump popped into my
head for some reason. Trump’s policies will be a critical
factor for HK. We flag some stock impacts from Trump’s
reflation policies and potential Sino-US relation changes.
“There is good in him. I’ve felt it” –Luke. Maybe Trump
won’t be that bad. Policy clarity can ease overhang later on.
“Ten thousand? We can almost buy our own ship with
that” –Luke. Luke balked at Han Solo’s fee quote. We also
expect wages to rise in the real world, as US labour
participation is close to full recovery. We foresee a hawkish
Fed and prefer lenders over borrowers.
“The force is strong with this one” –Darth Vader. We
expect USD to remain strong. This can hurt HK and Macau’s
competitiveness as tourist destinations among other things.
“May the force be with you” –Obi Wan. We all need the
force after declining AUM and trading volumes in 2016. We
hope our stock and sector picks can help, and they are
summarized on pages 3-4. Happy New Year!
HSI: 22,457
ANALYST
Alexander LEE CFA, +852 2971 1930
alexander_lee@dbs.com
Ian CHUI
ianchui@dbs.com
China/Hong Kong Research Team +852 2820 4888
hkresearch@hk.dbsvickers.com
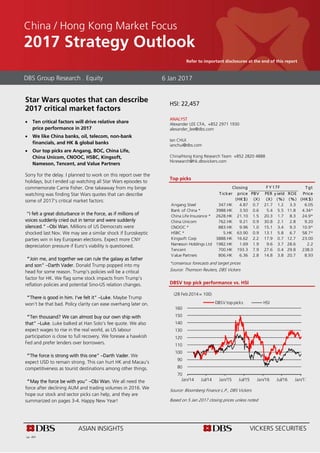
Top picks
Closing T gt
Ticker price PBV PER y ield ROE Price
(HK$) (X) (X) (%) (%) (HK$)
Angang Steel 347.HK 4.87 0.7 21.7 1.2 3.3 6.05
Bank of China * 3988.HK 3.50 0.6 5.4 5.5 11.8 4.34*
China Life Insurance * 2628.HK 21.10 1.5 20.3 1.7 8.3 24.9*
China Unicom 762.HK 9.21 0.9 30.8 2.1 2.8 9.20
CNOOC * 883.HK 9.96 1.0 15.1 3.4 9.3 10.9*
HSBC * 5.HK 63.90 0.9 13.1 5.8 6.7 58.7*
Kingsoft Corp 3888.HK 16.62 2.2 17.9 0.7 12.7 23.00
Nameson Holdings Ltd 1982.HK 1.69 1.9 9.6 3.7 28.6 2.2
Tencent 700.HK 193.3 7.9 27.6 0.4 29.8 238.0
Value Partners 806.HK 6.36 2.8 14.8 3.8 20.7 8.93
F Y17F
*consensus forecasts and target prices
Source: Thomson Reuters, DBS Vickers
DBSV top pick performance vs. HSI
70
80
90
100
110
120
130
140
150
160
Jan/14 Jul/14 Jan/15 Jul/15 Jan/16 Jul/16 Jan/17
DBSV top picks HSI
(28 Feb 2014 = 100)
Source: Bloomberg Finance L.P., DBS Vickers
Based on 5 Jan 2017 closing prices unless noted
DBS Group Research . Equity 6 Jan 2017
China / Hong Kong Market Focus
2017 Strategy Outlook
Refer to important disclosures at the end of this report
2. Market Focus
2017 Strategy Outlook
Page 2
Hong Kong Research T eam
Head of Research, China Property
Carol Wu (852) 2863 8841
carol_wu@dbs.com
Market Strategy
Alexander Lee, CFA (852) 2971 1930
alexander_lee@dbs.com
Ian Chui
ianchui@dbs.com
A utomobile, Infrastructure, Machinery
Rachel Miu (852) 2863 8843
rachel_miu@dbs.com
Keith Tsang
keith_tsang@dbs.com
Basic materials, Clean energy (wind power, nuclear)
Addison Dai (852) 2971 1931
addisondai@dbs.com
China Property
Danielle Wang, CFA (852) 2820 4915
danielle_wang@dbs.com
Ken He, CFA (86) 21 6888 3375
ken_he@dbs.com
Andy Yee, CFA (852) 2971 1773
andyyee@dbs.com
Trista Qin (852) 2863 8820
trista_qin@dbs.com
Consumer
Mavis Hui (852) 2863 8879
mavis_hui@dbs.com
Alice Hui, CFA (852) 2971 1960
alicehuism@dbs.com
Eric Yee, CFA (86) 21 6888 3360
eric_yee@dbs.com
Alison Fok (852) 2971 1938
alisonfok@dbs.com
Env ironmental, Industrial
Patricia Yeung (852) 2863 8908
patricia_yeung@dbs.com
Healthcare
Mark Kong, CFA (852) 2820 4619
mark_kong@dbs.com
Hong Kong Property
Jeff Yau, CFA (852) 2820 4912
jeff_yau@dbs.com
Small Mid Caps
Dennis Lam (852) 2971 1922
dennis_lam@dbs.com
Chris Ko, CFA
chriskof@dbs.com
Tony Wu, CFA
tonywuh@dbs.com
Telecom/Media/Tech
Tam Tsz-Wang, CFA (852) 2971 1772
tszwangtam@dbs.com
Susanna Chui (852) 2820 4611
susanna_chui@dbs.com
Table of Contents
Investment summary 3
Critical factor: Rising USD interest rates 5
Critical factor: Populist movements in Europe 8
Critical factor: USD strength 10
Critical factor: CNY depreciation 11
Critical factor: HK/China property tightening 14
Critical factor: Rising China bond yields 18
Critical factor: Trump policies 20
Critical factor: Reflation trend 21
Critical factor: MSCI review of A-shares 22
Critical factor: Earnings recovery from low base24
Sector weighting recommendations 29
Sector valuations vs. market valuations 33
Top picks 36
Market outlook and valuations 39
Sector outlooks from the team 42
Stock profiles of covered top ten BUYs 56
Appendix: Best EPS revisions among index stocks
in 4Q in HKD terms 62
Appendix: Worst EPS revisions among index
stocks in 4Q in HKD terms 66
Appendix: Sector performance relative to the HSI
(laggards) 69
Appendix: Sector performance relative to the HSI
(outperformers) 71
Appendix: Sector performance relative to the HSI
(others) 73
Appendix: DBSV universe comparison table 77
3. Market Focus
2017 Strategy Outlook
Page 3
Investment summary
Eight sectors are better positioned. We recommend to be
overweight in China banks, China telecom operators, HK &
global banks, oil, and China non-bank financials. We also have
a positive bias for China materials, IT & software, and railway &
construction. These eight sectors are better positioned for ten
critical factors that will drive 2017 relative share price
performance: 1) rising USD interest rates and bond yields, 2)
populist movements in Europe, 3) USD strength, 4) CNY
depreciation, 5) HK/China property tightening measures, 6)
rising China bond yields, 7) Donald Trump policies, 8) global
reflation trend, 9) MSCI A-share review, and 10) low base
earnings growth recovery for some sectors. We summarize each
factor’s impacts below, with more details available on pages 5
to 28.
Summary of ten critical factors and their impacts to sectors
Critical driv ers Comments Sector / stock impacts
Positive: HK banks (BOCHK 2388.HK, HSB 11.HK, DSBG 2356.HK)
Positive: global banks (HSBC 5.HK, SCB 2888.HK)
Negative: REITS (Link 823.HK, Champion 2778.HK)
Negative: HK property (SHKP 16.HK, Henderson Land 12.HK)
Negative: HK utilities (CLP 2.HK, HK & China Gas 3.HK)
Positive: Paper (ND Paper 2689.HK) as some COGS are sourced from Europe
Negative: Companies with European revenues (HSBC 5.HK, Esprit 330.HK, CKI
1038.HK, CK Hutch 1.HK, Prada 1913.HK)
USD strength Negative: HK Retail (Sa Sa 178.HK, Luk Fook 590.HK, CSS 116.HK)
Negative: Macau gaming (Galaxy Ent 27.HK, Sands China 1928.HK)
CNY depreciation Positive: Exporters to the US (Techtronics 669.HK, Man Wah Holdings
1999.HK, Shenzhou 2313.HK)
Positive: Popular Connect stocks (Big 4 banks, Tencent 700.HK, HSBC 5.HK)
Positive: HK subsidiaries of China brokers (Haitong Int 665.HK, GTJA 1788.HK)
Negative: HK Retail (Sa Sa 178.HK, Luk Fook 590.HK, CSS 116.HK)
Negative: Macau gaming (Galaxy Ent 27.HK, Sands China 1928.HK)
Negative: Chinese companies with foreign debt
Positive: Other investment asset classes
Negative: HK Retail (Luk Fook 590.HK, CSS 116.HK, Lifestyle 1212.HK)
Negative: Macau Gaming (Galaxy Ent 27.HK, Sands China 1928.HK)
Positive: China insurance (China Life 2628.HK, Ping An 2318.HK)
Positive: China banks (CCB 939.HK, BOC 3988.HK)
Negative: High gearing companies with Rmb debt
Positive: HK banks (BOCHK 2388.HK, HSB 11.HK, DSBG 2356.HK)
Positive: global banks (HSBC 5.HK, SCB 2888.HK)
Positive: Metals (Angang 347.HK, Jiangxi Copper 358.HK)
Positive: Companies that compete with US brands in China
Negative: Exporters to the US (Techtronics 669.HK, Man Wah Holdings
1999.HK, Shenzhou 2313.HK)
Negative: Sino-US JVs (SAIC 600104.CH, ChangAn Auto 000625.CH)
Positive: Oil and Energy (CNOOC 883.HK, PetroChina 857.HK)
Positive: Metals (Angang 347.HK, Jiangxi Copper 358.HK)
Negative: Airlines (China East Air 670.HK, China Southern Air 1055.HK)
Negative: Companies with commodity COGS that cannot be passed on
Positive: China brokers (Citic Sec 6030.HK, CICC 3908.HK)
Positive: China insurance (China Life 2628.HK, Ping An 2318.HK)
Negative: H-shares in general due to weighting decline
Positive: China brokers (Citic Sec 6030.HK, CICC 3908.HK)
Positive: China insurance (China Life 2628.HK, Ping An 2318.HK)
Positive: Oil and Energy (CNOOC 883.HK, PetroChina 857.HK)
Positive: China Telecom (Unicom 762.HK, China Mobile 941.HK)
Positive: Macau Gaming (Galaxy Ent 27.HK, Sands China 1928.HK)
We expect China bond yields to
trend up
Rising China bond
y ields
House 2017 CNY target is 7.19;
recent CNY basket may help
slightly
We expect 4 Fed rate hikes and
10 year Treasury yield to hit
3.7%
Rising USD interest
rates
We expect Euro weakness if
populist parties win in European
elections
Populist mov ements
in Europe
Driven by economic recovery
and reflation
Property tightening
measures in HK/China
Negative wealth effect. Other
asset classes increase in relative
appeal.
Earnings recov ery
from low base
Several large cap sectors can see
earnings recovery from a low
base
Reflation trend Driven by supply control and
infrastructure spending
Trump policies Proposed tax cuts and fiscal
spending are inflationary.
Potential trade war with China.
We forecast a 70% chance for
MSCI to include A-shares in its
June review
MSCI A -share
inclusion
Source: Bloomberg Finance L.P., DBS Vickers
4. Market Focus
2017 Strategy Outlook
Page 4
Cautious on borrowers, commodity users, and property related
areas. Given the above ten critical factors, we prefer lenders
over borrowers. We also prefer reflationary plays over
companies that cannot pass on commodity costs. We also fear
de-rating for stable dividend or cash streams as risk-free rates
rise. We are also wary of property’s appeal as an investment
class. Hence we recommend to be underweight in airlines,
China property, HK property, HK REITs, and HK telecom.
Multiple changes to our sector weightings. Our updated sector
ranking can be found on page 31, while our sector analyst
comments can be found on pages 42 to 55. We have upgraded
China banks, telecom operators, railway & construction, China
power producers, and telecom equipment, but have
downgraded IT & software, apparel & sportswear, gaming, HK
retail, healthcare, and airlines. Expected critical factors largely
drive our sector ratings. However, we have also factored in
relative sector valuations against the market (pg 33), sector
valuations vs. ROE and earnings outlooks (pg32), relative sector
performance vs. the HSI (pg 69), earnings revision trends of
index stocks (pg 62), and sector allocation trends of large China
and Greater China focused funds.
Financials, telecom, and energy are underowned, but can
turnaround with right catalysts. We compiled cash and sector
allocation trends from China and Greater China focused funds
with a total AUM of around US$25bn. The funds in our radar
have been lowering cash positions from Brexit to October, but
cash positions are increasing since November. Meanwhile, these
funds have also increased allocation to financials, industrials,
and consumer staples (pg 30). On the other hand, IT, consumer
discretionaries, telecom, utilities, and real estate have seen
allocation declines. Compared to MSCI China’s weightings,
these funds were underweight in financials, telecom, and
energy but overweight in consumer and healthcare. We believe
the underweight sectors have potential to see better fund flows
as their earnings outlooks improve in 2017.
Adding BOC, Tencent, and Angang to top picks. Our top picks
to start the year are Angang Steel (347.HK), BOC (3988.HK),
China Life (2628.HK), China Unicom (762.HK), CNOOC
(883.HK), HSBC (5.HK), Kingsoft (3888.HK), Nameson
(1982.HK), Tencent (700.HK), and Value Partners (806.HK). We
have added BOC as our China banking pick. BOC is better
positioned than peers for rising USD interest rates and CNY
depreciation. We also added Angang as a reflation and SOE
reform play. In addition, we are adding Tencent back to our
picks after the stock’s correction in 4Q16. To make room for the
new additions, we have taken out GF Securities (1776.HK), Li
Ning (2331.HK), and Xinjiang Goldwind (2208.HK).
HSI target of 24,600. We expect a choppy start to 2017, as CNY
depreciation, Trump policy uncertainty, USD strength, and a
more hawkish Fed remain as overhangs. But we expect Hong
Kong equities to do well over the course of 2017. Market
earnings should be growing again in 2017 after declining by
~25% during 2015-2016. Earnings growth recovery will be
driven by China non-bank financials, oil, materials, Macau
gaming, and China telecom, thanks to low bases and reflation.
Property tightening measures can also enhance equities’ relative
appeal as an investment class. Meanwhile, valuations are still
low (pg 40). Our 2017 HSI target is 24,600 (11.5x PE), while our
HSCEI target is 10,900 (8.6x PE).
5. Market Focus
2017 Strategy Outlook
Page 5
Critical factor: Rising USD interest rates
• Our house view is more hawkish than the street
• Unlike past cycles, rising interest rates to be market negative
as HK bank weighting is lower while CNY depreciation
impact is higher.
• Rising USD interest rates to help HK and global banks but
hurt REITs, utilities, and HK property
Our house sees four 2017 Fed rate hikes. FOMC members
turned more hawkish and projected three 2017 Fed rate hikes
instead of two, during the Dec 2016 FOMC meeting. Our macro
team led by David Carbon is even more hawkish as we are
projecting four 25bps hikes for 2017. Detailed rationale for our
call can be found in our 1Q17 Economics report: DBS 1Q17
Outlook for Asia and G3: December 8, 2016. In short, US labour
force participation as % of working age population has already
recovered 95% from the fall since 2008. Wages and core
inflation are set to increase in 2017. Trump’s stimulus policies
can also add fuel to the fire.
We also expect higher US treasury yields. We see real 10 year
Treasury yields settling at 1.7% against potential US GDP
growth of 1.9% per year. Add another 2% for inflation, and we
believe 10 year Treasury yields have room to increase to 3.7%
from the current 2.44%.
US wage inflation is likely as employment is already close to full employment
Source: CEIC, DBS Group research
Fed rate hike probability implied by rate futures US 10 year treasury yields
0%
5%
10%
15%
20%
25%
30%
35%
0 1 2 3 4 5
No. of 25bps hikes in 2017
1.0
1.5
2.0
2.5
3.0
3.5
4.0
4.5
5.0
10 11 12 13 14 15 16 17
(%)
Source: Bloomberg Finance L.P., DBS Vickers
HSI performed well in past hike cycles. Hong Kong’s equity
market still performed well in the past two Fed hike cycles
during 1999-2000 and 2004-2006. The HSI’s yoy change also
correlates well with US treasury yield yoy changes. However,
6. Market Focus
2017 Strategy Outlook
Page 6
this cycle is not as clear. For one, Hong Kong banks can benefit
from higher interest rates, but their weighting in the market
have declined. Secondly, trade protectionism may dampen
Hong Kong and China’s ability to benefit from an economic
recovery across the Pacific. Lastly, China plays are much more
dominant in the Hong Kong market and CNY depreciation
pressure from a hawkish Fed will be a drag. We believe a more
hawkish Fed will be negative for the overall market.
Fed rate hike changes since 1990 and the Hang Seng Index
0
5000
10000
15000
20000
25000
30000
35000
-1.0
-0.8
-0.6
-0.4
-0.2
0.0
0.2
0.4
0.6
0.8
1.0
90 91 92 93 94 95 96 97 98 99 00 01 02 03 04 05 06 07 08 09 10 11 12 13 14 15 16
Fed rate m-o-m change HSI (monthly, RHS)
(index pts)(ppts)
Source: Bloomberg Finance L.P., DBS Vickers
Hang Seng Index yoy change and US treasury yield yoy change
(2.5)
(2.0)
(1.5)
(1.0)
(0.5)
0.0
0.5
1.0
1.5
2.0
2.5
(80)
(60)
(40)
(20)
0
20
40
60
80
100
120
99 00 01 02 03 04 05 06 07 08 09 10 11 12 13 14 15 16 17
HSIyoy US treasury yield yoy change in ppts (RHS)
(%)(%)
Source: Bloomberg Finance L.P., DBS Vickers
Cautious on REITs and HK utilities. We expect rising interest
rates to be negative for these sectors. For REITs, we are most
concerned on the yield gap against risk free rates. Link REIT’s
current yield gap against HK 10 year notes is 2.6%, which is not
far from the average of 2.2% since listing. We expect more de-
rating pressure for HK REITs as risk free rates increase. We are
also cautious on Hong Kong utility stocks for the same reason.
Their stable dividend streams will lose appeal as bond yields
increase. We also expect more downside for Hong Kong
developer stocks as rising interest rates hit property affordability.
However, we do see bottom fishing opportunities for HK
developers later this year. More on this in our property
tightening factor section (pg 14).
7. Market Focus
2017 Strategy Outlook
Page 7
Link REIT (823.HK) yield gap over HK 10yr notes Link REIT (823.HK) share price and US treasury yield
(2)
(1)
0
1
2
3
4
5
6
06 07 08 09 10 11 12 13 14 15 16 17
%
Yield Spread
Average: 2.2%
0.0
1.0
2.0
3.0
4.0
5.0
6.00
10
20
30
40
50
60
70
06 07 08 09 10 11 12 13 14 15 16 17
Link REIT
US treasury 10yr yield (inverse, RHS)
(%)(HK$)
HK & China Gas (3.HK) share price and US treasury yield SHKP (16.HK) share price and US treasury yield
0.0
1.0
2.0
3.0
4.0
5.0
6.0
7.00
5
10
15
20
99 00 01 02 03 04 05 06 07 08 09 10 11 12 13 14 15 16 17
HK & China Gas
US treasury 10yr yield (inverse, RHS)
(%)(HK$)
0.0
1.0
2.0
3.0
4.0
5.0
6.00
50
100
150
200
06 07 08 09 10 11 12 13 14 15 16 17
SHK Property
US treasury 10yr yield (inverse, RHS)
(%)(HK$)
Source: Bloomberg Finance L.P., DBS Vickers
Rising interest rates to help Hong Kong and global banks.
One area that can benefit from rising interest rates are Hong
Kong and global banks. We expect higher bond yields and a
higher interest rate environment can help bank net interest
margins. In turn, NIM improvement can drive ROE recovery.
Since ROE is a key determinant for a bank’s fair price to
book, it is not surprising for bank share prices to move in
tandem to interest rates. Rising interest rates is a prime
reason for HSBC (5.HK) to be in our top picks. We expect
ROE recovery, southbound stock connect flows, and a new
round of share buybacks will help HSBC’s share price this
year. Local banks Hang Seng (11.HK) and BOCHK (2388.HK)
can also benefit. But they have performed well and we will
have higher conviction if their valuations become more
attractive.
8. Market Focus
2017 Strategy Outlook
Page 8
HSBC (5.HK) share price and US treasury yield BOCHK (2388.HK) share price and US treasury yield
0.0
1.0
2.0
3.0
4.0
5.0
6.0
7.0
8.0
0
20
40
60
80
100
120
140
160
99 00 01 02 03 04 05 06 07 08 09 10 11 12 13 14 15 16 17
HSBC US treasury 10yr yield (RHS)
(%)(HK$)
0.0
1.0
2.0
3.0
4.0
5.0
6.0
7.0
8.0
0
5
10
15
20
25
30
35
03 04 05 06 07 08 09 10 11 12 13 14 15 16 17
BOCHK
US treasury 10yr yield (RHS)
(%)(HK$)
Source: Bloomberg Finance L.P., DBS Vickers
Critical factor: Populist movements in Europe
• Euro weakness from populist victories in upcoming
elections can add to CNY depreciation pressure
• New CNY basket helps by lowering the Euro’s weighting
from 21.4% to 16.34%
• A weaker Euro to hurt companies with European
revenues
More volatility for the Euro given populist movements.
Populist views have already won in the UK and Italian
referendums in 2016. We expect more volatility for the Euro
in 2017 as the currency’s viability will be challenged by
populist movements in upcoming elections. The next key
election will be France’s presidential elections in April.
National Front’s Le Pen has been a vocal opponent of the
Euro, and she only trails behind The Republican’s Francois
Fillon by a slight margin in recent polls.
Ipsos poll in Dec 2016
Candidate Party %
Francois Fillon Les Republicans 27
Marine Le Pen National Front 25
Emmanuel Macron En Marche! 15
Jean-Luc Melenchon Left Front 14
Manuel Valls Socialist Party 12
Source: Ipsos, DBS Vickers
European elections in 2017
Co untry Ele c tion Da te Euroske ptic pa rty
Netherlands Parliamentary election 3/15/2017 Freedom Party (PVV)
France Presidential election 4/23/2017 National Front (FN)
Italy Presidential election 2H17 Five Star (M5S)
Germany German presidential election 8/27/2017 Alternative for Germany (AfD)
Source: DBS Vickers
9. Market Focus
2017 Strategy Outlook
Page 9
Euro weakness can add to CNY depreciation pressure.
China adopted a new basket comprising 22 currencies
instead of 13 at the start of 2017. The new basket lessens
the Euro’s impact to the CNY, as its weight declined from
21.4% to 16.34%. However, the Euro is still the second
largest basket component behind the US dollar.
Cautious on companies with European revenues. We expect
HK/China companies with European revenues will be
negatively impacted with more Euro weakness, inluding
Esprit (330.HK), CK Hutch (1.HK), Prada (1913.HK), HSBC
(5.HK), Samsonite (1910.HK), Vtech (303.HK), and
Goodbaby (1086.HK). CNY depreciation will also have
market impacts, which we will highlight in the CNY factor
segment on page 11.
Old and new CNY basket weights
0
5
10
15
20
25
30
USD
EUR
JPY
HKD
AUD
MYR
RUB
GBP
SGD
THB
CAD
CHF
NZD
KRW
SAR
AED
ZAR
MXN
TRY
PLN
SEK
DKK
HUF
NOK
Old basket New basket
(% of basket)
(new currency additions)
Source: Bloomberg Finance L.P., DBS Vickers
CNY reconstructed using old and new reference baskets Euro vs. USD
6.40
6.50
6.60
6.70
6.80
6.90
7.00
Jun-16 Jul-16 Aug-16 Sep-16 Oct-16 Nov-16 Dec-16
Actual spot
Based on old basket
Based on new basket
(CNY/ USD
1.00
1.05
1.10
1.15
1.20
1.25
1.30
1.35
1.40
1.45
1.50
Jan/14 Jul/14 Jan/15 Jul/15 Jan/16 Jul/16
Source: Bloomberg Finance L.P., DBS Vickers
10. Market Focus
2017 Strategy Outlook
Page 10
Critical factor: USD strength
• We expect the USD to remain strong in 2017
• A strong USD is negative for the broad market
• A strong USD also hurts HK retail and Macau gaming
Foresee USD strength to continue in 2017. We expect the
USD to strengthen further in 2017 due to economic
recovery, reflation environment, and potential Trump
stimulus policies in the US. Euro uncertainty can also lend
strength to the USD. Unfortunately the USD correlates
negatively with the HSI, much like how the Nikkei correlates
negatively with Yen strength. A strong USD is also negative
for corporate earnings revisions in HKD terms, as China
income streams would translate at a poorer rate.
Negative for HK retail and Macau gaming. A strong USD
lowers the competitiveness of Hong Kong and Macau as
tourist destinations. Hong Kong residents also travel more
abroad when the currency is strong, implying lower local
spending. We believe a stronger USD can stall recovery of
HK tourism and HK retail. Cheaper currencies in competing
destinations like Japan can draw away mainland tourists and
local spending. Thus we are not too upbeat on HK retail.
Similarly, Macau gaming faces similar currency challenges.
USD is negatively correlated with HSI performance Nikkei and Yen
50
60
70
80
90
100
110
1200
5,000
10,000
15,000
20,000
25,000
30,000
35,000
05 06 07 08 09 10 11 12 13 14 15 16 17
HSI USD (inverse, RHS)
60
70
80
90
100
110
120
130
5,000
10,000
15,000
20,000
25,000
05 06 07 08 09 10 11 12 13 14 15 16 17
Nikkei 225 YEN (RHS)
HK residents spend more overseas when USD is strong Strong USD hurts mainland tourist arrival to HK
60
70
80
90
100
110
120
130
-10
-5
0
5
10
15
20
25
87 89 91 93 95 97 99 01 03 05 07 09 11 13 15
HK residents outbound
travel
DXY - RHS
(trailing 12Mavg , YoY%)
60
65
70
75
80
85
90
95
100
105
110-30%
-20%
-10%
0%
10%
20%
30%
40%
50%
60%
70%
07 08 09 10 11 12 13 14 15 16
Mainland overnight tourists to HK yoy
USD DXY Index (inverse, RHS)
Source: CEIC, Bloomberg Finance L.P., DBS Vickers
11. Market Focus
2017 Strategy Outlook
Page 11
Japan likely to draw more mainland tourists with weak Yen …and HK residents also
70
80
90
100
110
120
130
140
-40
-20
0
20
40
60
80
100
120
00 02 04 06 08 10 12 14 16
China visitor to Japan
JPY-RHS
(trailing 12Mavg , YoY%) (JPY/US$)
70
80
90
100
110
120
130
140
-60
-40
-20
0
20
40
60
80
100
94 96 98 00 02 04 06 08 10 12 14 16
HK visitors to Japan
JPY -RHS
(trailing 12Mavg , YoY%) (JPY/US$)
Source: CEIC, Bloomberg Finance L.P., DBS Vickers
Critical factor: CNY depreciation
• We forecast CNY to hit 7.19 by year end
• Exporters to the US and popular Southbound connect
stocks can benefit
• Cautious on Chinese companies that borrow USD or have
USD COGS
CNY depreciation is another market drag. Our house
expects the CNY to depreciate 3.5% against the USD in
2017 to 7.19. CNY depreciation is negative to the Hong
Kong market given increased prevalence of China plays. The
HSI has correlated negatively with CNY direction in the past.
DBS and consensus CNY outlook Hang Seng Index and CNY
5.5
6.0
6.5
7.0
7.5
8.0
8.5 5,000
10,000
15,000
20,000
25,000
30,000
35,000
05 06 07 08 09 10 11 12 13 14 15 16 17
HSI CNY (inverse, RHS)
Source: Bloomberg Finance L.P., DBS Group Research, DBS Vickers
12. Market Focus
2017 Strategy Outlook
Page 12
New CNY basket may help slightly. China’s foreign
exchange trading platform operator announced it will
expand the number of currencies in its CNY reference
basket from 13 to 22. The move can help limit CNY
depreciation risk from European shocks, as the Euro’s
weighting dropped from 21.4% to 16.3%. The 11 new
currencies make up 26.7% of the new basket. The Korean
Won is a notable addition at 10.77% weight. We
reconstructed the CNY since Brexit using the old and new
reference baskets, and the new basket implied less
depreciation. But new basket or not, we believe CNY will be
on a downtrend in 2017.
Cautious on China companies with USD or HKD debt. CNY
depreciation’s negative impact will be more pronounced for
Chinese companies with USD or HKD debt. These include
China properties, water and alternative energy plays, and
airlines. HK retail and gaming can also see negative impacts
due to lower spending power of mainland tourists.
Exporters can make a comeback with more trade policy
clarity. Exporters are historically a good hedge against CNY
depreciation. However, Trump’s trade policy uncertainty
remains an overhang. We believe exporters can enjoy a
good run once there is more clarity on US trade policies. In
the meantime, we highlight HK brokers and popular
Southbound Connect stocks as alternative hedges against a
falling CNY. We expect Southbound flows to pick up in a
weak CNY environment to benefit these two groups.
Tencent (700.HK), Big 4 banks, HSBC (5.HK), Huaneng
Power (902.HK), China telecom operators, SMIC (981.HK),
China Cinda (1359.HK), and AIA (1299.HK) have seen most
active Southbound connect stocks during the inflow spike at
the end of December 2016.
New CNY basket
6.40
6.50
6.60
6.70
6.80
6.90
7.00
Jun-16 Jul-16 Aug-16 Sep-16 Oct-16 Nov-16 Dec-16
Actual spot
Based on old basket
Based on new basket
(CNY/ USD
Source: Bloomberg Finance L.P., DBS Vickers
Stock connect southbound flows and CNY
5.6
5.8
6
6.2
6.4
6.6
6.8
7
7.2
‐4.0%
‐2.0%
0.0%
2.0%
4.0%
6.0%
8.0%
10.0%
Nov/14 Feb/15 May/15 Aug/15 Nov/15 Feb/16 May/16 Aug/16 Nov/16
Total net buying as % of turnover CNY (RHS)
Source: Bloomberg Finance L.P., DBS Vickers
13. Market Focus
2017 Strategy Outlook
Page 13
Chinese companies in our universe that have USD and HKD debt
Estima te d ge a ring
Stoc k a ttributa ble to
Code Compa ny USD/HKD Rmb Othe rs HKD/USD de bt
371 Beijing Enterprises Water 50% 50% 0% 80%
2314 Lee and Man Paper 100% 0% 0% 70%
3308 Golden Eagle 100% 0% 0% 68%
1700 Springland Int'l 85% 15% 0% 44%
1313 China Resources Cement 62% 38% 0% 39%
81 China Overseas Grand Oceans 83% 17% 0% 37%
123 Yuexiu Property 53% 47% 0% 36%
257 China Everbright Intl 50% 50% 0% 35%
832 Central China 69% 31% 0% 33%
817 China Jinmao Holdings 53% 47% 0% 32%
3383 Agile Property 46% 52% 1% 31%
2007 Country Garden 35% 61% 3% 30%
3311 China State Construction 73% 25% 1% 29%
3377 Sino-Ocean Land 46% 54% 0% 27%
1363 CT Environmental Group 40% 60% 0% 27%
1117 China Modern Dairy 46% 54% 0% 25%
813 Shimao Property 48% 52% 0% 24%
CEWL SP China Everbright Water 30% 70% 0% 24%
1381 Canvest Environment Protection 30% 70% 0% 23%
881 ZhongSheng 19% 80% 0% 22%
1728 China ZhengTong 27% 73% 0% 19%
410 Soho China 56% 44% 0% 19%
3333 Evergrande Real Estate 19% 81% 0% 16%
272 Shui On Land 27% 73% 0% 16%
1109 China Resources Land 47% 53% 0% 13%
688 China Overseas 70% 21% 9% 12%
506 China Foods 90% 10% 0% 11%
Borrowing mix (%)
Source: Companies, DBS Vickers
14. Market Focus
2017 Strategy Outlook
Page 14
CNY depreciation winners and losers
Sector Companies Impact
Positiv e Exporters Techtronic (669.HK)
TK Group (2283.HK)
Shenzhou Int'l (2313.HK)
Pacific Textiles (1382.HK)
Man Wah (1999.HK)
Nameson (1982.HK)
Regina Miracle (2199.HK)
T echnology ASM (522.HK)
AAC Acoustics (2018.HK)
Others Minth (425.HK) 30% of sales are from overseas while costs are largely Rmb
Guangdong Investment (270.HK) Water sales to HK are fixed in HK$ but costs are in Rmb
Railway equipment Overseas markets are new growth drivers
Negativ e A irlines Air China (753.HK), China Southern
Airlines (1055.HK)
Revenues are in Rmb, but majority of debt and some costs are
US$ based
China
property
COGO (81.HK), COLI (688.HK),
Agile (3383.HK)
Selective developers have high HKD/USD liabilities
Env ironmental Beijing Ent Water (371.HK), China
Everbright Int'l (257.HK)
USD/HKD debt, but cash flows are in CNY
HK bank s BEA (23.HK) Rmb depreciation will have negative translation effect. More
impact for BEA given larger portion of Rmb assets.
HK retail Slightly lower purchasing power of mainland tourists in HK$
terms
Gaming Slightly lower spending power of mainland tourists
Others Texhong (2678.HK) 90% revenues are in Rmb but 65% of COGS is in USD
Brilliance China (1114.HK) Slight negative as some engines are imported from Germany
Value Partners (806.HK) Translation of A-shares to fund NAVs for performance fees
Baosteel (600019) USD debt translation to hit Rmb EPS
Far East Horizon (3360.HK) Offshore funding
Xinchen (1148.HK) USD debt translation
Yangtze Optical Fibre (6869.HK) Non-Rmb debt translation
Sinopharm (1099.HK) Some procurement of overseas drugs for sale in China
Sales are primarily denominated in USD, while costs are largely in
Rmb. Trade protectionism risk.
Majority of costs are in Rmb while sales are largely in foreign
currencies. But trade protectionism risk offsets currency
benefits.
Source: DBS Vickers
Critical factor: HK/China property tightening
• We believe property price controls will only get tighter in
both Hong Kong and China
• Equities can potentially benefit as an investment class
• But property correction can hurt Macau gaming and
Hong Kong retail
• Foresee more downside for HK developers, but they can
be attractive if share prices drop substantially
Tightening to persist in 2017. Property tightening policies
ramped up in 2016 for both mainland China and Hong
Kong. We expect more tightening for both markets as prices
remain exceedingly high. In Hong Kong, some 166 square
foot studios sold for above HK$3m each in a recent property
launch. For the same price, one can purchase a 3,800
square foot house on an 0.8 acre lot with great view in
Ithaca, New York. Housing remains a sticky issue politically
and we foresee continued tightening.
15. Market Focus
2017 Strategy Outlook
Page 15
166 sq ft studio in AVA 55 that sells for HK$3m, the same as… … a 3,800 square foot house on 0.8 acre lot in Ithaca, NY
Source: AVA 55, Zillow.com
Other investment classes can benefit. Past property
corrections in China have corresponded with A-share
market corrections. This cycle can be different as the two
investment classes already decoupled in 2015. Moreover,
past corrections were driven by M2 contractions, which
impacted both properties and equities. We expect China’s
monetary policy to remain stable in the near term. The A-
share market crash since 2015 has helped China’s property
market boom in 2016 as domestic equities fell out of favor.
This can reverse in 2017, especially if there are
corresponding catalysts like MSCI index inclusion.
Improvements in A-share sentiment can benefit China
insurance, China brokers, and asset managers.
Property correction can hurt Macau gaming and HK retail.
Aside from unfavorable currency trends, Macau gaming and
HK retail also face negative wealth effect when property
prices correct. Macau’s gaming revenue have trended in
tandem with China’s property price trends. The correlation
was stronger during 2007-2012 when both swung to the
tune of China’s M2 growth. But M2 growth has been
relatively stable in recent years, and yet the two still showed
correlation.
Meanwhile, China’s property prices do not seem to have too
much of an impact on China’s retail sales. But the impact
seems to be higher between HK’s property prices and HK
retail sales. Thus we fear a property correction in HK can
also stall HK retail’s recovery from a low base.
17. Market Focus
2017 Strategy Outlook
Page 17
Look to bottom fish Hong Kong property stocks later this
year. We foresee more downside for Hong Kong property
developer stocks when physical property prices correct
moderately. However, we do foresee an opportunity to
bottom fish developer stocks later this year, as they have
already been correcting since last year. Our proprietary
relative appeal index shows HK developer stocks will be very
attractive if they correct another 15-20%. One should sell
physical property to buy developer stocks at that juncture,
as the gap between the market cap of developers and
physical property prices would be very wide, similar to what
we experienced in 1998.
Combined market cap of property developers and average residential property price
0
1,000
2,000
3,000
4,000
5,000
6,000
7,000
8,000
9,000
0
100
200
300
400
500
600
700
800
900
97 98 99 00 01 02 03 04 05 06 07 08 09 10 11 12 13 14 15 16 17
Combined market cap* Midland average price per sq. ft (RHS)
(HK$)(HK$ bn)
* SHKP, Henderson Land, New World, Wheelock, Sino Land
Source: Bloomberg Finance L.P., DBS Vickers
DBS proprietary property relative index – relative appeal of physical residential property vs. property developer stocks
(5,000)
(4,000)
(3,000)
(2,000)
(1,000)
0
1,000
2,000
3,000
4,000
97 98 99 00 01 02 03 04 05 06 07 08 09 10 11 12 13 14 15 16 17
DBS Proprietary PropertyRelativeIndex
should sell physical property to buy property stocks
should sell physical property stocks to buy physicalproperty
Source: Bloomberg Finance L.P., DBS Vickers
18. Market Focus
2017 Strategy Outlook
Page 18
Critical factor: Rising China bond yields
• US treasury yield spike can pressure China bond yields
• Higher borrowing costs in CNY and USD can hurt high
gearing companies
• Rising bond yields can help China banks and insurance
companies
Yield gap over US treasuries narrowed. China’s 10 yr
sovereign yield gap over US treasuries narrowed to 61bps at
the end of 2016 after US treasury yields spiked in 2H16. We
expect China bond yields to increase from 2016 levels.
Given rising borrowing costs in CNY, USD, and HKD, high
gearing companies listed in Hong Kong will be at risk. We
favor lenders over borrowers in this environment. Materials,
utilities, environmental, and auto dealers are among high
gearing companies in our universe. We also see risk for
leasing companies if their liabilities reprice quicker than their
assets.
High gearing companies in our universe
Sto c k Ne t
Co d e Co mp a n y g e a rin g
486 United Co RUSAL PLC 1173%
2588 BOC Aviation 276%
2666 Universal Medical 268%
958 Huaneng Renewables Corp 254%
1310 HKBN Ltd. 247%
3323 China Nat'l Bldg Mat 220%
200053 Shenzhen Chiwan Petroleum 172%
916 China Longyuan Power 164%
814 Beijing Jingkelong 159%
1816 CGN Power 141%
371 Beijing Enterprises Water 139%
337 Greenland (Hong Kong) 134%
6136 Kangda International 120%
3333 Evergrande Real Estate 113%
1378 China Hongqiao Group 111%
881 ZhongSheng 106%
1910 Samsonite Int'l 105%
1800 China Comm Construction 100%
6823 HKT Trust 91%
1668 China South City 84%
2689 Nine Dragons 81%
3383 Agile Property 81%
1828 Dah Chong Hong 80%
1883 CITIC Telecom 78%
1728 China ZhengTong 76%
3308 Golden Eagle 76%
Source: Companies, DBS Vickers
China 10 year sovereign yield Yield gap between China sovereign and US treasuries
2.0
2.5
3.0
3.5
4.0
4.5
5.0
08 09 10 11 12 13 14 15 16 17
(%)
-1.0
-0.5
0.0
0.5
1.0
1.5
2.0
2.5
3.0
08 09 10 11 12 13 14 15 16 17
(ppt)
Source: Bloomberg Finance L.P., DBS Vickers
19. Market Focus
2017 Strategy Outlook
Page 19
China financials can benefit. China banks and insurance
companies can benefit from rising bond yields. Banks can
see better treasury returns and interest income in a higher
interest rate environment. Loan demand and pricing can
also improve. With the exception of the 2013 yield increase,
past sovereign yield cycles have correlated with China
financials’ share prices. A cooler bond market can also help
A-shares, which has been out of favor as an investment
class when compared to properties and fixed income.
BOC (3988.HK) share price and China bond yields CCB (939.HK) share price and China bond yields
1.0
1.5
2.0
2.5
3.0
3.5
4.0
4.5
5.0
0
1
2
3
4
5
6
06 07 08 09 10 11 12 13 14 15 16 17
BOC
China sovereign 10yr yield (RHS)
(%)(HK$)
1.0
1.5
2.0
2.5
3.0
3.5
4.0
4.5
5.0
0
1
2
3
4
5
6
7
8
9
06 07 08 09 10 11 12 13 14 15 16 17
CCB China sovereign 10yr yield (RHS)
(%)(HK$)
Ping An (2318.HK) share price and China bond yields China Life (2628.HK) share price and China bond yields
1.0
1.5
2.0
2.5
3.0
3.5
4.0
4.5
5.0
0
10
20
30
40
50
60
70
06 07 08 09 10 11 12 13 14 15 16 17
Ping An
China sovereign 10yr yield (RHS)
(%)(HK$)
1.0
1.5
2.0
2.5
3.0
3.5
4.0
4.5
5.0
0
10
20
30
40
50
60
06 07 08 09 10 11 12 13 14 15 16 17
China Life
China sovereign 10yr yield (RHS)
(%)(HK$)
Source: Bloomberg Finance L.P., DBS Vickers
20. Market Focus
2017 Strategy Outlook
Page 20
Shanghai Composite Index and China sovereign yields
(2.0)
(1.5)
(1.0)
(0.5)
0.0
0.5
1.0
1.5
2.0
(100)
(50)
0
50
100
150
200
250
300
99 00 01 02 03 04 05 06 07 08 09 10 11 12 13 14 15 16 17
SHCOMP yoy China sovereign yield yoy change in ppts (RHS)
(%)(%)
Source: Bloomberg Finance L.P., DBS Vickers
Critical factor: Trump policies
• If Sino-US relations deteriorate, exporters and Chinese
companies with US ties are at risk
• But companies that compete with US brands in China can
potentially benefit
• Materials and banks can benefit from inflationary
infrastructure and tax policies
Impacts from change in Sino-US relations. It is anyone’s
guess for Trump’s policies when he takes office later this
month. However, we do see risk of deteriorating Sino-US
relations given Trump’s choice of China critics Robert
Lighthizer as U.S. Trade Representative and Peter Navarro as
head of newly formed White House National Trade Council.
If Sino-US relations do sour, we expect exporters to be at
direct risk. SAIC and ChangAn Auto are also at risk since
they derive 35-45% of their revenues from Sino-US JVs.
SAIC is partnered with General Motors, while ChangAn
Auto is partnered with Ford. However, someone’s loss
stands to be another person’s gain. We expect if China
retaliates against US brands on its soil, competitors of key
US brands stand to benefit.
Negative impacts
- Companies that supply US companies or export to the US:
AAC (2018.HK), Sunny Optical (2382.HK), TK Group
(2283.HK), Techtronics (669.HK), Man Wah Holdings
(1999.HK), Shenzhou (2313.HK), Qingdao Haier
(600690.CH)
- Chinese companies that have US ties: SAIC (600104.CH),
ChangAn Auto (000625.CH)
- US companies with China revenues or aspirations: Apple,
Boeing, General Motors, Nike, Starbucks, General
Motors, Yum
Positive impacts
Companies that compete with US brands in China: Airbus,
Li Ning (2331.HK), Brilliance China (1114.HK), Geely
(175.HK), Xiaomi
Trump’s domestic policies can help banks and commodities.
Trump’s infrastructure and tax policies should be reflationary
and lead to higher interest rates and commodity prices. HK
& global banks and commodity plays can benefit among HK
listed companies. However, high gearing companies will be
hurt by higher funding costs.
21. Market Focus
2017 Strategy Outlook
Page 21
Potential Trump policy impacts to HK equities
Expected trend Stock impacts Expected trend Stock impacts
Stronger USD and Fed rate
hike outlook
Positive:
- Global banks and HK banks
Trade
protectionism risk
Negative:
Negative:
- Chinese companies with USD
debt : Beijing Ent Water
371.HK, CR Cement 1313.HK,
COGO 81.HK, China Everbright
Int'l 257.HK
- HK REITs and HK properties
- Exporters and TPP plays: Techtronics
(669.HK), AAC Acoustics (2018.HK),
Shenzhou (2313.HK), Man Wah
(1999.HK)
- Sino-US JVs: SAIC Motors (600104.CH),
ChangAn Auto (000625.CH)
Reflation trend Positive:
- Commodity plays Jiangxi
Copper (358.HK)
Negative:
- Airlines, appliances, and other
commodity users
Source: DBS Vickers
Critical factor: Reflation trend
• Wage inflation and Trump policies to be key inflation
drivers in the US
• SOE reform and environmental control in China are also
cutting excess capacity
• Our materials analyst likes steel, but sees aluminium
supply worsening in China
We like oil and steel as reflation plays. We upgraded oil to
overweight last year, as OPEC’s supply cut should accelerate
supply-demand returning to equilibrium. In turn, we expect
China’s oil giants can see earnings recovery. We also like the
steel sector, despite its already strong performance in 2H16.
Supply cuts have been encouraging and we have higher
confidence for steel profitability in the coming years. We
expect slight demand growth while supply contracts, thanks
to infrastructure demand that can offset slowdowns from
property and autos. In addition, railways and construction
can also benefit as their contracts are on a cost-plus model.
But we are cautious of commodity users that cannot fully
pass on rising costs. We see risks with airlines given rising oil
prices, and appliances given copper and aluminium price
hikes.
China rolled steel sheet price Crude oil price
1,500
2,000
2,500
3,000
3,500
4,000
4,500
5,000
5,500
6,000
08 09 10 11 12 13 14 15 16
(Rmb/MT)
20
30
40
50
60
70
80
90
100
110
120
12 13 14 15 16
(USD/ barrel)
Source: CEIC, Bloomberg Finance L.P., DBS Vickers
22. Market Focus
2017 Strategy Outlook
Page 22
Critical factor: MSCI review of A-shares
• China needs to address three outstanding issues before
A-share inclusion.
• We believe there is a 70% chance for inclusion this year.
• China insurance and brokers can benefit. But slight
sentiment hit for H-shares due to weighting decline.
70% chance of inclusion. Crosses in the following table
mark outstanding issues, while circles mark areas that need
execution evidence and observation time. We believe
inclusion chance is high for next review in 2017. Financial
market reform is a necessary component of Xi Jinping’s
reforms. Moreover, inclusion should guarantee net inflows
initially from passive investment funds. This lessens the risk
of relaxing capital repatriation limits of QFII, which is the key
hurdle for inclusion.
Inclusion to help non-bank financials, but hurt overall H-
shares. We see China insurance and brokers being a good
hedge against potential A-share inclusion. Once the
inclusion process kicks off, we expect A-shares’ weighting in
MSCI indices to expand at the expense of H-shares and US
ADRs. China non-bank financials would be a rare sector
listed in Hong Kong that can benefit from improved fund
flow to the A-share market.
Three remaining MSCI A-share inclusion hurdles
Concerns raised since 2015 rev iew
Base quota is now linked to AUM ranging from
US$20m to US$5bn.
Quota exceeding US$5bn subject to SAFE
approval
No requirement for quota top-up unless it exceeds
US$5bn. Need time to observe execution.
Quota exceeding US$5bn subject to SAFE
approval
A more streamlined, transparent and predictable
quota allocation process
Base quota automatically obtained based on
AUM through filing with SAFE
Remittance period for QFIIs is removed
Repatriation for QFIIs shortened to daily. Need
evidence of seamless execution.
Separated accounts no longer treated as closed-
end fund and enjoy daily repatriation
Lock up period shortened from 1 year to 3
months
Monthly repatriation still capped at 20% of prior-
year NAV. One of key oustanding concerns in
2016 review.
Elimination of potential trading uncertainty due to
daily limit on the stock connect
Outstanding concern but was not mentioned in
June 2016 review. Focus was on QFII capital
Widespread
v oluntary
suspension
Widespread voluntary suspension practices
prevented normal market trading activities and
caused liquidity and replication concern.
Some improvements in number of stock
suspensions since new rules to limit restructuring
related voluntary suspensions to 3 months and
other types of suspensions to 1 month. Need
more time to observe.
A nti-competitiv e
clauses
Existence of a provision that all financial products
(including ETFs) linked to an index containing
China A-shares need to be pre-approved by the
local Chinese stock exchanges even if listed
internationally is unique among emerging markets.
One of key concerns raised in June 2016 review.
Beneficial
ownership
Current QFII / RQFII framework does not provide a
clear recognition on the ultimate beneficial
ownership of assets under separate accounts.
Current status
Quota allocation
process (QF II /
RQF II)
Ability to access quota commensurate with the size
of assets under management
Ability to secure additional quota with certainty
should the need arise
Capital mobility
restrictions (QF II
/ RQF II / Stock
connect)
Extension of daily liquidity for all investment
vehicles, including open-ended funds, ETFs and
separate accounts
Removal of capital lock-up and repatriation
restrictions on QFII / RQFII
Client names can be now included in QFII / RQFII
separated accounts. MSCI considers this to be
resolved
Source: MSCI, DBS Vickers
23. Market Focus
2017 Strategy Outlook
Page 23
Estimated weighting changes for MSCI EM with initial and full A-share inclusion scenarios
China H-
shares,
22%
China
Overseas,
5%
China A-
shares, 1%
Korea,
15%
Taiwan,
12%
India, 8%
South
Africa, 7%
Brazil, 7%
Mexico,
4%
Russia, 4%
Others,
15%
Estimated weighting (initial inclusion at
5% free float)
China H-
shares,
19%
China
Overseas,
4%
China A-
shares,
17%
Korea,
12%
Taiwan,
10%
India, 7%
South
Africa, 6%
Brazil, 6%
Mexico,
3%
Russia, 3%
Others,
13%
Estimated weighting with full A-share
inclusion
Source: MSCI
24. Market Focus
2017 Strategy Outlook
Page 24
Critical factor: Earnings recovery from low base
• We expect market earnings growth can resume in 2017
after 2015-2016 declines
• Oil, commodities, China insurance, China brokers, China
telecom, and Macau gaming are sectors that can see
recovery
• PetroChina, China Unicom, Angang, Value Partners,
Kingsoft, Li Ning, and Nameson score well in our
earnings momentum screens
Low base to be key driver for 2017 earnings recovery. We
don’t expect much for China and Hong Kong’s macro
outlook. However, several sectors can still see earnings
recovery as they are coming off low bases in 2015 and 2016.
Oil, non-bank financials, and China telecom are our favored
earnings recovery plays. Oil and commodities should see
earnings recovery as ASP trends improve on better supply-
demand outlook. Meanwhile, non-bank financials were hurt
by the correction in Greater China equities during 2H15 and
1H16. We expect market conditions should be better in
2017. We also expect China telecom to make a comeback,
driven by improvements in tower sharing. Besides these
three areas, Macau gaming and HK retail should also see
recovery from a low base. However, we believe gaming and
HK retail’s share price performance in 2H16 have already
priced in positives. These two sectors also face currency and
negative wealth headwinds.
Earnings growth of HSI members Earnings growth of HSCEI members
‐40%
‐30%
‐20%
‐10%
0%
10%
20%
30%
40%
‐20%
‐10%
0%
10%
20%
30%
40%
Source: Bloomberg Finance L.P., DBS Vickers
Finding winners with upbeat earnings momentum. We
screened for companies with better FY17 EPS growth
improvement and ’16-18 earnings growth CAGR using
consensus forecasts. We believe these are among critical
factors for identifying next year’s outperformers. The
highlighted names in grey on the following tables are our
preferred earnings growth improvement plays with
reasonable valuations. We also favor companies with upbeat
FY16-18 EPS CAGR and low PEGs. PetroChina (857.HK),
China Unicom (762.HK), Angang (347.HK), Value Partners
(806.HK), Kingsoft (3888.HK), Li Ning (2331.HK), and
Nameson (1982.HK) score well in our earnings momentum
screens.
25. Market Focus
2017 Strategy Outlook
Page 25
Companies with upbeat 2016-2018 EPS CAGR (consensus estimates)
Ticker Company
YTD
perf.
(%)
15 EPS
(HKD)
16F
EPS
(HKD)
17F
EPS
(HKD)
18F
EPS
(HKD) 17F PE
Change in
EPS growth:
'17 v s. '16
EPS
CA GR
'16-18
PEG
'16-
18
996 HK Equity Carnival Group International H -2% 0.01 0.00 0.03 0.04 36.3 2688% 524% 1.87
317 HK Equity CSSC Offshore and Marine Engin -23% 0.09 0.02 0.22 0.49 54.1 939% 361% 1.45
1208 HK Equity MMG Ltd 38% (1.41) 0.02 0.35 0.41 5.5 1663% 340% 0.27
1117 HK Equity China Modern Dairy Holdings Lt -8% 0.08 0.01 0.11 0.14 16.5 918% 243% 0.63
857 HK Equity PetroChina Co Ltd 14% 0.23 0.06 0.29 0.48 20.1 500% 196% 0.54
1136 HK Equity TCC International Holdings Ltd 25% (0.07) 0.01 0.05 0.05 36.5 625% 160% 1.40
2600 HK Equity Aluminum Corp of China Ltd 20% 0.01 0.03 0.14 0.19 22.8 122% 135% 0.67
2039 HK Equity China International Marine Con -21% 0.89 0.15 0.81 0.75 13.8 540% 127% 0.60
2888 HK Equity Standard Chartered PLC -4% (7.12) 1.44 3.78 5.88 16.6 282% 102% 0.43
762 HK Equity China Unicom Hong Kong Ltd -5% 0.54 0.13 0.31 0.50 28.8 225% 99% 0.72
488 HK Equity Lai Sun Development Co Ltd 26% 0.10 0.01 0.01 0.03 14.4 90% 73% 0.20
242 HK Equity Shun Tak Holdings Ltd -9% 0.25 0.25 0.25 0.74 10.7 -1% 73% 0.15
806 HK Equity Value Partners Group Ltd -32% 0.15 0.13 0.27 0.37 22.6 132% 71% 0.68
853 HK Equity Microport Scientific Corp 58% (0.07) 0.10 0.19 0.26 30.2 346% 64% 0.94
606 HK Equity China Agri-Industries Holdings 15% (0.06) 0.12 0.23 0.31 13.5 378% 60% 0.43
1918 HK Equity Sunac China Holdings Ltd 7% 1.20 0.55 0.84 1.39 7.7 107% 59% 0.20
3888 HK Equity Kingsoft Corp Ltd -16% 0.36 0.57 1.01 1.41 15.7 20% 58% 0.49
293 HK Equity Cathay Pacific Airways Ltd -24% 1.53 0.14 0.12 0.33 84.0 80% 56% 1.33
861 HK Equity Digital China Holdings Ltd -2% 0.62 0.16 0.26 0.37 23.0 141% 53% 0.71
2319 HK Equity China Mengniu Dairy Co Ltd 17% 0.75 0.39 0.79 0.88 18.8 149% 50% 0.76
2331 HK Equity Li Ning Co Ltd 13% 0.01 0.18 0.29 0.40 16.3 -2048% 49% 0.54
814 HK Equity Beijing Jingkelong Co Ltd -16% 0.07 0.08 0.08 0.17 20.8 -5% 47% 0.44
1898 HK Equity China Coal Energy Co Ltd 21% (0.31) 0.13 0.25 0.26 14.6 236% 42% 0.68
493 HK Equity GOME Electrical Appliances Hol -29% 0.09 0.03 0.05 0.05 20.0 140% 40% 0.85
3333 HK Equity China Evergrande Group -29% 0.88 0.40 0.61 0.77 7.9 110% 39% 0.31
2899 HK Equity Zijin Mining Group Co Ltd 22% 0.10 0.10 0.16 0.19 15.1 57% 36% 0.66
300070 CH Equity Beijing Originwater Technology -17% 0.61 0.75 1.04 1.38 16.9 14% 35% 0.66
1982 HK Equity Nameson Holdings Ltd 27% 0.18 0.11 0.15 0.19 10.8 88% 35% 0.45
600588 CH Equity Yonyou Network Technology Co L -34% 0.28 0.31 0.42 0.56 50.4 25% 35% 1.96
2120 HK Equity Wenzhou Kangning Hospital Co L -26% 1.27 1.05 1.40 1.90 24.3 50% 34% 0.94
291 HK Equity China Resources Beer Holdings -1% (1.51) 0.40 0.64 0.71 23.5 189% 34% 1.13
000898 CH Equity Angang Steel Co Ltd 5% (0.78) 0.20 0.23 0.36 21.6 142% 34% 0.74
1128 HK Equity Wynn Macau Ltd 41% 0.46 0.38 0.53 0.67 23.1 58% 33% 0.98
175 HK Equity Geely Automobile Holdings Ltd 76% 0.32 0.53 0.75 0.94 9.6 -27% 32% 0.42
347 HK Equity Angang Steel Co Ltd 44% (0.78) 0.21 0.25 0.36 18.4 144% 31% 0.70
1970 HK Equity IMAX China Holding Inc -31% (4.81) 0.98 1.32 1.66 28.5 154% 30% 1.28
1333 HK Equity China Zhongwang Holdings Ltd -17% 0.64 0.48 0.63 0.80 5.2 56% 30% 0.23
700 HK Equity Tencent Holdings Ltd 23% 3.82 5.21 6.79 8.74 27.6 -6% 30% 1.22
165 HK Equity China Everbright Ltd -19% 3.05 2.18 2.42 3.63 6.0 40% 29% 0.23
3323 HK Equity China National Building Materi 0% 0.23 0.28 0.41 0.47 9.2 26% 29% 0.46
400 HK Equity Cogobuy Group 13% 0.32 0.38 0.50 0.62 23.4 15% 29% 1.08
Source: Bloomberg Finance L.P., DBS Vickers
26. Market Focus
2017 Strategy Outlook
Page 26
Companies with large improvements in 2017 EPS growth (consensus estimates)
Ticker Company
YTD
perf.
(%)
15 EPS
(HKD)
16F
EPS
(HKD)
17F
EPS
(HKD)
18F
EPS
(HKD) 17F PE
Change in
EPS growth:
'17 v s. '16
EPS
CA GR
'16-18
PEG
'16-
18
996 HK Equity Carnival Group International H -2% 0.01 0.00 0.03 0.04 36.3 2688% 524% 1.87
317 HK Equity CSSC Offshore and Marine Engin -23% 0.09 0.02 0.22 0.49 54.1 939% 361% 1.45
1117 HK Equity China Modern Dairy Holdings Lt -8% 0.08 0.01 0.11 0.14 16.5 918% 243% 0.63
2039 HK Equity China International Marine Con -21% 0.89 0.15 0.81 0.75 13.8 540% 127% 0.60
857 HK Equity PetroChina Co Ltd 14% 0.23 0.06 0.29 0.48 20.1 500% 196% 0.54
762 HK Equity China Unicom Hong Kong Ltd -5% 0.54 0.13 0.31 0.50 28.8 225% 99% 0.72
2319 HK Equity China Mengniu Dairy Co Ltd 17% 0.75 0.39 0.79 0.88 18.8 149% 50% 0.76
861 HK Equity Digital China Holdings Ltd -2% 0.62 0.16 0.26 0.37 23.0 141% 53% 0.71
493 HK Equity GOME Electrical Appliances Hol -29% 0.09 0.03 0.05 0.05 20.0 140% 40% 0.85
806 HK Equity Value Partners Group Ltd -32% 0.15 0.13 0.27 0.37 22.6 132% 71% 0.68
2600 HK Equity Aluminum Corp of China Ltd 20% 0.01 0.03 0.14 0.19 22.8 122% 135% 0.67
88 HK Equity TAI Cheung Holdings Ltd 9% 0.90 0.34 0.51 0.54 13.3 112% 26% 0.77
2038 HK Equity FIH Mobile Ltd -13% 0.23 0.08 0.13 0.13 19.5 112% 24% 1.19
3333 HK Equity China Evergrande Group -29% 0.88 0.40 0.61 0.77 7.9 110% 39% 0.31
1918 HK Equity Sunac China Holdings Ltd 7% 1.20 0.55 0.84 1.39 7.7 107% 59% 0.2
86 HK Equity Sun Hung Kai & Co Ltd -6% 1.74 0.25 0.29 0.32 16.5 102% 13% 1.46
683 HK Equity Kerry Properties Ltd -1% 3.83 2.17 3.37 2.75 6.2 99% 13% 0.76
488 HK Equity Lai Sun Development Co Ltd 26% 0.10 0.01 0.01 0.03 14.4 90% 73% 0.20
1982 HK Equity Nameson Holdings Ltd 27% 0.18 0.11 0.15 0.19 10.8 88% 35% 0.45
1 HK Equity CK Hutchison Holdings Ltd -16% 36.91 8.17 8.94 10.08 9.8 87% 11% 0.97
2628 HK Equity China Life Insurance Co Ltd -20% 1.51 0.79 1.07 1.28 18.8 82% 27% 0.93
293 HK Equity Cathay Pacific Airways Ltd -24% 1.53 0.14 0.12 0.33 84.0 80% 56% 1.33
6881 HK Equity China Galaxy Securities Co Ltd -2% 1.37 0.56 0.67 0.77 10.3 80% 18% 0.70
308 HK Equity China Travel International Inv -35% 0.24 0.10 0.12 0.15 17.7 79% 21% 1.02
6030 HK Equity CITIC Securities Co Ltd -14% 2.11 1.08 1.35 1.61 11.5 74% 22% 0.65
665 HK Equity Haitong International Securiti -11% 0.62 0.36 0.47 0.58 9.0 73% 26% 0.45
511 HK Equity Television Broadcasts Ltd -20% 3.04 1.29 1.47 1.84 17.3 72% 20% 1.01
6837 HK Equity Haitong Securities Co Ltd -4% 1.83 0.93 1.14 1.32 11.6 72% 19% 0.73
6886 HK Equity Huatai Securities Co Ltd -19% 2.04 1.08 1.35 1.66 10.9 72% 24% 0.57
3908 HK Equity China International Capital Co -14% 1.38 0.70 0.84 1.07 12.9 70% 24% 0.65
17 HK Equity New World Development Co Ltd 7% 2.17 0.73 0.75 0.79 11.0 69% 5% 2.50
35 HK Equity Far East Consortium Internatio 10% 0.51 0.37 0.52 0.59 6.3 67% 26% 0.33
1776 HK Equity GF Securities Co Ltd -18% 2.28 1.22 1.46 1.74 11.0 67% 20% 0.67
410 HK Equity SOHO China Ltd 19% 0.13 0.08 0.10 0.12 38.1 63% 23% 2.03
1508 HK Equity China Reinsurance Group Corp -26% 0.25 0.15 0.19 0.21 9.5 63% 17% 0.69
369 HK Equity Wing Tai Properties Ltd 4% 0.82 0.31 0.31 0.36 15.0 62% 8% 1.93
HKL SP Equity Hongkong Land Holdings Ltd -11% 6.63 2.90 3.04 3.10 2.1 61% 3% 0.62
1880 HK Equity Belle International Holdings L -27% 0.72 0.41 0.47 0.46 9.0 60% 6% 1.71
322 HK Equity Tingyi Cayman Islands Holding -14% 0.35 0.26 0.35 0.40 26.9 60% 24% 1.52
1128 HK Equity Wynn Macau Ltd 41% 0.46 0.38 0.53 0.67 23.1 58% 33% 0.98
2899 HK Equity Zijin Mining Group Co Ltd 22% 0.10 0.10 0.16 0.19 15.1 57% 36% 0.66
Source: Bloomberg Finance L.P., DBS Vickers
27. Market Focus
2017 Strategy Outlook
Page 27
Consensus earnings growth forecasts by HSI member
HSI 2016 2017 2018 2017 2018
China banks BoCom HK3328 1.11 0.98 1.00 -12.1% 2.7%
BOC HK3988 0.69 0.65 0.67 -6.5% 3.7%
CCB HK939 1.12 1.04 1.07 -7.8% 3.7%
HK banks & BEA HK23 1.95 1.72 1.83 -12.1% 6.8%
financials BOCHK HK2388 2.53 2.44 2.66 -3.8% 9.2%
Hang Seng Bank HK11 14.22 9.05 9.79 -36.4% 8.2%
HSBC HK5 5.04 4.74 5.14 -5.9% 8.3%
HKEX HK388 6.70 5.71 6.25 -14.8% 9.6%
Insurance China Life HK2628 1.51 1.07 1.29 -28.8% 20.4%
Ping An HK2318 3.68 3.87 4.34 5.2% 12.2%
AIA HK1299 1.71 2.76 3.08 62.0% 11.4%
Telcos China Mobile HK941 6.54 6.49 7.00 -0.8% 7.9%
China Unicom HK762 0.54 0.32 0.50 -41.8% 57.9%
Oil PetroChina HK857 0.23 0.29 0.48 23.7% 66.6%
CNOOC HK883 0.56 0.66 1.02 nm nm
Coal China Shenhua HK1088 1.09 1.56 1.51 42.3% -3.0%
China Coal HK1898 0.75 0.80 0.88 5.8% 11.2%
Gas Kunlun Energy HK135 0.02 0.57 0.62 3223.5% 9.2%
Towngas HK3 0.63 0.60 0.62 -5.2% 4.0%
Power CLP HK2 6.20 4.95 5.08 -20.1% 2.6%
China Res Power HK836 2.10 1.67 1.64 -20.3% -2.0%
Power Assets HK6 3.62 3.56 3.63 -1.6% 1.9%
HK property MTRC HK66 2.22 1.63 1.65 -26.8% 1.5%
SHKP HK16 11.09 8.68 9.29 -21.7% 7.0%
Henderson Land HK12 6.46 3.04 3.12 -52.9% 2.5%
New World Development HK17 2.17 0.76 0.80 -65.1% 5.0%
Hang Lung Properties HK101 1.13 1.11 1.17 -1.9% 5.8%
Sino Land HK83 1.55 0.86 0.84 -44.6% -1.9%
China property COLI HK688 3.61 3.64 4.16 0.8% 14.3%
China Resources Land HK1109 2.59 2.86 3.25 10.3% 13.6%
Conglomerates China Resources HK291 (1.65) 0.64 0.71 -139.0% 10.1%
Citic Pacific HK267 1.58 1.55 1.72 -2.2% 11.0%
China Merchants HK144 1.55 1.58 1.69 2.1% 6.6%
Swire Pacific A HK19 8.93 5.66 5.72 -36.6% 1.0%
Wharf HK4 5.29 4.25 4.41 -19.6% 3.5%
Gaming Galaxy HK27 0.98 1.47 1.59 50.3% 8.0%
Sands China HK1928 1.40 1.57 1.71 11.9% 9.2%
Tech Lenovo HK992 0.60 0.47 0.53 -21.3% 11.6%
Tencent HK700 3.82 6.84 8.77 78.9% 28.2%
AAC Tech HK2018 2.53 3.64 5.13 43.7% 41.2%
Transport Cathay Pacific HK293 1.53 0.12 0.33 -92.1% 173.6%
Cosco Pacific HK1199 1.00 0.68 0.73 -32.5% 7.4%
Consumer Hengan HK1044 3.31 3.46 3.68 4.4% 6.3%
Belle Int'l HK1880 0.72 0.47 0.46 -34.6% -3.4%
Want Want HK151 0.32 0.31 0.32 -3.1% 2.3%
EPS growthEPS (HK$)
Sources: Bloomberg Finance L.P., DBS Vickers
29. Market Focus
2017 Strategy Outlook
Page 29
Sector weighting recommendations
Expect divergent sector performance again. Paper, steel &
aluminium, and gaming were best performing sectors in
2016, while airlines, power, and appliances were the
biggest laggards. We expect sector performance in 2017
will also be divergent, because of polarizing impacts from
our identified critical factors. Of the laggard sectors, we
believe non-bank financials, gas, China telecom, and
railways & construction have higher chance of catching up
in 2017. Meanwhile, we still see upside potential for steel
and oil among the top performing sectors. But we are less
upbeat on paper and gaming after their strong runs in
2016.
Sector performance in 2016
-30%
-20%
-10%
0%
10%
20%
30%
40%
50%
Airlines
CHPower
Appliances
Apparel
CHproperty
Water
Ports
Insurance
Alt.energy
Retailers
HKtelco
Gas
HKEXandbrokers
CHbrokers
Healthcare
Shipping
CHtelco
Tollroads
Railway&construction
HSCEI
HKutilities
Internet&software
Globalbanks
Food&beverage
Sportswear
HSI
CHbanks
Consumer(personal)
Exporters
HKproperty
Conglomerates
Cement
Coal
Autos
REITs
HKbanks
Textiles
Oil
Consumer(luxuries)
Hardware&components
Gaming
Steel&aluminium
Paper
Source: Thomson Reuters, DBS Vickers
Financials, telecom, and energy are underowned, but can
turnaround with right catalysts. We compiled cash and
sector allocation trends from China and Greater China
focused funds with a total AUM of around US$25bn. The
funds in our radar have been lowering cash positions from
Brexit to October, but cash positions are increasing since
November. Meanwhile, these funds have also increased
allocation to financials, industrials, and consumer staples.
On the other hand, IT, consumer discretionaries, telecom,
utilities, and real estate have seen allocation declines.
Compared to MSCI China’s weightings, these funds were
underweight in financials, telecom, and energy but
overweight in consumer and healthcare. We believe the
underweight sectors have potential to see better fund flows
as their earnings outlooks improve in 2017.
AUM weighted cash holding percentage
-
0.5
1.0
1.5
2.0
2.5
08-16 09-16 10-16 11-16
Avg % cash in porftolio
(%)
Sources: Asset management companies, DBS Vickers
30. Market Focus
2017 Strategy Outlook
Page 30
Average sector allocation of China focused funds and how they compare with MSCI China weightings
-
5.0
10.0
15.0
20.0
25.0
30.0
0.0
5.0
10.0
15.0
20.0
25.0
30.0
Informationtech
Financials
Cons.discretionaries
Industrials
Realestate
Energy
Cons.staples
Healthcare
Telecomservices
Utilities
Materials
Cash
Sep-16 Oct-16 Nov-16 MSCIChina Nov-16
(%) (%)
Sources: Asset management companies, DBS Vickers
Eight sectors are better positioned. At the start of 2017, we
recommend to be overweight in China banks, China
telecom operators, HK & global banks, oil, and China non-
bank financials. We also have a positive bias for China
materials, IT & software, and railway & construction. These
eight sectors are better positioned for expected critical
factors for share price performance this year. China banks,
non-bank financials, oil, and telecom are more non-
consensus calls, where institution holdings are also thin
compared to benchmarks.
Cautious on borrowers, commodity users, and property
related areas. Given the above ten critical factors, we prefer
lenders over borrowers. We also prefer reflationary plays
over companies that cannot pass on commodity costs. We
also fear de-rating for stable dividend or cash streams as
risk-free rates rise. We are also wary of property’s appeal as
an investment class. Hence we recommend to be
underweight in airlines, China property, HK property, HK
REITs, and HK telecom.
Multiple changes to our sector weightings. In this report, we
have upgraded China banks, telecom operators, railway &
construction, China power producers, and telecom
equipment. But we have lowered our weighting
recommendations for IT & software, apparel & sportswear,
gaming, HK retail, healthcare, and airlines.
31. Market Focus
2017 Strategy Outlook
Page 31
Summary of DBSV sector views
Sect or Change Weight ing Rat ionale
China banks upgraded Overweight Underowned; rising bond yields can help; reforms can improve asset quality
China telecom carriers upgraded Laggard; earnings growth can recover in FY17
HK and global banks Fed expectations have warmed; can benefit from steeper yield curves
Oil OPEC supply cut accelerates demand-supply equilibrium; reflation theme
Non-bank financials Rising bond yields to help insurance players; potential MSCI A-share inclusion
China materials Positive bias Higher confidence for SOE reform and supply cuts
IT, software, & e-commerce downgraded Better growth prospects than market; relatively well owned
Railway and construction upgraded Reflation boosts contract size given cost-plus model; stable infra spending
Apparel and sportswear downgraded Neutral Prefer sportswear companies; apparel and shoes still hit by e-commerce
China appliances USD strength is +ve; property slowdown and rising commodities are -ve
China coal SOE reform to help with supply; regulators are curbing coal speculation
China IPPs upgraded Potential positive tariff adjustment; gearing is an issue given rising rates
China retailers Prefer players with strong O2O initiatives or defense against e-commerce
China telecom equipment upgraded Potential start for 5G capex cycle in 2018 can be a growth catalyst
Textiles Most can benefit from CNY depreciation; prefer less exposure to US
China auto and parts Negative bias Tail end of tax benefit for local brands; prefer laggard premium brands
China F&B V aluations are pricey given slow growth; La Nina may help costs
Gaming downgraded Capital controls, USD strength, and property correction are -ve
Hong Kong retailers downgraded Rental cuts to help costs; but USD strength and negative wealth are -ve
Pharmaceutical + healthcare downgraded Pricing pressure still an issue; prefer services but valuation is not compelling
Environmental USD strength hurts USD borrowers; rising borrowing rates is also -ve
China airlines downgraded Underweight Hurt by oil price recovery, USD strength, and rising borrowing costs
China property Tightening measures, rising bond yields, and CNY depreciation are -ve
Hong Kong property Rising interest rates and new housing supply are risks
Hong Kong REITs V aluations at risk from rising risk-free rates
Hong Kong telecom Rising interest rates and competition remains tough; new iphone may help
Source: DBS Vickers
32. Market Focus
2017 Strategy Outlook
Page 32
2017F ROE vs. 2016 P/BV by sector
China banks
Insurance
China property
Environmental
Rail & constr
Apparel and footwear
China auto and parts
China IPPs
China materials
China telecom carriers
HK banks
HK property
HK telecom
Pharma & health
China coal
China F&B
Oil
China retail
China Telecom
equipment
China Broker
(0.5)
0.0
0.5
1.0
1.5
2.0
2.5
3.0
3.5
0.0 2.0 4.0 6.0 8.0 10.0 12.0 14.0 16.0 18.0 20.0
(2016P/Bx)
(2017F ROE %)
2016-2018F earnings CAGR vs. 2016F PE by sector
China banks
Insurance
China property
Environmental
Rail & constr
Apparel and footwear
China auto and parts China IPPsChina telecom equip
Gaming
HKbanks
HKproperty
HKtelecom
Pharma & HealthTextiles
China coal
HKretail
China brokers
Internet and software
0.0
10.0
20.0
30.0
-20.0% -10.0% 0.0% 10.0% 20.0% 30.0% 40.0%
EPS CAGR 2016F-2018F
(2016 PER x)
Source: Bloomberg Finance L.P., DBS Vickers
33. Market Focus
2017 Strategy Outlook
Page 33
Sector valuations vs. market valuations
China banks PB / HSI PB China property PB / HSI PB
0.5
0.6
0.7
0.8
0.9
1.0
1.1
1.2
1.3
10 11 12 13 14 15 16
China banks / HSI 2yr mean
+2 stdev -2 stdev
x
0.3
0.4
0.5
0.6
0.7
0.8
0.9
1.0
1.1
08 09 10 11 12 13 14 15 16
China Property / HSI 2yr mean PB
-2 stdev +2 stdev
x
China brokers PE / HSI PE China insurance PE / HSI PE
0.5
1.0
1.5
2.0
2.5
3.0
3.5
4.0
Jan-12 Jan-13 Jan-14 Jan-15 Jan-16
China Brokers / HSI 2yr mean PE
-2 stdev +2 stdev
x
0.0
0.5
1.0
1.5
2.0
2.5
3.0
3.5
Jan-10 Jan-11 Jan-12 Jan-13 Jan-14 Jan-15 Jan-16
Insurance / HSI 2yr mean PE
-2 stdev +2 stdev
x
China steel PB / HSI PB China cement PE / HSI PE
0.0
0.1
0.2
0.3
0.4
0.5
0.6
0.7
0.8
0.9
1.0
10 11 12 13 14 15 16
Steel/ HSI 2yr mean PB
-2 stdev +2 stdev
x
0.3
0.8
1.3
1.8
2.3
2.8
3.3
3.8
4.3
4.8
10 11 12 13 14 15 16
Cement / HSI 2yr mean
-2 stdev +2 stdev
x
Sources: Bloomberg Finance L.P., DBS Vickers
34. Market Focus
2017 Strategy Outlook
Page 34
Tencent PE / HSI PE Gaming PE / HSI PE
1.5
2.0
2.5
3.0
3.5
4.0
4.5
11 12 13 14 15 16
Tencent / HSI 2yr mean PE
-2 stdev +2 stdev
x
0.5
1.0
1.5
2.0
2.5
3.0
3.5
10 11 12 13 14 15 16
Gaming 2yr mean PE
-2 stdev +2 stdev
x
Water and environmental PE / HSI PE China department store PE / HSI PE
0.0
0.5
1.0
1.5
2.0
2.5
08 09 10 11 12 13 14 15 16
Water / HSI 2yr mean PE
-2 stdev +2 stdev
x
0.5
1.0
1.5
2.0
2.5
3.0
08 09 10 11 12 13 14 15 16
Dept Store / HSI 2yr mean
-2 stdev +2 stdev
x
China autos PE / HSI PE Apparel and footwear PE / HSI PE
0.0
0.5
1.0
1.5
2.0
2.5
3.0
08 09 10 11 12 13 14 15 16
Auto / HSI 2yr mean
-2 stdev +2 stdev
x
0.5
0.7
0.9
1.1
1.3
1.5
1.7
1.9
2.1
2.3
10 11 12 13 14 15 16
Apparel/ HSI 2yr mean
-2 stdev +2 stdev
x
Sources: Bloomberg Finance L.P., DBS Vickers
35. Market Focus
2017 Strategy Outlook
Page 35
HK property PB / HSI PB HK banks PB / HSI PB
0.40
0.45
0.50
0.55
0.60
0.65
0.70
0.75
08 09 10 11 12 13 14 15 16
HK Property / HSI 2yr mean PB
-2 stdev +2 stdev
x
0.90
0.95
1.00
1.05
1.10
1.15
1.20
1.25
1.30
1.35
1.40
06 07 08 09 10 11 12 13 14 15 16
HKbanks / HSI 2yr mean
+2 stdev -2 stdev
x
China telecom PE / HSI PE China oil and gas PE / HSI PE
1.0
1.2
1.4
1.6
1.8
2.0
2.2
10 11 12 13 14 15 16
China telecom / HSI 2yr mean
-2 stdev +2 stdev
x
(5.0)
0.0
5.0
10.0
15.0
20.0
25.0
10 11 12 13 14 15 16
Oil& Gas / HSI 2yr mean PE
-2 stdev +2 stdev
x
Luxury retailers PE / HSI PE China food and beverage PE / HSI PE
0.3
0.5
0.7
0.9
1.1
1.3
1.5
1.7
1.9
2.1
08 09 10 11 12 13 14 15 16
Luxury / HSI 2yr mean
-2 stdev +2 stdev
x
0.0
0.5
1.0
1.5
2.0
2.5
3.0
3.5
4.0
4.5
08 09 10 11 12 13 14 15 16
F&B / HSI 2yr mean PE
-2 stdev +2 stdev
x
Sources: Bloomberg Finance L.P., DBS Vickers
36. Market Focus
2017 Strategy Outlook
Page 36
Top picks
Adding BOC, Tencent, and Angang to top picks. Our top
picks to start the year are Angang Steel (347.HK), BOC
(3988.HK), China Life (2628.HK), China Unicom (762.HK),
CNOOC (883.HK), HSBC (5.HK), Kingsoft (3888.HK),
Nameson (1982.HK), Tencent (700.HK), and Value Partners
(806.HK).
We have added BOC as our China banking pick. BOC is
better positioned than peers for rising USD interest rates
and CNY depreciation. We also added Angang as a reflation
and SOE reform play. In addition, we are adding Tencent
back to our picks after the stock’s correction in 4Q16. To
make room for the new additions, we have taken out GF
Securities (1776.HK), Li Ning (2331.HK), and Xinjiang
Goldwind (2208.HK).
Our top picks:
Angang Steel (347.HK)
- We are positive on steel price outlook thanks to
expected supply cuts, global reflation trend, and
small net demand growth as infrastructure makes
up for property slowdown.
- We are more confident for supply cuts judging
from recent stringent environmental controls.
- Share price has been strong in the past few
months, but upside potential is still high compared
with mean valuations.
Bank of China (3988.HK)
- BOC has more overseas operations than other
Chinese banks. It can benefit more from USD
interest rate hikes and be less impacted by CNY
depreciation.
- Rising onshore bond yields can also help
profitability.
- China financials is already underowned by
institutions. Acceleration in reforms can help
improve quality of borrowers and long term asset
quality outlook.
China Unicom (762.HK)
- China telecom operators have lagged the market
due to earnings declines in 2015 and 2016.
- We expect earnings growth to resume in 2017 and
2018, as tower sharing cost savings improve. The
stock scored high in our earnings outlook screen.
- We expect the telecom sector to be a focus area
for SOE reform. SOEs dominate the industry, but
returns on capital are less than optimal. Potential
mixed ownership reform, asset restructuring, or
mergers can help re-rate Unicom, where low
profitability has been a cap on valuations.
- Unicom is a higher risk pick that can underperform
if SOE reforms do not materialize. China Mobile
(941.HK, BUY) is a safer pick.
China Life (2628.HK)
- We like non-bank financials as an earnings
recovery play, along with oil, commodities, and
China telecom.
- Investment income can be helped by an A-share
market recovery. Tighter outbound capital controls
and property investment rules help equity market
outlook.
- China’s rising bond yields can also help life insurers.
CNOOC (883.HK)
- OPEC’s supply cut decision accelerates oil supply
and demand equilibrium to 1H17
- CNOOC is the most direct beneficiary to recovering
oil price among China’s oil majors.
- Recovering oil price should turnaround the
company’s expected loss in 2016 back to being
profitable in 2017 and 2018.
HSBC (5.HK)
- Share buybacks and dividend yield should limit
downside risk.
- HSBC can benefit from a faster Fed rate hike cycle
given Trump’s inflationary economic policies. ROE
re-rating in a higher interest rate environment can
be a catalyst.
- HSBC can also benefit from stock connect flows if
CNY depreciation pressure resumes under a more
hawkish Fed.
Kingsoft (3888.HK)
- We expect rapid core earnings growth thanks to JX
series’ online game and Kingsoft Cloud.
- Kingsoft is converting its flagship JX series into
mobile games. JX Mobile has been among top
grossing mobile games, and upcoming JX World
Mobile should also be well received.
- Kingsoft Cloud’s series D or IPO financing can be a
catalyst in the medium term.
Nameson (1982.HK)
- Nameson is one of the leading knitwear
manufacturers in China. Its product offerings
include sweaters, cardigans, pullovers, vests and
accessories.
37. Market Focus
2017 Strategy Outlook
Page 37
- Undervalued Uniqlo play. Nameson should benefit
from Uniqlo’s China expansion plans and its
intention to source more from Vietnam.
- Company can benefit from CNY depreciation.
- We expect FY16-18 EPS to expand by 19% CAGR
thanks to capacity expansion and further margin
improvement as Vietnam plants increase their
utilization.
Tencent (700.HK)
- Valuations are more appealing after correcting in
4Q16. Tencent should appeal to investors
preferring new economy China holdings.
- We foresee Tencent can better monetize its
>800m users through new ad offerings and new
apps. New advertising offerings help drive revenue
growth; Tencent only has 5% market share in
online ads.
- Mobile gaming revenues are counter-cyclical; new
gaming strategy focusing on games with
intellectual properties and mobile games should
drive gaming revenue growth.
Value Partners (806.HK)
- The market correction in 4Q16 knocked off 2016
performance fees. But market earnings recovery
can help drive market recovery to help 2017
performance fee outlook. Potential MSCI A-share
inclusion can also help.
- We expect VP can re-rate in P/AUM terms as its
return on AUM increases on the back of
performance fee increases, similar to what we saw
in 2010 and 2014-1H15.
- HK property tightening measures lower HK
property investment appeal, which can help asset
managers.
38. Market Focus
2017 Strategy Outlook
Page 38
Valuation table for our Top Ten Picks
Closing DBSV Tgt
Ticker price rating Price F Y16F F Y17F F Y16F F Y17F F Y16F F Y17F F Y16F F Y17F
Top picks (HK$) (HK$) (X) (X) (%) (%) (X) (X) (%) (%)
Angang Steel 347.HK 4.87 B 6.05 23.3 21.7 3.1 3.3 0.7 0.7 1.1 1.2
Bank of China * 3988.HK 3.50 NR 4.34* 5.5 5.4 12.7 11.8 0.7 0.6 5.5 5.5
China Life Insurance * 2628.HK 21.10 NR 24.9* 27.2 20.3 6.3 8.3 1.6 1.5 1.4 1.7
China Unicom 762.HK 9.21 H 9.20 119.9 30.8 0.7 2.8 0.9 0.9 2.1 2.1
CNOOC * 883.HK 9.96 NR 10.9* 464.7 15.1 -0.1 9.3 1.1 1.0 2.9 3.4
HSBC * 5.HK 63.90 NR 58.7* 14.7 13.1 6.0 6.7 0.9 0.9 6.1 5.8
Kingsoft Corp 3888.HK 16.62 B 23.00 40.4 17.9 -2.4 12.7 2.5 2.2 0.7 0.7
Nameson Holdings Ltd 1982.HK 1.69 B 2.20 10.9 9.6 26.1 28.6 3.9 1.9 4.7 3.7
Tencent 700.HK 193.3 B 238.0 34.8 27.6 29.1 29.8 10.2 7.9 0.3 0.4
Value Partners 806.HK 6.36 B 8.93 75.7 14.8 4.2 20.7 3.3 2.8 1.6 3.8
Simple av erage 81.7 17.6 8.6 13.4 2.6 2.1 2.6 2.8
PBVPER ROE Div y ield
* consensus estimates and target prices
Source: DBS Vickers, Thomson Reuters
Relative performance of top ten pick vs. HSI Top ten pick performance relative to HSI
70
80
90
100
110
120
130
140
150
160
Jan/14 Jul/14 Jan/15 Jul/15 Jan/16 Jul/16 Jan/17
DBSV top picks HSI
(28 Feb 2014 = 100)
(10.0)
(5.0)
-
5.0
10.0
15.0
20.0
25.0
30.0
Jan/14 Jul/14 Jan/15 Jul/15 Jan/16 Jul/16 Jan/17
DBSV top pick relative performancevs. HSI
(28 Feb 2014 = 0)
(%)
Sources: Thomson Reuters, DBS Vickers
39. Market Focus
2017 Strategy Outlook
Page 39
Market outlook and valuations
Expect a choppy start to the year. We expect a choppy start
to 2017, as CNY depreciation, Trump policy uncertainty,
USD strength, and a more hawkish Fed remain as overhangs.
But market sentiment and news flow should improve as we
near 2Q17. Earnings recovery is a key positive theme for the
market, and confidence for recovery can increase with
upbeat earnings and updates during results season. MSCI A-
share inclusion can also boost A-share outlook and non-
bank financials if we see changes to QFII repatriation rules.
Meanwhile, there should be more clarity on Trump policies,
Fed stance, and Euro viability by 2Q17.
Valuations remain appealing; earnings recovery to be key
catalyst. Market valuations in price to book terms are still
near trough levels. This limits downside risk. Meanwhile,
earnings growth recovery from reflation, rising lending rates,
and low base comparison can drive re-rating. Our year end
HSI target of 24,600 is based on 11.5x forward PE, while
our HSCEI target is 10,900 based on 8.6x.
Notable events in 2017
Date Ev ent Potential impacts
1 Jan, 2017 Renewed annual quotas for
forex purchase
Chinese individuals' US$50,000 annual quota for buying foreign currency is
refreshed. This can spur faster decline in China's foreign reserves in 1Q17.
20 Jan, 2017 Donald Trump inauguration More clarity on what Trump's policies will be. Infrastructure plan and Sino-US policy
stance are some of the areas to look out for, as they can impact commodities and
exporters listed in HK.
Feb-Apr, 2017 2016, 1Q17 results Oil, commodities, gaming, China insurance, and China telecom are some sectors that
can see 2017 earnings growth recovery. 1Q17 results can increase market
conviction.
Early Mar, 2017 Fifth session of the 12th NPC We expect policy makers to reiterate and accelerate SOE reform, OBOR, and key
targets of China's 2016-2020 five year plan.
14-15 Mar, 2017 FOMC March meeting Markets are adjusting to 3 rate hikes as the base case for 2017. We expect the
market and related sectors to react if the Fed deviates from 3 rate hikes.
23 Apr, 2017 France presidential elections Marion Le Pen from populist party National Front is one of the front runners in the
election. Expect Euro weakness if Le Pen's victory chance increase, as Le Pen
advocates France to leave the common currency.
26-27 May, 2017 G7 summit in Sicily
Early to mid June,
2017
MSCI annual review We believe there is a 70% chance for MSCI to include A-shares in 2017. Chinese
regulators will need to relax QFII capital repatriation rules and reduce stock
suspensions. A-share inclusion guarantees passive fund inflows, which are welcome
given outflow pressure.
14-15 June,
2017
FOMC June meeting
1 July, 2017 Hong Kong new CE
7-8 July, 2017 G20 Hamburg summit First summit to be attended by Trump. CNY may strengthen leading up to the
summit.
Between 27 Aug
and 22 Oct, 2017
German federal election Populist movement traction is lower in Germany compared to France. But more
terrorist attacks may lend support to anti-immigration parties.
20-21 Sept, 2017 FOMC Sept meeting
Autumn, 2017 19th National Congress of the
Communist Party of China
Selection of new leadership until 2022.
13-14 Dec, 2017 FOMC Dec meeting
Source: Bloomberg Finance L.P., Xinhua, wikipedia, DBS Vickers
42. Market Focus
2017 Strategy Outlook
Page 42
Sector outlooks from the team
Sector outlooks in alphabetical order
Ne u tra l Top BUY(S): Li Ning (2331.HK) Least preferred: n.a.
Lead analyst: Alice Hui, +852 2971 1960, alice_hui@hk.dbsvickers.com
Ap p a re l a n d fo o twe a r
We remain cautious on the women's footwear players,
with the major ones continued to post negative same
store sales growth (SSSG). The low base effect has not
had any benefits to their sales momentum, with Belle's
latest quarterly SSS in fact showing further deterioration
vs previous quarter. We expect the structural downtrend
caused by competition from e-commerce and change in
consumer shopping preference will continue to plague
the sector's performance, and margin compression
stemming from deleveraging impact would continue.
Within the apparel and footwear segment, sportswear
remain the bright spot with continual positive sales
momentum. SSSG for most sportswear brands has been
maintained at the mid- to high single digit range during
3Q16. The broader athleisure trend should continue to
fuel demand for sportswear in the medium term.
Our top pick for the sector is Li Ning. Its 1H16
performance confirmed our view of a profit turnaround.
We expect sales growth to accelerate in 2H16 on new
store openings and ramping up of stores opened in late
last year. This, coupled with continual margin
improvement stemming from strong scale, cost control
and better product mix, should translate into stronger
earnings for 2H16 and into FY17.
Apparel & footwear sector 1yr forward P/E
Source: Thomson Reuters, DBS V ickers
0
5
10
15
20
25
30
Ja
n
-0
8
O
ct-0
8
A
u
g
-0
9
Ju
n
-1
0
A
p
r-1
1
Ja
n
-1
2
N
o
v-1
2
Se
p
-1
3
Ju
l-1
4
M
a
y-1
5
Fe
b
-1
6
D
ec
-1
6
x
Average:15x
Source: Thomson Reuters, DBS Vickers
43. Market Focus
2017 Strategy Outlook
Page 43
Sector outlooks in alphabetical order (con’t)
Ne u tra l Top BUY(S): Midea (000333.CH) Least preferred: GOME (493.HK)
Qingdao Haier (600690.CH)
Lead analyst: Mavis Hui, +852 2863 8879, mavis_hui@hk.dbsvickers.com
Ch in a a u to s a n d p a rts
Ne g a tive b ia s Top BUY(S): Brilliance China (1114.HK) Least preferred: n.a.
Lead analyst: Rachel Miu, +852 2863 8843, rachel_miu@dbs.com
Weaker CNY will benefit QD Haier and Midea, which have 30-
40% overseas revenue denominated in USD
Source: Bloomberg Finance L.P.
We are expecting an uptrend for the China home
appliance industry in 2H16 and 1H17 in the least, mainly
driven by the sustained industry recovery on low base.
Overall, we believe better product mix on the back of
consumption upgrade could continue to support gross
margin improvement of brand owners and
manufacturers, and largely offset possible raw material
cost uptrend into 2017. Better operating efficiencies
have also bolstered earnings, and we see further room
for improvement in 2017. We like leading brand owners
such as Midea and Qingdao Haier given their strong
brand equity, economies of scale, potential synergies
from recent acquisitions, as well as favorable currency
impacts. Haier Electronics could also benefit from the
industry recovery, as well as integration of GE appliance
unit (e.g. washing machines). As for retail platform
operators, we remain concerned about GOME's on-
going transformation costs for its sales network.
Source: CEIC
USD/CNY cross rate
Ch in a a p p lia n c e s
Monthly PV sales in ChinaWe maintain our neutral outlook on the mass market
auto brands and positive view on the luxury car segment.
We anticipate the new car models to drive volume sales
and earnings of the luxury car makers, especially
Brilliance China (1114 HK). For November 2016,
passenger vehicle sales growth slowed to 18% y-o-y,
compared to the robust sales expansion of 21%/30% in
October/September 2016. Auto parts sector is expected
to attract buying interest on share price weakness.
However, the uncertainty of the trade policy between
the US and China could affect the exports of automotive
parts to the foreign OEMs and hence may limit the
upside potential of the auto parts companies listed in
Hong Kong.
5.4
5.6
5.8
6.0
6.2
6.4
6.6
6.8
7.0
7.2
D
e
c-1
0
D
e
c-1
1
D
e
c-1
2
D
e
c-1
3
D
e
c-1
4
D
e
c-1
5
D
e
c-1
6
0.0
0.5
1.0
1.5
2.0
2.5
3.0
Jan Feb Mar Apr May Jun Jul Aug Sep Oct Nov Dec
2011 2012 2013
2014 2015 2016
m units
Source: Thomson Reuters, DBS Vickers
44. Market Focus
2017 Strategy Outlook
Page 44
Sector outlooks in alphabetical order (con’t)
Ne ga tive bia s Top BUY(S): China Food Least preferred: Nil
(506.HK)
Lead analyst: Alice Hui, +852 2971 1960, alice_hui@hk.dbsvickers.com
Sector PE
Source: Thomson Reuters, DBS Vickers
Looking into 2017, we expect improvement in topline
growth for Want Want, Tingyi, and China Mengniu, while
UPC may see some difficulties due to base effect on star
product launch of Xiaoming Classmate in Apr'15. On the
flip side, higher raw material costs from palm oil, PET, and
sugar, could limit gross margin upside as seen in the past
couple of years. Overall operating leverage should
improve as companies have focused on cutting
operating costs following slower topline in 2014-16.
The sector is trading at 20x FY17F PE, which presents
opportunities to buy after share price pullback in 4Q16.
We have a Buy rating on China Foods. Despite a lack of
earnings enhancement as expected for China Food's
bottling restructuring, we expect increased market
regions should improve the Company's overall
profitability in the longer run. We also expect kitchen
food asset restructuring could potentially be completed
in FY17F.
China F&B
5
10
15
20
25
30
35
40
Mar-13
Oct-13
Jun-14
Jan-15
Sep-15
May-16
Dec-16
HK-listed F&B Sector PE HSI PE
x
China prope rty Top BUY(S): CR Land (1109 HK) Least preferred: SOHO China (410 HK)
Unde rwe ight China Vanke-A (000002 CH)
Lead analyst: Carol Wu, +852 2863 8841, carol_wu@hk.dbsvickers.com
Discount to NAV (DBSV coverage)
Source: Thomson Reuters, DBS Vickers
We expect limited catalysts ahead in 1Q17. Sales growth
in 1Q is likely to slowdown given high base effect in
2016. Tightening measures are likely to remain in place
until property price growth is under control and
inventory level is building up again. Despite the latest
share price correction, developers' possible
disappointment in margins during reporting season and
conservative guidance for 2017 may lead to lower sector
valuation. However, we will consider sector valuation of
5.5x FY17 PE as good entry point. We like CR Land (1109
HK) for their higher earnings visibility and historical
trough level valuation. We expect Vanke A/H to
underperform due to asset restructuring overhang and
uncertainty on management reshuffle.
(80)
(60)
(40)
(20)
0
20
40
Oct-06
Mar-08
Sep-09
Feb-11
Aug-12
Jan-14
Jul-15
Dec-16
%
M
+2SD:-10.3%
+1SD:-25.4%
Mean:-40.6%
-1SD: -55.8%
-2SD: -71%
Source: Thomson Reuters, DBS Vickers
45. Market Focus
2017 Strategy Outlook
Page 45
Sector outlooks in alphabetical order (con’t)
Positive bia s Top BUY(S): CR Cement (1313.HK) Least preferred: Nil
Lead analyst: Addison Dai, +852 2971 1931, addison_dai@hk.dbsvickers.com
In 2017, we look for mild demand growth (steel: +0.8%;
cement: +1.2%) as incremental consumption from
infrastructure projects and urbanisation construction
could more than offset the slowdown in property
segment. Meanwhile, we expect supply side reform of
steel industry could materialise as the central
government prioritise deleveraging of supply glut
industries. We expect a better supply discipline for the
cement industry as well. In general, we expect
supply/demand dynamics of the basic material sector to
improve in the year ahead. Given the material prices has
been recovering since 2H16, good 1H17 earnings
prospects are expected.
China cement prices (PO 42.5. incl.VAT)
China ma te ria ls
200
250
300
350
400
450
Jan Feb Mar Apr May Jun Jul Aug Sep Oct Nov Dec
(Rmb/t)
2014 2015 2016
1,700
2,200
2,700
3,200
3,700
4,200
4,700
Jan
Feb
Mar
Apr
May
Jun
Jul
Aug
Sep
Oct
Nov
Dec
China HRC prices*
2012 2013 2014
2015 2016
(Rmb/t, incl.VAT)
46. Market Focus
2017 Strategy Outlook
Page 46
Sector outlooks in alphabetical order (con’t)
O ve rwe ig h t fo r Top BUY(S): China Mobile (941 HK) Least preferred: Nil
o p e ra to rs CCS (552 HK)
Lead analyst: Tsz Wang Tam, +852 2971 1772, tw_tam@hk.dbsvickers.com
Looking into FY17, the market will focus on the
development of Towerco, including its profitability and
valuation, as well as telecom operators' cost savings from
tower sharing. We expect that the market will start
pricing in Towerco's value separately due to (i) more
operational and financial disclosure through operators
as well as (ii) more market news on the potential
Towerco IPO. Note that CM, CT and CU have 38%, 28%
and 28% stake in Towerco respectively. We estimate
that Towerco's value will account for 20-45% of smaller
operators?valuation. We forecast that Towerco's
earnings will continue to improve in FY17 and FY18
through operating leverage and increasing tower
sharing ratio from 35-55% to 40-70%+. Overall, telecom
market competition remains more or less the same. We
expect CM to remain the leader in 4G era or even in 5G
era. CT will continue to deliver stable performance. On
the other hand, CU has stepped up customer acquisition
and network investment after Chairman WANG Xiaochu
joined the company in 3Q15. The earnings recovery is
slower than market expectation. As for telecom
infrastructure sector, we like CCS with growth supported
by (i) market share gain through Towerco set up, and
increasing collaboration between CT and CU, as well as
(ii) expansion into non-operator and opex market.
Ch in a te le c o m a n d e q u ip me n t
Source: Companies, DBS V ickers
% of shared towers
0%
10%
20%
30%
40%
50%
60%
70%
1H16 FY16 FY17 FY18
% of shared towers
Source: Thomson Reuters, DBS Vickers
47. Market Focus
2017 Strategy Outlook
Page 47
Sector outlooks in alphabetical order (con’t)
De pa rtme nt store s & Food re ta ile rs
Ne utra l Top BUY(S): Sun Art (6808.HK) Least preferred: Nil
Lead analysts: Mavis Hui, +852 2863 8879, mavis_hui@hk.dbsvickers.com
Department Stores - PE band
Source: Thomson Reuters, DBS Vickers
Platform operators like department stores and food
retailers should continue to see a challenging operating
landscape in 2017, inclusive of intensifying competition
from both online and offline players in China. Specifically,
department stores that mainly sell non-food
merchandises will still face more pressure from e-
commerce rivals and could lack re-rating catalysts in the
near-term. As e-grocery development in the PRC has also
started to steer ahead, Sun Art’s (No. 1 hypermarket play)
recent shift in its business strategies to more O2O
(online-to-offline) line ups should help last mile deliveries
and trim online losses. Afterall, strong grocery volume of
leading food retailers could sustain good bargaining
power over suppliers for more leeway on gross margins
to offset rising staff costs.
Food Retailers - PE band
30
80
130
180
230
280
330
Jan-09
Feb-10
Apr-11
Jun-12
Jul-13
Sep-14
Nov-15
Dec-16
28x
24x
20x
16x
12x
Total Market Cap (Rebased 1 Jan 09 = 100)
0
100
200
300
400
500
600
Jan-09
Feb-10
Apr-11
Jun-12
Jul-13
Sep-14
Nov-15
Dec-16
Total Market Cap (Rebased 1 Jan 09 = 100)
41x
34x
26x
19x
11x
Source: Thomson Reuters, DBS Vickers
48. Market Focus
2017 Strategy Outlook
Page 48
Summary of sector views (con’t)
Ne ga tive bia s Top BUY(S): Xinjiang Goldwind (2208.HK) Least preferred: Nil
Longyuan Power (916.HK)
Source: Company
Lead analyst: Addison Dai, +852 2971 1931, addison_dai@hk.dbsvickers.com
Environme nta l - Cle a n Ene rgy
Xinjiang Goldwind: PE chartWind power:
The NDRC (National Development and Reform
Commission) officially unveiled feed-in-tariff cut for 2018
wind power projects (those to be approved after 1
January 2018). The actual tariff trim for Tier I resource
zone is larger than expected (actual: Rmb0.4/kWh;
proposed: Rmb0.41/kWh), for Tier II (actual:
Rmb0.45/kWh; proposed: Rmb0.44/kWh), III (actual:
Rmb0.49/kWh; proposed: Rmb0.48/kWh) & IV (actual:
Rmb0.57/kWh; proposed: Rmb0.55/kWh) resource zone
are smaller than expected. The magnitude of the tariff
adjustment removes the overhang of wind farm
operators, and confirms the government’s supportive
policy which aims to improve high curtailment in Tier I
and promote wind capacity installation in Tier IV
resource zone. In 2017-18, we expect wind capacity
installation will be resilient ahead of the tariff cut. In
particular, we expect 2017 wind power installation will
recover from 2016’s low.
Nuclear power:
The 13th five-year plan for power industry announced in
November 2016 guides that feed-in-tariff of nuclear
power is to be adjusted upwards. This, to certain extent,
removes investors’ concerns about China’s nuclear
power tariff cut.
Source: Thomson Reuters, DBS Vickers
0
10
20
30
40
50
60
70
Aug-11
Feb-12
Aug-12
Feb-13
Aug-13
Jan-14
Jul-14
Jan-15
Jul-15
Jan-16
Jul-16
Dec-16
x
Avg:16.3x
+1SD:29.4x
-1SD:3.3x
Source: Thomson Reuters, DBS Vickers
49. Market Focus
2017 Strategy Outlook
Page 49
Sector outlooks in alphabetical order (con’t)
En viro n me n ta l - Wa te r
Ne g a tive b ia s Top BUY(S): Beijing Ent Water (371.HK) Least preferred: Nil
Lead analysts: Patricia Yeung, +852 2863 8908, patricia_yeung@hk.dbsvickers.com
Source: China Statistical Yearbook on Environment
Ministry of Finance intends to adopt public-private-
partnership (PPP) scheme mandatorily for sewage
treatment and municipal waste treatment projects. We
believe the PPP market will be more regulated with
better project quality. More transparent and objective
project evaluation will also encourage the participation
of the private sector in the PPP market. Although this will
also lead to keener competition or potential pressure on
IRR, project returns can be further enhanced through
efficiency improvement and provision of value-added
services. Beijing Enterprises Water has good potential to
increase its exposure in the PPP market due to its asset
light business model which allows it to minimize the
impact from potential downtrend in IRR and to earn
service/management fees.
Investment in treatment of environmental pollution
(10)
0
10
20
30
40
50
0
200
400
600
800
1,000
1,200
2
0
0
0
2
0
0
1
2
0
0
2
2
0
0
3
2
0
0
4
2
0
0
5
2
0
0
6
2
0
0
7
2
0
0
8
2
0
0
9
2
0
1
0
2
0
1
1
2
0
1
2
2
0
1
3
2
0
1
4
Investment in treatment of environmental pollution (LHS)
YoY growth (RHS)
RMB bn %
Ove rwe ight Top BUY(S): BOCHK (2388.HK) Least preferred:
HSB (11.HK)
Sector P/BV vs. Fed funds rateHong Kong banks will be a rare sector that can benefit
from a more hawkish Fed. The steepening yield curve is
also beneficial to banks. We expect the sector's NIM and
ROE to improve in a higher interest rate environment.
Asset quality remains a risk, especially for banks with
higher China exposure. But we believe HK mortgage loss
will be minimal given high downpayment requirements
imposed by the HKMA. We prefer larger HK banks like
Hang Seng (11.HK) and BOCHK (2388.HK).
Source: Thomson Reuters, CEIC, DBS Vickers
Hong Kong ba nks
0
2
3
4
6
7
1.0
1.5
2.0
2.5
3.0
3.5
01 02 03 04 05 06 07 08 09 10 11 12 13 14 15 16
Sector PB Fed funds rate (RHS)
x %
Source: Thomson Reuters, DBS Vickers