1. Food restriction (FR) is known to increase motivation, learning, and
even life span. A previous microarray study found fifteen genes up-
regulated upon food restriction.1 These fifteen genes suggest the
activation of a stress responsive pathway. Because these genes were
up-regulated in four different brain regions we believe they are part of
a more ancient pathway. In order to test this hypothesis we
investigated whether these genes are also induced in many tissue
types after food restriction. Additionally, stress has been studied as a
risk factor in psychiatric disorders.5 Stress activates the hypothalamic-
pituitary-adrenal (HPA) axis, another ancient responsive pathway.
Oxidative stress induces a change in expression of an array of genes,
including Bipolar candidate genes. This reactive oxygen species is
among the prominent endoplasmic stress inducers. The differential
regulation of endoplasmic reticulum (ER) stress induced genes
indicates that there is a link between endoplasmic reticulum stress
and Bipolar Disorder.
Introduction
GWAS Candidate Bipolar Gene List
Single Nucleotide
Polymorphism
Nearest Gene Gene Name Pvalue Odds Ratio
Craddock et al5
Rs12576775 Odz4 Protein Odd Oz/ten-m homolog 4 4.4 x 10⁻⁸ 1.14
Rs4765913 Cacna1c Calcium Channel, Voltage-
Dependent, L Type, Alpha 1C
Subunit
1.5 x 10⁻⁸ 1.14
Rs1064395 Ncan Neurocan 2.1 x 10⁻⁹
1.17
Rs10994359 Syne1 Spectrin Repeat Containing, Nuclear
Envelope 1
2.9 x 10⁻⁸ 1.10
Rs1012053 Dgkh Diacylglycerol Kinase 1.5 x 10⁻⁸ -
Food Restricted Induced Gene List
Gene Symbol Gene Name mPFC Acb Hyp VTA
Nutrient Regulated
Angptl4 Angiopoietin-like 4 2.78 2.3
0
2.90 3.08
Pdk4 Pyruvate dehydrogenase kinase,
isoenzyme 4
ns 1.9
6
2.21 2.17
Slc2a4 Solute carrier family 2 (facilitated glucose
transporter), member 4
UN ns 1.62 1.31
Slc39a4 Solute carrier family 39 (zinc transporter),
member 4
UN UN ns 2.27
Stress Responsive
Ada Adenosine deaminase 1.71 2.4
6
1.83 3.40
Arl4d ADP-ribosylation factor-like 4D ns ns 2.24 2.29
Arrdc2 Arrestin domain containing 2 1.63 2.0
4
2.46 2.62
Cdkn1a Cyclin-dependent kinase inhibitor 1a 1.44 ns 2.82 3.39
Fkbp5 FK506 binding protein 5 2.09 ns 2.75 2.10
Mertk C-mer proto-oncogene tyrosine kinase ns ns 1.47 2.01
Nfkbia Nuclear factor kappa light polypeptide
gene enhancer in B-cells inhibitor, alpha
ns 1.3
7
1.71 1.78
Sgk1 Serum/glucocorticoid regulated kinase 1 1.60 2.4
5
2.08 2.97
Sgk3 Serum/glucocorticoid regulated kinase 3 ns ns 1.81 2.67
Trp53inp1 Transformation related protein 53
inducible nuclear protein 1
1.60 ns 1.31 1.39
Tsc22d3 TSC22 domain family, member 3 1.68 1.8
6
1.87 2.05
Methods
RNA cDNA qPCR
RNA is isolated from various tissues within
the mouse. We isolate the RNA because
this allows us to see which genes are
actually being transcribed. Next, the RNA
is then converted to cDNA. The cDNA is
then quantified using qPCR.
Mice
For this experiment we had four cages of
mice: two male, two female. Each cage’s
food intake was measured for a few weeks.
Then two of the cages (one male, one
female) were food restricted for five days.
The food restricted diet is simply seventy
five percent of the cage’s normal food
intake. After the fifth day, the mice were
sacrificed. For this study we focused on
the kidney, the liver, the prefrontal cortex
and the nucleus accumbens. Tissues were
immediately placed on dry ice and then
stored in minus eighty degrees Celsius.
Conclusion
Bipolar Genomics Data
The across the board up-regulation that is being observed throughout
the brain regions, as well as throughout different cell types, leads one
to believe that these genes are, in fact, part of an ancient stress
responsive pathway, however there is not enough data yet to
definitively claim this. The data we do have shows an across the board
up-regulation of Angptl4, Mertk and Arrdc2, which hints that these
three genes are involved in some type of older stress responsive
pathway. Further testing needs to be done to confirm this claim and
also to begin to understand the other twelve genes on the list.
0
0.5
1
1.5
2
2.5
Veh Tun Thap H2O2
FoldChange
ER Treatment
Odz4 (n=3)
* P = 0.016
0
0.2
0.4
0.6
0.8
1
1.2
1.4
Veh Tun Thap H2O2
FoldChange
ER Treatment
Cacna1c (n=3)
# P = 0.072
Figure 8: Significant down-regulation of Odz4 and Cacna1c is induced by H2O2. The
N2a cell line was treated with various stressors. qPCR of Odz4 and Cacna1c was
performed (n=3). Odz4 Mean Fold Change: Veh = 1.0007, Tun = 1.3688, Thap =
0.8838, H2O2 = 0.3880. Cacna1c Mean Fold Change: Veh = 1.0155, Tun = 0.9816,
Thap = 0.5447, H2O2 = 0.2122.
*P = 0.015
0
0.5
1
1.5
2
2.5
3
3.5
Veh TUN THAP H202
FoldChange
ER Treatment
* P = 0.026* P = 0.026
Figure 6: Thapsigargin and H2O2 induce a down-regulation of Fkbp5
Using a N2a cell line, cells were treated with a vehicle, Tunicamycin, Thapsigargin ,
and H2O2. A qPCR was performed using the Fkbp5 gene. (n=6)
0
0.5
1
1.5
2
2.5
Veh Tun Thap H2O2
FoldChange
ER Treatment
Figure 7: Thapsigargin and H2O2 induce a down-regulation
of Ank3. The N2a cell line was exposed to various ER stress
inducers. Ank3 Mean Fold Change Veh = 1.0059, Tun =
0.7343, Thap = 0.3868, H2O2 = 0.1199
* P =0.0313
*P =
0.0066
0
5
10
15
20
25
Control Food
Restricted
Weight(grams)
Average Female Mouse Weight
Day 0
Day 5
0
5
10
15
20
25
30
Control Food
Restricted
Wieght(grams)
Average Male Mouse Weight
Day 0
Day 5
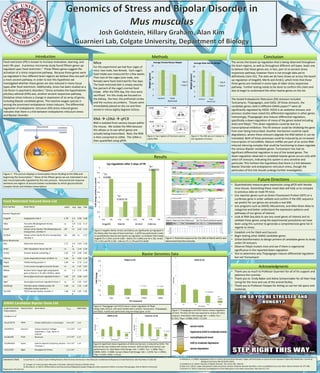
Results
0
0.5
1
1.5
2
2.5
3
3.5
4
4.5
5
Foldchange(relativetocontrol)
Up-regulation after 5 days of FR
CTL FR CTL FRCTL FRCTL FR
*p=
0.0386
*p=
0.003176
*p=
0.000743
Cdkn1aArrdc2MertkAngptl4
Figure 4: Angptl4, Mertk, Arrdc2 and Cdkn1a are significantly up-regulated in
the kidney after five days of food restriction. A qPCR was performed in order
to quantitatively measure each genes up-regulation, (n=4).Mean fold change;
Angptl4 CTL=1.0321 and FR=3.867. Mertk CTL=1.0040 and FR=1.783. Arrdc2
CTL=1.041 and FR=3.504. Cdkn1a CTL=1.178 and FR=4.8284.
Figure 5: Potential sequence for the GRE of Mertk which was
determined bioinformatically.
Future Directions
• Quantitatively measure gene expression using qPCR with female
mice tissues. Generating these novel data will help us to compare
to previous data on male FR mice.
• Use reporter genes such as Green Fluorescent Protein (GFP) or a
Luciferase gene in order validate and confirm if the GRE sequence
we predict for our genes are actually a real GRE.
• Use programs such as DAVID, Mousemine, and Allen Brain Atlas to
categorize and better understand the expression patterns and
pathways of our genes of interest.
• Look at RNA Seq data to see any novel genes of interest and to
validate these genes using the experimental procedures we have
been using this summer to generate a comprehensive gene list in
regards to stress.
The tested Endoplasmic Reticulum (ER) stressors included
Tunicamycin, Thapsigargin, and H2O2. Of these stressors, the
candidate genes cited in different GWAS papers5,6 were all
significantly regulated by H2O2. H2O2 is an oxidative stressor, and
previous studies have noted this differential regulation in other genes.
Interestingly, Thapsigargin also induces differential regulation,
specifically a down-regulation of many of the genes tested including
Ank3 and Fkbp5.7 This down-regulation could be due to a
transcriptional inhibition. The ER stressor could be inhibiting the gene
from ever being transcribed. Another mechanism could be rapid
degradation, where these stressors degrade the RNA before in can be
translated. Both of these processes could be induced by an increased
transcription of microRNAs. Mature miRNA are part of an active RNA-
induced silencing complex that could be functioning to down-regulate
the various Bipolar candidate genes. Tunicamycin has had no
significant differential regulation in any of the tested genes. The
down-regulation observed in candidate bipolar genes occurs only with
select ER stressors, indicating this system is very sensitive and
particular. This furthers the hypothesis that there is a link between
Bipolar Disorder and endoplasmic reticulum stress, though the
particulars of this link should undergo further investigation.
• Establish n=6 for Odz4 and Cacna1c
• Begin testing other GWAS candidate genes
• Utilize bioinformatics to design primers of candidate genes to study
under ER stressors
• Observe Fkbp5 mutant mice and see if there is organismal
significance in the reported down-regulation
• Test to determine why Thapsigargin induces differential regulation
but not Tunicamycin
Acknowledgments
• Thank you so much to Professor Guarnieri for all of his support and
patience this summer.
• Thank you to Cindy Baker and Adine Schoonmaker for all their help
caring for the mice and use of the animal facility.
• Thank you to Professor Hoopes for letting us use her lab space and
materials.
Literature Cited: 1) Guarnieri et. al. (2013): Gene Profiling Reveals a Role for Stress Hormones in the Molecular and Behavioral Response to Food Restriction. Biol Psychiatry 71:358-365
2) Lovinger, D: Communication Networks in the Brain. National Institute of Health online.
3) Zahuczky et. al. (2011): Differentiation and Glucocorticoid Regulated Apopto-Phagocytic Gene Expression Patters in Human Macrophages. Role of Mertk in Enhanced
Phagocytois. Plos One 6:6
4) Koliwad et. al. (2009): Angiopoietin-like 4 Is a Direct Glucocorticoid Receptor Target and Participates in Glucocorticoid-regulated Triglyceride Metabolism. Journal of
Biological Chemistry 284:38:25593-25601.
5) Craddock et al. (2013): Genetics of Bipolar Disorder. The Lancet 381: 1654-62
6) Sklar et al. (2011): Large-scale genome-wide association analysis of bipolar disorder identifies a new susceptibility locus near Odz4. Nature Genetics 43: 977-983.
7) Scharf et al. (2011): Expression and Regulation of the Fkbp5 gene in the adult mouse brain. Plos One 6:2 1-10
Figure 2: Four regions of the brain used to
isolate RNA.
Figure 3: The HPA axis as it relates to
the regulation of stress.
Figure 1: This picture displays a transcription factor binding to the DNA and
beginning the transcription.2 Many of the fifteen genes we are interested in are
also transcriptionally regulated by this very process. Glucocorticoid response
elements are regions of around sixteen nucleotides to which glucocorticoid
receptor binds and initiates transcription.
Fkbp5 (n=6) Ank3 (n=3)