IRF5 Promotes the Progression of Hepatocellular Carcinoma and is Regulated by...
Research Symposium Poster (Spring - April 2014)
1. Abstract & Background
Hypothesis:
• 5,6-EET-EA is anti-
inflammatory and will
inhibit IL-6, TNF-a and
IFN-g following LPS
stimulation.
Development of a Model to Assess the Anti-Inflammatory Potential of 5,6-EET-EA
William Parker1, John Stokes2 and Barbara L.F. Kaplan2
Department of Biological Sciences1, Department of Basic Sciences2, Mississippi State University, Mississippi State, MS 39762
Snider, N., Nast, J., Tesmar, L., Hollenberg, P. 2009; 75(4): 965-972
Greydanus, D., Hawver, E., Greydanus, M., Merrick, J. 2013: 1-11
Antibody Panels
After a 4hr stimulation with LPS , IL-6 and TNF-α were detected by flow
cytometry while IFN-γ was not detectable
The 2hr pre-incubation of CD11b+ cells resulted in a slight increase in
both macrophage population and CD11b expression
Stimulation of splenocytes with LPS resulted in an increased
expression of TNF-α while IL-6 only showed a slight increase of
expression
Cytokines IFN-γ and IL-10 were not used due to the lack of expression
of these molecules during the gated flow analysis
In future experiments, longer incubations of 5,6-EET-EA and LPS need
to be conducted in order to confirm 5,6-EET-EA’s anti-inflammatory
properties
Summary & Conclusions
Animals. Female C57BL/6 mice aged ~12 weeks
Spleen cell preparation. Spleens were removed from untreated mice and smashed with the blunt end of a 5-
ml syringe to release spleen cells (splenocytes). Cells were suspended in complete medium (RPMI containing
2% bovine calf serum, 1% penicllin-streptomycin and 50 µM 2-mercaptoethanol). Cells were counted using a
Coulter Counter and diluted to 1x10⁷ cells/ml. 100 µl of cells was placed into each well of a 96 well U-bottom
plate to yield 1x10⁶ cells/well.
Cell treatment. Cells were treated with various concentrations of 5,6-EET-EA or anandamide for 30 min at
37°C. Cells were then treated with 1 µg/ml lipopolysaccharide (LPS) to stimulate the macrophages. Then
cells were treated with 1:1000 dilution of brefeldin-A (BD Biosciences, San Jose, CA) to inhibit protein release
through the Golgi. Cells were incubated for 4 hours at 37°C.
Extracellular protein staining. Cells were washed with FACS buffer (1X Hanks Buffered Saline Solution, pH
7.4 plus 1% bovine serum albumin). Cells were incubated with “Fcblock”, an antibody directed against Fc
receptors in order to prevent non-specific antibody binding. Cells were then incubated with various antibodies
that were conjugated to fluorophores (“colors” to be detected by the flow cytometer). Two panels of antibodies
were used since no more than 4 colors can be detected by the instrument at one time. After incubation with
the antibodies, cells were washed then fixed with Cytofix (BD Biosciences). Fixed cells were stored at 4°C in
the dark overnight.
Intracellular protein staining. The next morning, cells were washed with Perm-Wash buffer (BD
Biosciences) and allowed to incubate in this buffer to help permeabilize the membrane so antibodies would
detect intracellular proteins. Cells were then incubated with various antibodies conjugated to fluorophores.
After incubation with the antibodies, cells were washed and directly analyzed using a BD FACSCalibur flow
cytometer (BD Biosciences).
Data analysis. Raw data from the flow cytometer was analyzed for % gated populations and mean
fluorescence intensity of protein expression using FlowJo (Treestar, Inc., Ashland, OR). Statistics and graphs
were calculated using Prism version 6.0 for Macintosh (GraphPad Software, Inc., LaJolla, CA). Means were
compared using ANOVA and differences were identified using either Dunnett’s or Bonferroni’s post hoc tests.
Percent gated data were transformed prior to analysis. A p value of < 0.05 was considered significant.
Panel 1
CD11b-FITC (FL1)
IFN-g-PE (FL2)
IL-6-APC (FL4)
Panel 2
CD11-FITC (FL1)
H2-Kb (mouse MHC class I)-PE (FL2)
IL-10-PECy7 (FL3)
TNF-a-APC (FL4)
Proteins in black are extracellular and are stained and fixed.
Proteins in grey are intracellular and are stained after fixed cells are permeabilized.
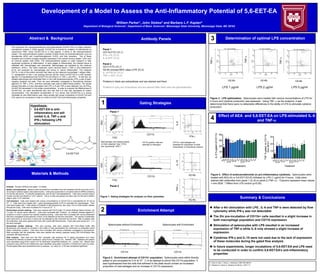
4 Effect of AEA and 5,6-EET-EA on LPS-stimulated IL-6
and TNF-a
Figure 4. Effect of endocannabinoids on pro-inflammatory cytokines. Splenocytes were
treated with AEA (A) or 5,6-EET-EA (E) followed by LPS (1 µg/ml) for 4 hours. Cells were
stained with antibodies from panel 1 (IL-6) or panel 2 (TNF-a). Columns represent mean values
+ one SEM. * Differs from LPS control (p<0.05).
3 Determination of optimal LPS concentration
Figure 3. LPS optimization. Splenocytes were treated with various concentrations of LPS for
4 hours and cytokine production was assessed. Using TNF-a as the endpoint, it was
determined that there were no detectable differences in the ability of LPS to stimulate cytokine
production.
2
Figure 2. Enrichment attempt of CD11b+ population. Splenocytes were either directly
plated or pre-incubated for 2 hr at 37°C in an attempt to enrich the CD11b population. It
was hypothesized that the cells that adhered to the plate would contain an increased
proportion of macrophages and an increase in CD11b expression.
1 Gating Strategies
Figure 1. Gating strategies for analysis on flow cytometer.
The compound 5,6- epoxyeicosatrienoic acid ethanolamide (5,6-EET-EA) is a highly selective
cannabinoid receptor 2 (CB2) agonist. 5,6-EET-EA is formed by oxidation of anandamide by
cytochrome P450. Since 5,6-EET-EA is a CB2 agonist, it works in the endocannabinoid
system. The endocannabinoid system consists of lipids known as endocannabinoids, such as
anandamide (AEA) and 2-arachidonylglycerol (2-AG), and their receptors. Two of these
receptors are G-protein coupled receptors expressed in the central nervous system (CB1) and
on immune system cells (CB2). The endocannabinoid system is under research to help
ameliorate symptoms of inflammation. In early stages of inflammation, the infected tissue is
infiltrated with macrophages and neutrophils. Macrophages are activated by the molecule
interferon-g (IFN-g). Two other molecules, tumor necrosis factor-a (TNF-a) and interleukin-6
(IL-6), are produced by macrophages and known to induce inflammation. The molecule
CD11b, is one of the protein subunits that make up the molecule macrophage-1 antigen (Mac-
1). Upregulation of mac-1 can prolong immune cell life. Since 5,6-EET-EA is a CB2 receptor
agonist, it is hypothesized that 5,6-EET-EA will inhibit IL-6, TNF-a, and IFN-g. To test this, we
isolated splenocytes and stimulated them in vitro with lipopolysaccharide (LPS), a part of gram
negative bacterial cell walls. Then we used antibodies conjugated to fluorophores directed
against IL-6, TNF-a, IFN-g, and flow cytometry was used to detect these proteins. The results
showed that after a 4-hour stimulation with LPS, IL-6 and TNF-a were detected, but not IFN-g.
5,6-EET-EA decreased IL-6 at certain concentrations. In order to compare the effectiveness of
5,6-EET-EA, we used anandamide also and saw that IL-6 was also decreased at certain
concentrations. This decreased concentration of IL-6 shows that 5,6-EET-EA is a strong
candidate for anti-inflammatory uses. More studies with longer incubations of 5,6-EET-EA and
LPS need to be conducted in order to confirm 5,6-EET-EA’s anti-inflammatory properties.
Panel 1
Macrophages are selected based
on their expected “size” (FSC)
and “granularity” (SSC)
CD11b positive cells are
selected by histogram
CD11b+ macrophages are
assessed for expression of other
extracellular or intracellular proteins
CD11b
IFN-g
IL-6
SSC
FSC
SSC
FSC
Panel 2
CD11b
H2-Kb
IL-10TNF-a
H2-Kb
Enrichment Attempt
CD11b CD11b
TNF-a
TNF-a
TNF-a
H2-Kb H2-Kb H2-Kb
LPS 1 µg/ml LPS 2 µg/ml LPS 5 µg/ml
N
ALPS
VHA0.01A0.02A0.1A0.2
A1
A2E0.01E0.02E0.1E0.2
E1
E2
0
10
20
30
40
Treatment
IL-6%gatedofCD11b
*
* * * *
N
ALPSA0.01A0.02A0.1A0.2
A1
A2E0.01E0.02E0.1E0.2
E1
E2
0
10
20
30
Treatment
TNF%gatedonCD11b
thenMHCI
*
Splenocytes without Enrichment Splenocytes with Enrichment
Materials & Methods
5,6-EET-EA