2. Journal of Dairy Science Vol. 98 No. 10, 2015
DETECTION OF AFLATOXIN IN MILK 6661
making is not strictly a formally regulated activity. Due
to the potential health hazard of aflatoxins, and AFM1
in particular, it is important to monitor and regulate
the levels of AFM1 in milk and milk products through
control of animal feed quality to ensure consumer safety
(Whitlow et al., 2010). Milk and derived products can
consequently be implicated in the spread of aflatoxins.
Therefore, most countries have established maximum
residue levels of AFM1 in milk, ranging from the 50
ng/L established by the European Union (EU; Euro-
pean Commission, 2006) to the 500 ng/L established
by US Food and Drug Administration (US FDA, 2012).
South Africa has established an acceptable level of
AFM1 in milk and milk products of 50 ng/L. However,
Egypt has decided on a zero-tolerance strategy to ensure
maximum consumer health protection at the expense of
milk and cheese producers (EOSQC, 1990; Amer and
Ibrahim, 2010). However, this target (0 ng/L) will be
difficult to achieve as long as aflatoxin contamination
in animal feed remains an issue.
Several methods of extraction and detection have
been used or developed for detection of AFM1 in milk
and dairy products during the past decade. It is impor-
tant to consider the type of matrix (fresh, stored, pas-
teurized milk, liquid or powder milk, cheese) because
this can affect the results (Chen et al., 2005). In addi-
tion, most commercial kits or rapid tests are designed
for a specific matrix, which makes the extraction of
mycotoxins and AFM1 from different matrices challeng-
ing and costly. The detection of AFM1 in milk or milk
products remains a challenge because of the typically
very low concentrations. Therefore, sensitive methods
are needed for extraction and detection. The most com-
mon analytical methods used for AFM1 determination
are thin layer chromatography (TLC), HPLC, and
ELISA. Among these, TLC is often used for routine
screening because it has many advantages: it is cheaper
than HPLC methods and does not require extensively
trained operators; however, it is less accurate than
HPLC (Gilbert and Anklam, 2002). Due to the low cost
and ease of use, TLC is the preferred detection method
in developing countries. Recently, several groups have
used ELISA for detection of AFM1, which is not only a
suitable tool for quick and sensitive analysis with high
sample throughput (Lee et al., 2004), but is also cost
effective and fast and requires only a small sample vol-
ume for analysis (Sherry, 1997). Most groups have used
A kit made by R-Biopharm (Darmstadt, Germany;
Sarimehmetoglu et al., 2004), part of the RIDAScreen
range of diagnostics tests. With all ELISA techniques,
a positive result needs to be verified by HPLC because
no ELISA method has been given AOAC International
approval (Henry et al., 2001). Another interesting ap-
plication using antibodies is the use of an immunochro-
matographic strip for detection of AFM1. Wang et al.
(2011) established a rapid competitive direct ELISA
and a gold nanoparticle/immunochromatographic strip
method for detecting AFM1 in milk and milk products.
The test uses monoclonal antibodies conjugated to col-
loidal gold particles that yield a visual pink band on
the strip upon reaction with immobilized aflatoxin M1-
BSA. Although this technology is a sensitive and rapid
assay (the whole analytical procedure can be completed
in 10 min because no sample treatment is required),
it can only give a positive or negative result. Several
kits for rapid testing are available on the market but
lack proper validation. Therefore, the aim of this study
was to analyze and evaluate the occurrence of AFM1
in milk samples from both commercial and subsistence
farms in semi-arid areas of Egypt and South Africa and
to evaluate the efficiency of different rapid kits and
techniques available on the market to determine the
best rapid test.
MATERIALS AND METHODS
Sampling
In this study, 138 fresh milk samples were collected
randomly from dairy farms between April and October
2013 in selected areas of Egypt (Governorate of Assiut)
and South Africa (Ngaka Modiri Molema District).
Fresh milk samples were obtained directly from cows
in sterile containers, transported in cooler boxes to the
respective laboratories, and stored in freezers at −20°C
until further analysis.
The research was approved after review by the Na-
tional Research Foundation in South Africa and the
Academy of Science in Egypt.
Aflatoxin M1 Extraction Procedures
In this study, the method used by Mwanza et al.
(2013) was used for AFM1 extraction using an immu-
noaffinity column (Biopharm R) as follows: 5 g of salt
(NaCl) was added to 50 mL of the milk sample and
mixed. The mixture was centrifuged at 2,000 × g for
10 min and the skim portion was filtered through a
micro fiber filter (Vicam/Waters, Milford, MA). Ten
milliliters of the filtered skim milk was passed through
the immunoaffinity column at a rate of 1 to 2 drops
per second until air came through the column. The col-
umn was washed twice with 10 mL of methanol:water
(10:90) solution. Aflatoxin M1 was then eluted with 2
mL of HPLC-grade methanol:acetonitrile (80:20) at a
rate of 1 to 2 drops per second. Extracts were dried
using nitrogen gas and stored in the freezer at −20°C
until further analysis by HPLC and ELISA.
3. 6662 MWANZA ET AL.
Journal of Dairy Science Vol. 98 No. 10, 2015
AFM1 Detection and Quantification
in Milk Samples by TLC
To confirm the presence of AFM1, milk samples were
extracted according to AOAC official method (AOAC
International, 2008; method no. 980.21). One hundred
milliliters of milk sample was centrifuged at 3,500 ×
g at 10°C, and the fatty layer was removed. Fifty mil-
liliters of defatted milk sample, 10 mL of salt solution,
and 120 mL of CHCl3 were mixed in a 250-mL separa-
tor (STS 200 system, Separator Technology Solutions,
Melbourne, Australia) for 60 s. The lower CHCl3 layer
was drained into a 125-mL Erlenmeyer flask. Then, 20
μL of AFM1 standard (100 μg/mL) and 20 μL of the
extracts were dispensed on TLC plates and 3 different
solvent systems—dichloromethane l:acetone:propan-2-
ol (85:10:5), diethyl ether:methanol:water (94:4.5:5),
and dichloromethane:acetone:methanol (90:10:2)—were
used for the detection of AFM1 on TLC (Mwanza et al.,
2013). In this study, the detection limit of AFM1 by
TLC was 350 ng/L.
Determination of AFM1 Using a Rapid Detection
Method (Strip Kits)
Aflatoxin M1 strip test kits (AuroFlow) were pur-
chased from Bioo Scientific (cat. no. 1101-01; Bioo
Scientific, Austin, TX). The assay was carried out by
adding 200 μL of milk sample, the positive control (milk
spiked with 1,000 ng/L of AFM1), and the negative
control (supplied by manufacturer) into reaction wells
containing lyophilized gold particles. Subsequently, af-
ter incubation of the plate of reaction wells for 4 min at
ambient room temperature, the strip was dipped into
the wells vertically. After 4 min, the strip was removed
and placed on a horizontal surface with the unmarked
side facing up. The strip was allowed to develop color
for 1 min after removing it from the well, and the test
results were determined visually (Figure 1). The detec-
tion limit of this strip was 500 ng/L.
ELISA
Commercial ELISA kits (RIDAScreen aflatoxin M1,
cat. no. R1101) were purchased from R-Biopharm. The
detection limit for milk samples was 5 ng/kg, with re-
covery rates of 95% for milk. All milk samples were
prepared and defatted using the method outlined in the
ELISA kits, as briefly described here. Twenty milliliters
of liquid milk was centrifuged at 3,500 × g at 10°C. The
fatty layer was removed and 100 μL of the defatted
milk was applied directly in the ELISA kit for AFM1
determination.
HPLC Analysis
The HPLC analysis of AFM1 was done according
to Bakirci (2001) and Manetta et al. (2005) using a
UHPLC system (Shimadzu, Kyoto, Japan) consisting
of liquid chromatograph (LC 20A) fitted to degasser
(DGU 20A3), auto sampler (injection; SIL 20A), com-
munications bus module (CBM 20A), column oven
(CTO 20A), photodiode array detector (SPD M20A)
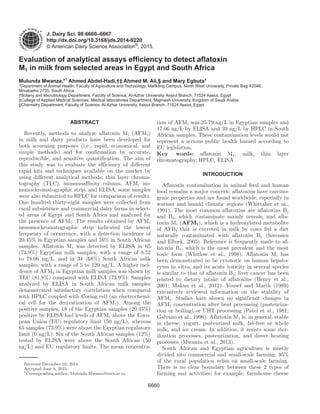
Figure 1. Illustration of aflatoxin M1 (AFM1) strip test results.
The assay used a competitive colloidal gold-based format. A T-line
(test) signal intensity that is stronger than that at the C-line (control)
indicates a negative result; a T-line signal intensity that is equal or less
intense than that at the C-line indicates the presence of 0.5 μg/L or
greater of AFM1 in milk. Color version available online.
4. Journal of Dairy Science Vol. 98 No. 10, 2015
DETECTION OF AFLATOXIN IN MILK 6663
and fluorescence detector (RF 10AXL), all connected to
a computer with Intel Core Duo processor and Micro-
soft XP (Microsoft Corp., Redmond, WA). The analysis
of AFM1, was done using a fluorescence detector (RF
10AXL) coupled to a reverse phase C18 column (Wa-
ters, Milford, MA) and a Coring cell (CoBrA cell; DR
Weber Consulting, Germany), an electrochemical cell
for the derivatization of AFM1. The mobile phase was
composed of HPLC-grade methanol:acetonitrile:water
(20:20:60) containing 119 mg of potassium bromide and
100 μL of nitric acid. Extracts were redissolved in 1
mL of HPLC-grade methanol, and 20 μL of the diluted
solution was injected in the HPLC. The HPLC condi-
tions were as follows: excitation at 362 nm and emission
at 440 nm, with a flow rate of 1 mL/min. Standard
AFM1 solutions of 0.5, 1, 2, 5, 10, and 20 ng/mL were
prepared in methanol (HPLC grade), and linearity was
achieved with a regression of 0.9987. The mean limit of
detection was 0.01 ng/mL.
Recovery and Statistical Analysis
For recovery validation, milk samples were spiked
with AFM1 at a single concentration of 100 ng/10 mL
as shown in Table 1.
Data obtained from this study were analyzed and
compared by t-test in Excel (Microsoft Corp.). Mean
values were deemed to be significantly different if the
level of probability was ≤0.05.
RESULTS
Table 2 compares the occurrence of AFM1 in tested
milk samples (88 from Egypt and 50 from South Af-
rica) using different analytical assays. The frequency
of AFM1 contamination in 88 milk samples from Egypt
was 20.45% (18 samples) by AFM1 strip; 81.8% (72
samples) by TLC; and 73.9% (65 samples) by ELISA.
In the 50 samples from South Africa, frequency of AFM1
contamination was 16% (8 samples) by AFM1 strip;
68% (34 samples) by HPLC; and 68% (34 samples) by
ELISA. Of the 4 methods used for analyzing AFM1 in
milk samples, the AFM1 strip had the lowest frequency
of occurrence with a detection incidence of 20.45% in
Egyptian samples and 16% in South African samples.
The lowest frequency of occurrence of AFM1 obtained
by AFM1 strip indicates the much lower sensitivity of
this method compared with the other methods.
Among positive samples, 18 of the Egyptian samples
(20.45%) by ELISA had AFM1 concentrations above
the EU regulatory level (50 ng/L), whereas 65 samples
(73.9%) had concentrations above the Egyptian regula-
tions (0 ng/L). Six of the South African samples (12%)
tested by ELISA had concentrations above the South
African and EU regulatory limits. The mean concen-
tration of AFM1 in Egyptian samples was 25.79 ng/L
(range: 8.52–78.06 ng/L), and that in South African
samples was 17.06 ng/L (range 5–120 ng/L) by ELISA
and 39 ng/L (range 8–93 ng/L) by HPLC (Table 3).
The standard curve for AFM1 detection by ELISA is
Table 1. Mean recovery of mycotoxin from milk by HPLC
Mycotoxin standard1
Spiked concentration
(ng/10 mL of milk)
Mean (±SD)
recovery (ng)
Percentage
recovery (%)
Aflatoxin M1 immunoaffinity column 100 9.8 (±1.3) 98
Aflatoxin M1 SPE (C18 column) 100 65 (±5.4) 68
1
Immunoaffinity column was from Bio-Pharm, ASA (Darmstadt, Germany); SPE (solid-phase extraction)
column was from ThermoScientific (Waltham, MA).
Table 2. Comparison between aflatoxin M1 (AFM1) strip, thin-layer chromatography (TLC), ELISA, and
HPLC results for detection of AFM1 in Egyptian and South African milk samples from rural and commercial
farms
Country Test run
No. of
samples
Positive,
no. (%)
Mean
(ng/L) SD
Egypt AFM1 strip1
88 18 (20.45) —
TLC 72 (81.8) —
ELISA 65 (73.9) 25.79 22.76
South Africa AFM1 strip 50 8 (16) —
ELISA 34 (68) 17.06 22.0
HPLC 34 (68) 39 27.2
1
Aflatoxin M1 strip test kits (AuroFlow) were purchased from Bioo Scientific (cat. no. 1101-01; Bioo Scientific,
Austin, TX)
5. 6664 MWANZA ET AL.
Journal of Dairy Science Vol. 98 No. 10, 2015
depicted in Figure 2. Absorption was inversely pro-
portional to the AFM1 concentration in the samples.
The calibration curve was virtually linear in the 0 to
80 ng/L range. The peak for AFM1 by HPLC was
obtained at a retention time of 7.68 min (Figure 3),
but, as expected, the retention time moved under the
influence of experimental conditions such as mobile
phase and HPLC room temperature variations. Eigh-
teen positive Egyptian samples (20.45%) and 8 positive
South African samples (16%) were identified by using
the strip analysis. The positive and negative controls
were evaluated and the results are shown in Figure 1.
DISCUSSION
Aflatoxin and aflatoxin M1 contamination in food and
milk remains poorly monitored and studied in develop-
ing countries and not much is known about the levels of
aflatoxins in milk from semi-arid areas of South Africa
and Egypt. In addition, several kits for rapid detection
and quantification of AFM1 in milk have been devel-
oped for the milk industry market for the detection and
quantification of AFM1 in milk. These kits and methods
must be validated to ensure their scientific use in de-
veloping countries for the monitoring of milk quality in
regard to AFM1 contamination. This is the first study
to evaluate the occurrence of AFM1 in milk samples
in semi-arid areas of 2 African countries with climatic
and environmental variations (Egypt and South Africa)
and to evaluate possible health risks for consumers in
regard to regulatory limits. Milk and dairy products
play an important role in a healthy human diet because
many people, especially children, frequently include
them in their diets (Baskaya et al., 2006). Parallel to
the increasing amount of milk and dairy product con-
sumption, studies on the presence of AFM1 in milk and
milk products have been increasing globally as well as
in Egypt and South Africa.
Table 3. Aflatoxin M1 levels in Egyptian and South African milk samples from rural and commercial farms as determined by ELISA and HPLC1
Country Test
No. of
samples
S <25 ng/L
(%)
25 < S < 50 ng/L
(%)
S > 50 ng/L
(%)
Range
(ng/L)
Egypt ELISA 88 22 (25) 25 (28) 18 8.52–78.06
South Africa ELISA 50 22 (44) 6 (12) 6 (12) 5–120
HPLC 50 22 (44) 5 (10) 7 (14) 8–93
1
S = number of positive samples.
Figure 2. Standard curve of aflatoxin M1 (AFM1) by ELISA.
6. Journal of Dairy Science Vol. 98 No. 10, 2015
DETECTION OF AFLATOXIN IN MILK 6665
Results obtained in this study showed a higher in-
cidence of AFM1 in Egyptian milk samples (73.9%)
than in South African milk samples (64%) by ELISA.
However, the AFM1 concentration range was smaller in
Egyptian milk samples (8.52–78.06 ng/L) than in South
African milk samples (5–120 ng/mL). These differences
are probably due to climatic and environmental varia-
tions and the type and quality of feed given to cows.
In general, our results are in agreement with previous
studies, which reported a high incidence of AFM1 and a
low concentration in milk and dairy products in devel-
oping countries from North and South Africa (Tomerak
et al., 2011; Dutton et al., 2012; Mwanza et al., 2013).
In Egypt, the contamination of milk by AFM1 ranges
from 40 to 66% (Salem, 2002; Motawee et al., 2009).
In South Africa, the frequency of contamination with
AFM1 is 86% in rural subsistence milk samples and
100% on commercial dairy farms by HPLC (Dutton et
al., 2012; Mwanza et al., 2013).
Most rapid screening methods rely on antibodies
(immunological assays) to detect mycotoxins and dif-
fer according to how the antibodies are used in the
assay. In our study, we used 2 basic techniques: ELISA
and immunochromatographic strips. These analytical
methods gave similar incidences but the AFM1 strip
method gave a much smaller range of contamination
than the ELISA, HPLC, and TLC methods (Table 1).
The red color of the test line in the strip disappeared
with the positive control sample, and the red color of
the control line in the strip disappeared with the nega-
tive control. All samples with AFM1 levels from 5 to 50
ng/L by ELISA were found to have 2 red lines (test line
and control line) on the AFM1 strip membrane. This
finding suggests an inconclusive result in the strip assay
(Figure 1) and such results were recorded as negative
samples in our study. However, all milk samples with
AFM1 concentrations varying between 50 and 120 ng/L
gave positive results. These results would be considered
false-positive if the EU regulation (50 ng) were consid-
ered but would be classified as false negative if the US
limit (500 ng/L) were considered. We concluded that
the AFM1 rapid test was not an ideal tool for milk
quality control as it might give false-positive results
when compared to other methods such as ELISA and
HPLC. Protein and fat contents of milk may influence
test results in various ways: sample flow can be altered
(e.g., fat content strongly affects viscosity) and any of
the milk components can may interact specifically or
nonspecifically with immuno-reagents used in the assay
(Anfossi et al., 2011).
In Egyptian milk samples, the results obtained
by TLC indicated a higher incidence of contamina-
tion (81.8%) compared with that detected by ELISA
(73.9%). This may be due to the use of an immunoaf-
finity column as a clean-up method of milk samples
before detection by ELISA. The ELISA method may
not be fully reliable due to cross-reaction interfer-
ences, especially at concentrations <50 ng/L, leading
to false-positive or false-negative results (Stark, 2010).
This might also explain differences between ELISA and
TLC results in Egyptian samples. Reports have shown
that the detection and quantification of AFM1 can be
done by separation using TLC or HPLC coupled with
fluorescence detector (Dragacci et al., 2001). In addi-
tion, in the current study, the TLC detection limit (350
ng/L) was lower than that of the strips (500 ng/L) and
Figure 3. Illustration of a chromatogram of aflatoxin M1 standard at 2 ng/mL (40 mL injection) on HPLC coupled to a fluorescence detector
connected to the Coring cell (CoBrA cell; DR Weber, Germany). Color version available online.
7. 6666 MWANZA ET AL.
Journal of Dairy Science Vol. 98 No. 10, 2015
higher than that of HPLC (10 ng/L). These results are
in line with the results obtained by Filazi et al. (2010),
who reported a much lower detection limit (20 ng/L)
for AFM1 by TLC.
A drawback of the TLC method is that precise de-
termination of mycotoxin concentrations is challenging
(Mwanza et al., 2012). A possible explanation of this
is that a large amount of an unknown compound had
some affinity to the antibodies directed against AFM1,
thus saturating the binding sites on the immunoaf-
finity column and reducing the binding capacity for
AFM1, resulting in decreasing elution and detection of
AFM1 and lowering the amount of the AFM1 extracted
(Mwanza et al., 2013). This problem can be solved by
using either TLC or HPLC with detection in the Co-
BrA cell (Coring cell). Shundo and Sabino (2006) found
no significant difference between the TLC and HPLC
methods when analyzing of 107 samples of raw, pas-
teurized, and UHT milk commercially available in São
Paulo and Marília (Brazil) for the presence of AFM1
after clean-up using an immunoaffinity column.
South African milk samples analyzed by ELISA
demonstrated a satisfactory correlation with samples
analyzed by HPLC coupled with a Coring cell. Over the
last 20 yr, the importance and application of immuno-
assays, especially ELISA, has grown significantly. The
ELISA method is not only suitable for quick and sensi-
tive analysis with high sample throughput (Lee et al.,
2004), but it is also cost effective and fast, and requires
only a small sample volume for analysis (Sherry, 1997).
Mwanza and Dutton (2014) reported that coupling
HPLC with Coring cell improved detection of AFM1 at
lower concentrations.
CONCLUSIONS
Although several methodologies for detection and
quantification of AFM1 have been developed, emerging
technologies for AFM1 detection are at various stages
in the progression to useful analytical tools. Although
TLC, HPLC, and ELISA are sufficiently developed for
field use, immunochromatographic strips are not able
to detect small quantities of AFM1 in milk samples
(i.e., below the detection limit). Despite these disad-
vantages, immunochromatographic strips continue to
advance. Strips can only be used to detect samples with
high levels of AFM1 contamination because of their
high detection limit (500 ng/L). The data obtained by
comparison of analytical methods should be useful to
scientists who need to select one analytical method to
detect AFM1 in milk samples. We recommend combin-
ing a screening test (immunochromatographic strip,
TLC, or both) with a confirmatory test such as HPLC
to ensure milk with low or absent levels of aflatoxins to
ensure consumer safety.
ACKNOWLEDGMENTS
We are very grateful to the Egyptian Academy of Sci-
ence (Cairo, Egypt) and National Research Foundation
(NRF; Pretoria, South Africa) for financial support as
a joint research grant under the South Africa/Egypt
Research partnership programme bilateral agreement
(2013-2014).
REFERENCES
Amer, A. A., and M. A. Ibrahim. 2010. Determination of aflatoxin M1
in raw milk and traditional cheeses retailed in Egyptian markets.
J. Toxicol. Environ. Health Sci. 2:50–53.
Anfossi, L., G. Arco, M. Calderara, C. Baggiani, C. Giovannoli, and
G. Giraudi. 2011. Development of a quantitative lateral flow im-
munoassay for the detection of aflatoxins in maize. Food Addit.
Contam. A Chem. Anal. Control Expo. Risk Assess. 28:226–234.
Bakirci, I. 2001. A study on the occurrence of aflatoxin M1 in milk and
milk products produced in Van province of Turkey. Food Contr.
12:47–51.
Baskaya, R., A. Aydin, A. Yildiz, and K. Bostan. 2006. Aflatoxin M1
levels of some cheese varieties in Turkey. Med. Welt 62:778–780.
Chen, C. Y., W. J. Li, and K. P. Peng. 2005. Determination of af-
latoxin M1 in milk and milk powder using high-flow solid-phase
extraction and liquid chromatography-tandem mass spectrometry.
J. Agric. Food Chem. 53:8474–8480.
Dragacci, S., F. Grosso, and J. Gilbert. 2001. Immunoaffinity column
clean-up with liquid chromatography for determination of aflatoxin
M1 in liquid milk: Collaborative study. J. AOAC Int. 84:437–443.
Dutton, M. F., S. de Kock, L. D. Khilosia, and M. Mwanza. 2012.
Mycotoxins in South African foods: A case study on aflatoxin M1
in milk. Mycotoxin Res. 28:17–23.
EOSQC (Egyptian Organization for Standardization and Quality Con-
trol). 1990. Maximum Limits for Mycotoxin in Foods. Part L Afla-
toxins E.S. 1875–1990. Egyptian Organization for Standardization
and Quality Control, Cairo, Egypt.
European Commission. 2006. Commission Regulation (EC) No
1881/2006 of 19 December 2006 setting maximum levels for certain
contaminants in foodstuffs. Off. J L364:5–24.
Filazi, A., S. Ince, and F. Temamogullari. 2010. Survey of the occur-
rence of aflatoxin M1 in cheezes produced by dairy ewe’s in Ufa
city, Turkey. Ankara University Fakutsi Dergisi 57:197–199.
Galvano, F., V. Galofaro, and G. Galvano. 1996. Occurrence and sta-
bility of aflatoxin M1 in milk and milk products: A worldwide
review. J. Food Prot. 59:1079–1090.
Gilbert, J., and E. Anklam. 2002. Validation of analytical methods
for determining mycotoxins in foodstuffs. Trends Analyt. Chem.
21:468–486.
Henry, S. H., T. Whitaker, I. Rabbani, J. Bowers, D. Park, W. Price,
and F. X. Bosch. 2001. Aflatoxin M1. (JECFA) 47. Joint FAO/
WHO Expert Committee on Food Additives (JECFA).
Lee, N. A., S. Wang, R. D. Allan, and I. R. Kennedy. 2004. A rapid
aflatoxin B1 ELISA: Development and validation with reduced ma-
trix effects for peanuts, corn, pistachio, and soybeans. J. Agric.
Food Chem. 52:2746–2755.
Makun, H. A., M. F. Dutton, P. B. Njobeh, T. A. Gbodi, and G. H.
Ogbadu. 2012. Aflatoxin contamination in foods and feeds: A spe-
cial focus on Africa. Pages 188–234 in Trends in Vital Food and
Control Engineering. Intech, Rijeka, Croatia.
Manetta, A. C., L. Di Giuseppe, M. Giammarco, I. Fusaro, A. Sim-
onella, A. Gramenzi, and A. Formigoni. 2005. High performance
liquid chromatography with post-column derivatisation and ultra
8. Journal of Dairy Science Vol. 98 No. 10, 2015
DETECTION OF AFLATOXIN IN MILK 6667
violet detection for sensitive determination of aflatoxin M1 in milk
and cheese. J. Chromatogr. A 1083:219–222.
Motawee, M. M., J. Bauer, and D. J. McMahon. 2009. Survey of afla-
toxin M1 in cow, goat, buffalo and camel milks in Ismailia-Egypt.
Bull. Environ. Contam. Toxicol. 83:766–769.
Mwanza, M., and M. F. Dutton. 2014. Occurrence of aflatoxin M1
from rural subsistence and commercial farms from selected areas
of South Africa. Food Contr. 39C:92–96.
Mwanza, M., N. Lubanza, M. Nyirenda, M. Lebohang, and F. Bakun-
zi. 2012. A decade of aflatoxin M1 surveillance in milk and dairy
products in developing countries (2001–2011): A Review. In My-
cotoxin and Food Safety in Developing Countries. 10.5772/53286.
Intech, Rijeka, Croatia.
Mwanza, M., O. M. Segwagwa, L. Ngoma, and M. Moratei. 2013.
Screening of milk contaminants at critical control points of the
milking machine in dairy parlour: Case of Molelwane dairy farm,
North West Province, South Africa. Life Sci. J. 10:2562–2568.
Patel, P. M., S. P. Netke, D. S. Gupta, and A. K. Dabadghao. 1981.
Note on the effect of processing milk into khoa on aflatoxin M1
content. Indian J. Anim. Sci. 51:791–792.
Salem, D. A. 2002. Natural occurrence of aflatoxins in feedstuffs and
milk of dairy farms in Assiut province, Egypt. Wien. Tierarz.
Monatsch. 89:86–91.
Sarimehmetoglu, B., O. Kuplulu, and H. T. Celik. 2004. Detection of
aflatoxin M1 in cheese by ELISA. Food Chem. 24:981–984.
Sherry, J. P. 1997. Environmental immunoassays and other bioanalyti-
cal methods: Overview and update. Chemosphere 34:1011–1025.
Shundo, L., and M. Sabino. 2006. Aflatoxin M1 determination in milk
by immunoaffinity column cleanup with TLC/HPLC. Braz. J. Mi-
crobiol. 37:164–167.
Sørensen, L. K., and T. H. Elbæk. 2005. Determination of mycotox-
ins in bovine milk by liquid chromatography tandem mass spec-
trometry. J. Chromatogr. B Analyt. Technol. Biomed. Life Sci.
820:183–196.
Stark, A. A. 2010. Mycotoxins: Molecular mechanism of detection of
aflatoxins and other mycotoxins. In Mycotoxins in Food, Feed and
Bioweapons. M. Rai and A. Varma, ed. Springer-Verlag, Berlin,
Germany. http://dx.doi.org/10.1007/978-3-642-00725-5-2.
Tomerak, R. H., H. H. Shaban, O. A. Khalafallah, and M. N. El Sha-
zly. 2011. Assessment of exposure of Egyptian infants to aflatoxin
M1 through breast milk. J. Egypt. Public Health Assoc. 86:51–55.
US FDA (Food and Drug Administration). 2012. Guidance for
industry: Action levels for poisonous or deleterious substances
in human food and animal feed. Accessed Jun. 13, 2015. http://
www.fda.gov/Food/GuidanceComplianceRegulatoryInformation/
GuidanceDocuments/ChemicalContaminantsandPesticides/
ucm077969.htm.
Wang, J. J., B. H. Liu, Y. T. Hsu, and F. Y. Yu. 2011. Sensitive com-
petitive direct enzyme-Weidenborner M. Mycotoxins and their me-
tabolites in human and animals. Springer Science+Business Media
LLC, New York, NY.
Whitlow, L. W., W. M. Hagler Jr., and B. A. Hopkins. 1998. Myco-
toxin occurrence in farmer submitted samples of North Carolina
feedstuffs: 1989–1997. J. Dairy Sci. 81:1189–1194.
Whitlow, L. W., W. M. Hagler, and J. R. Diaz. 2010. Mycotoxins in
feeds. Quality feed Mycotoxins. Feedstuffs 83.
Whittaker, T. B., J. W. Dickens, and F. G. Giesbrecht. 1991. Test-
ing animal feedstuffs for mycotoxins: Sampling, subsampling, and
analysis. Pages 153–164 in Mycotoxins and Animal Foods. J. E.
Smith and R. S. Henderson, ed. CRC Press, Boca Raton, FL.
Yousef, A. E., and E. H. Marth. 1989. Stability and degradation of
aflatoxin M1. Pages 127–161 in Mycotoxins in Dairy Products. H.
P. van Egmond, ed. Elsevier Applied Sciences, London, UK.