Published Paper (Potentials of Energy savings in Jordanian Residential sector)

This document presents a study on the potential energy savings from using a solar tracking system compared to a traditional stationary solar panel system in Jordan. An experimental setup was built using standard photovoltaic panels, with one panel on a tracking mechanism that adjusts the panel's position to follow the sun and one stationary panel. Data on energy output was collected from both panels over time. The results showed the tracking system increased energy output by 15-20% on average compared to the stationary system. A feasibility analysis estimated the net present value and projected annual energy savings and revenue from using the tracking system, finding it would be a financially beneficial investment over the system's 12 year lifetime.

Recommended
Recommended
More Related Content
What's hot
What's hot (20)
Viewers also liked
Similar to Published Paper (Potentials of Energy savings in Jordanian Residential sector)
Similar to Published Paper (Potentials of Energy savings in Jordanian Residential sector) (20)
Published Paper (Potentials of Energy savings in Jordanian Residential sector)
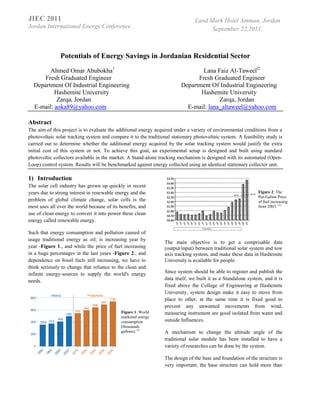
- 1. JIEC 2011 Jordan International Energy Conference Potentials of Energy Savings in Jordanian Residential Sector Ahmed Omar Abubokha1 Lana Faiz Al-Taweell2 Fresh Graduated Engineer Fresh Graduated Engineer Department Of Industrial Engineering Department Of Industrial Engineering Hashemite University Hashemite University Zarqa, Jordan Zarqa, Jordan E-mail: aoka89@yahoo.com E-mail: lana_altaweel@yahoo.com Abstract The aim of this project is to evaluate the additional energy acquired under a variety of environmental conditions from a photovoltaic solar tracking system and compare it to the traditional stationary photovoltaic system. A feasibility study is carried out to determine whether the additional energy acquired by the solar tracking system would justify the extra initial cost of this system or not. To achieve this goal, an experimental setup is designed and built using standard photovoltic collectors available in the market. A Stand-alone tracking mechanism is designed with its automated (Open- Loop) control system. Results will be benchmarked against energy collected using an identical stationary collector unit. Land Mark Hotel Amman, Jordan September 22,2011. 1) Introduction The solar cell industry has grown up quickly in recent years due to strong interest in renewable energy and the problem of global climate change, solar cells is the most uses all over the world because of its benefits, and use of clean energy to convert it into power these clean energy called renewable energy. Such that energy consumption and pollution caused of usage traditional energy as oil; is increasing year by year -Figure 1-, and while the price of fuel increasing in a huge percentages in the last years -Figure 2-, and dependence on fossil fuels still increasing, we have to think seriously to change that reliance to the clean and infinite energy-sources to supply the world's energy needs. The main objective is to get a comprisable data (output/input) between traditional solar system and tow axis tracking system, and make these data in Hashemite University is available for people. Since system should be able to register and publish the data itself, we built it as a Standalone system, and it is fixed above the Collage of Engineering at Hashemite University, system design make it easy to move from place to other, at the same time it is fixed good to prevent any unwanted movements from wind, measuring instrument are good isolated from water and outside Influences. A mechanism to change the altitude angle of the traditional solar module has been installed to have a variety of researches can be done by the system. The design of the base and foundation of the structure is very important; the base structure can hold more than Figure 1: World marketed energy consumption (thousands gallons). (1) Figure 2: The Per-Gallon Price of fuel increasing from 2003. (1)
- 2. 10 KG without failure or vibration, which make it a reliable system with low cost of maintenance. Tracker module movement is controls from tow axis such we can control the Altitude angle and Azimuth angle of the module, Altitude angle is controlled by an actuator and Azimuth is controlled by a belt drive motor; all motor and actuator are connected to a movement control circuit with (PIC). 2) Data Collection The Tracker module is tracking the sun movement every half hour, by the equations 1, 2, where these equations are came from the position of the sun at all day, and since the controller is discrete these equations can be generated, sun data are from http://sunposition.info, these equations are taken to program the PIC, the program is starting at 6:30 and ends at 16:43, which are the sunrise and Sunset, module will move 20 times a day to complete the movement of the sun, then back to the zero position, Zero position is when the module is facing the east with tilted 90°, that zero position chosen because the sun is in south and start rising from east to west, these equations is only valid for the date where we have taken the data and made the study, and it is easy to make it valid for hole year. y = -0.071x2 + 1.66x - 0.016 y = -0.019x3 + 0.57x2 + 2.25x + 113.85 The traditional photovoltaic stationary is installed to face the south and tilted 300 . The modules are installed in a shade-free location, and measuring devices are installed on module to measure the Radiation, current, voltage, modules temperature, ambient temperature, a data logger was used to save these data and make it available for people at the internet. 3) Data Results and Discussion Data are taken from data logger for one hour and The average Efficiency of the Fixed Module during the test hour 1:30 – 2:30 PM at 21/12/2010 is calculated and equals to 10.65 %, Energy Efficiency is the desired energy output per energy input, in our P.V system the input is the sun irradiance and the output is the Power, efficiency may affected by Temperature too. η = The Following equations used to find the inclined irradiance: Where: - α is the elevation angle - β is the tilt angle of the module measured from the horizontal. - The elevation angle has been given as: Where: - ϕ is the latitude - δ is the declination angle given as: Where d is the day of the year. From these equations a relationship between Smodule and Shoriz can be determined as: - Φ for Hashemite University = 32.5° - The day number is 355. - β = 30°. - The net cell area= 0.0155 m2 Table 1: Data Results at 21/12/2010. Time Efficiency (Fixed) Efficiency (Tracker) Power (Fixed) W.h Power (Tracker) W.h 13:30 6.98 11.75 2.6 4.35 13:35 7.52 12.38 2.64 4.39 13:40 7.99 12.99 2.7 4.41 13:45 8.49 13.63 2.74 4.43 13:50 8.95 13.94 2.8 4.43 13:55 9.38 14.3 2.86 4.4 14:00 9.92 14.69 2.93 4.4 14:05 10.13 14.85 2.99 4.4 14:10 10.84 15.56 3.03 4.4 14:15 14.04 19.33 3.07 4.32 14:20 14.7 19.88 3.11 4.25 14:25 14.5 19.41 3.17 4.27 14:30 15.04 19.52 3.25 4.28 Avg. 10.65 15.56 35.28 52.37 Equation 1: Motor Movement. Equation 2: Actuator Movement. Equation 3: Efficiency.
- 3. When the efficiency of the Fixed System is 10.65 (%) the efficiency can be founded for the Tracker module as: Output module Energy Efficiency Fixed: 35.3 (Watt.hour) 10.65 (%) Tracker 53.4 (Watt.hour) 15.81 (%) The modules (Tracker, Fixed) total output power from is (680 ,459 Watt ) and the power during test hour (1:30- 2:30 at 21/12/2010) equals to (52 , 35 Wh), so the difference power output from modules equals to (17.1 Wh), and since the module output at peak hour (which defined as The equivalent number of hours per day when solar irradiance averages 1,000 w/m2) is 90 watt, the difference should be multiplied by the (Peak hours of every month*no. of month days*1000Watt/m2 /Average irradiance) to get the monthly power which is (3.7 KWh/December) and vice versa for the all months, such that this difference power income is constant on the years, because the cells is the same and radiation is same on two modules for all the year, Table 2 shows the results. Table 2: Projected monthly deference power. Month no. of days Peaks (hours) monthly difference (KWatt.h) 1 31 2.70 3.68 2 28 3.70 4.55 3 31 5.00 6.81 4 30 6.80 8.96 5 31 7.80 10.62 6 30 8.40 11.07 7 31 8.20 11.17 8 31 7.50 10.21 9 30 6.40 8.44 10 31 4.80 6.54 11 30 3.60 4.74 12 31 2.70 3.68 Total income power in year 90.48 To complete feasibility study and draw a cash-flow we need to convert this power to money, we used the tables from electricity of Jordan, which in Table 3; and we have calculated the cost difference of tow modules; and we chose three cases to do our study on; Table 3: The Cost of Electricity in Jordan. Consumption (Kwh/month) Cost (J.D/Kwh) 1-160 0.033 161-200 0.072 200-300 0.072 + (0.005*consumption) 301-500 0.086 + (0.005*consumption) More than 500 0.114 + (0.005*consumption) The previous costs only the costs related to consumption rate, there are either Fixed costs monthly paid to Electricity Company, the total monthly fees and taxes is 3.33 J.D/Month. The monthly cost for the difference equal to: Case1: 0-160 KW.h Consumption: Here the cost is 0.033 J.D/Kw.h, and monthly fees are 3.33 J.D, this income can be calculated as: Difference Income = 0.033*Difference Power + 3.33*12 Case2: 161- 200 KW.h Consumption: Here the cost is compounded on the previous one, such that the consumption increased here, so the income can be as: Difference Income = (0.033*160) + (0.07*Difference Power) + 3.33*12 Case 3: More than 500 kw.h Difference income= (0.033*160) + (0.072*39) + (0.072*99+0.005*99) + (0.081*199+0.005*199) + 0.114*(Difference power+ 0.005*Different Power). Table 4: The revenues and costs throw life cycle. End of year Case1 (J.D) Case 2 J.D Case 3 (J.D) 0 -130 -130 -130 1-12 42.9 51.8 84.57 Cash-flow is drawn in Figure below. -130 0 1 2 3 4 5 6 7 8 9 10 11 12
- 4. The present worth comparisons are the most widely utilized methods. The present worth is a net equivalent amount at the present that represents the difference between the equivalent disbursements and the equivalent receipts of an investments cash flow for a selected interest rate. Present Worth should be calculated, where if: PW >= 0 the project is acceptable. PW < 0 the project is rejected. PW= -P + income * (P,A,MRR,n) P= initial Tracker Cost – initial Fixed Cost P= 629-499 =130 J.D Income = Tracker income – Fixed income, which discussed in cases above. MRR is the minimum attractive rate of return; the decision criteria discussed have the maximization of equivalent profit, given that all investment alternatives must yield a return that exceeds some minimum attractive rate of return. Which here taken by ‘what if my money where in bank not in the project’ and such that the MRR = 5% Expected life Cycle (n) of the modules is assumed to be 12 years such that the motor life cycle is around this value, and note that the motor and Jack can hold and rotate more than one panel, so the initial cost of the tracker module will decrease, such that the modules increased and vice versa the power output. (P/A,12,5) = 8.8633 So the present worth for the cases is: PW1 (12) = -130 +42.9 * (8.8633) = 250 J.D PW2 (12) = -130 + 51.8*(8, 8633) = 329 J.D PW3 (12) = -130 + 84.6*(8.8633) = 619 J.D The feasibility study above shows that the all cases are feasible since that the PW are positive in all cases, and therefore the case 3 is the most feasible. 4) Conclusion Total failures of PV systems are extremely rare. PV systems operate without fault. Most systems work for many years without developing costly faults or needing repairs. Photovoltaic systems have low maintenance requirements, however, periodic maintenance routines carried out by the system operator or the installation firm helps to avoid faults and long downtimes. 5) Recommendations We recommend making a comparison between three systems where the third one is closed loop control tracker. The systems have ability to be connected to internet and to be available for all. Wind mode for tracker should be installed to protect the module from high speed wind; the high wind mode protects panels from damaging winds and debris. to install wind mode we must install an anemometer on the module faced with the module face, and program the PIC if the wind speed increased by which may affecting on module to fracture or vibrate, the module moves in a direction that it is not facing the wind. Wind mode may increase the cost of the system but it sure protects it. Concentration of sun light can easily obtain using concentration lenses to focus large amount of sun rays on surface area which can increase the efficiency of the systems. While concentration produce more heat on the Photovoltaic cell we shall use a cooling system with it, cooling system is for avoiding the photovoltaic to reach the maximum operating temperature and in final the voltage drop status, cooling system can be designed to take the energy loss by heat. 6) References 1. Administration, U.S. Energy Information. International Energy Outlook 2010. U.S. Department of Energy. Washington : U.S. Energy Information Administration, july 2010. p. 338. 2. Evaluation of Solar Electric Power Technologies in Jordan. Omar Badran, Emad Abdulhadi, Rustum
- 5. Mamlook. s.l. : Al-Balqa Applied University, January 2010, Jordan Journal of Mechanical and Industrial Engineering, Vol. 4, pp. 121 - 128. 1. 3. Jordan Annual Climate Bulletin, JMD. Amman : Jordan Metrological Department, 2000. 4. NERC. Photovoltaic Systems. [Online] National Energy Researches Center (NERC). www.nerc.jo. 5. Availability of Solar Energu in Hashemite University. Issa Itier, Ali M.Jawarneh, Salem Nejmeh. Zarqa : International Conference of green energy, 2009. 6. Center, Space Environment. Studying the Sun. SOLAR PHYSICS AND TERRESTRIAL EFFECTS. s.l. : Space Environment Center, 3. 7. Resources, Ministry of Energy & Mineral. Annual Report. Amman/Jordan : Ministry of Energy & Mineral Resources , 2005. 8. Hyperphysics. Abundances of the Elements in the Earth's Crust. [Online] Georgia State Univ. http://hyperphysics.phy- astr.gsu.edu/hbase/tables/elabund.html. 9. OSHA, factsheet. crystalline silica exposure Health hazard information. U.S : Ocupetional sefty and health admenistration, 2002. http://www.osha.gov/OshDoc/data_General_Facts/cryst alline-factsheet.pdf. 10. Abu-Aisheh Engineering Company. Abu-Aisheh Engineering. [Online] PICO Technology. http://www.abuaisheh.com/. 11. KIPP and ZONEN Company. [Online] KIPP and ZONEN, 1830. http://www.kippzonen.com. 12. The feasibility study as a tool for venture analysis. Justis, R. T. & Kreigsmann, B. 1, 1979, Business Journal of Small Business Management, Vol. 17, pp. 35-42. 13. Solar Cogeneration. Engineers projects. [Online] http://www.eng.tau.ac.il/~kribus/SELab/projects/cogen. html.