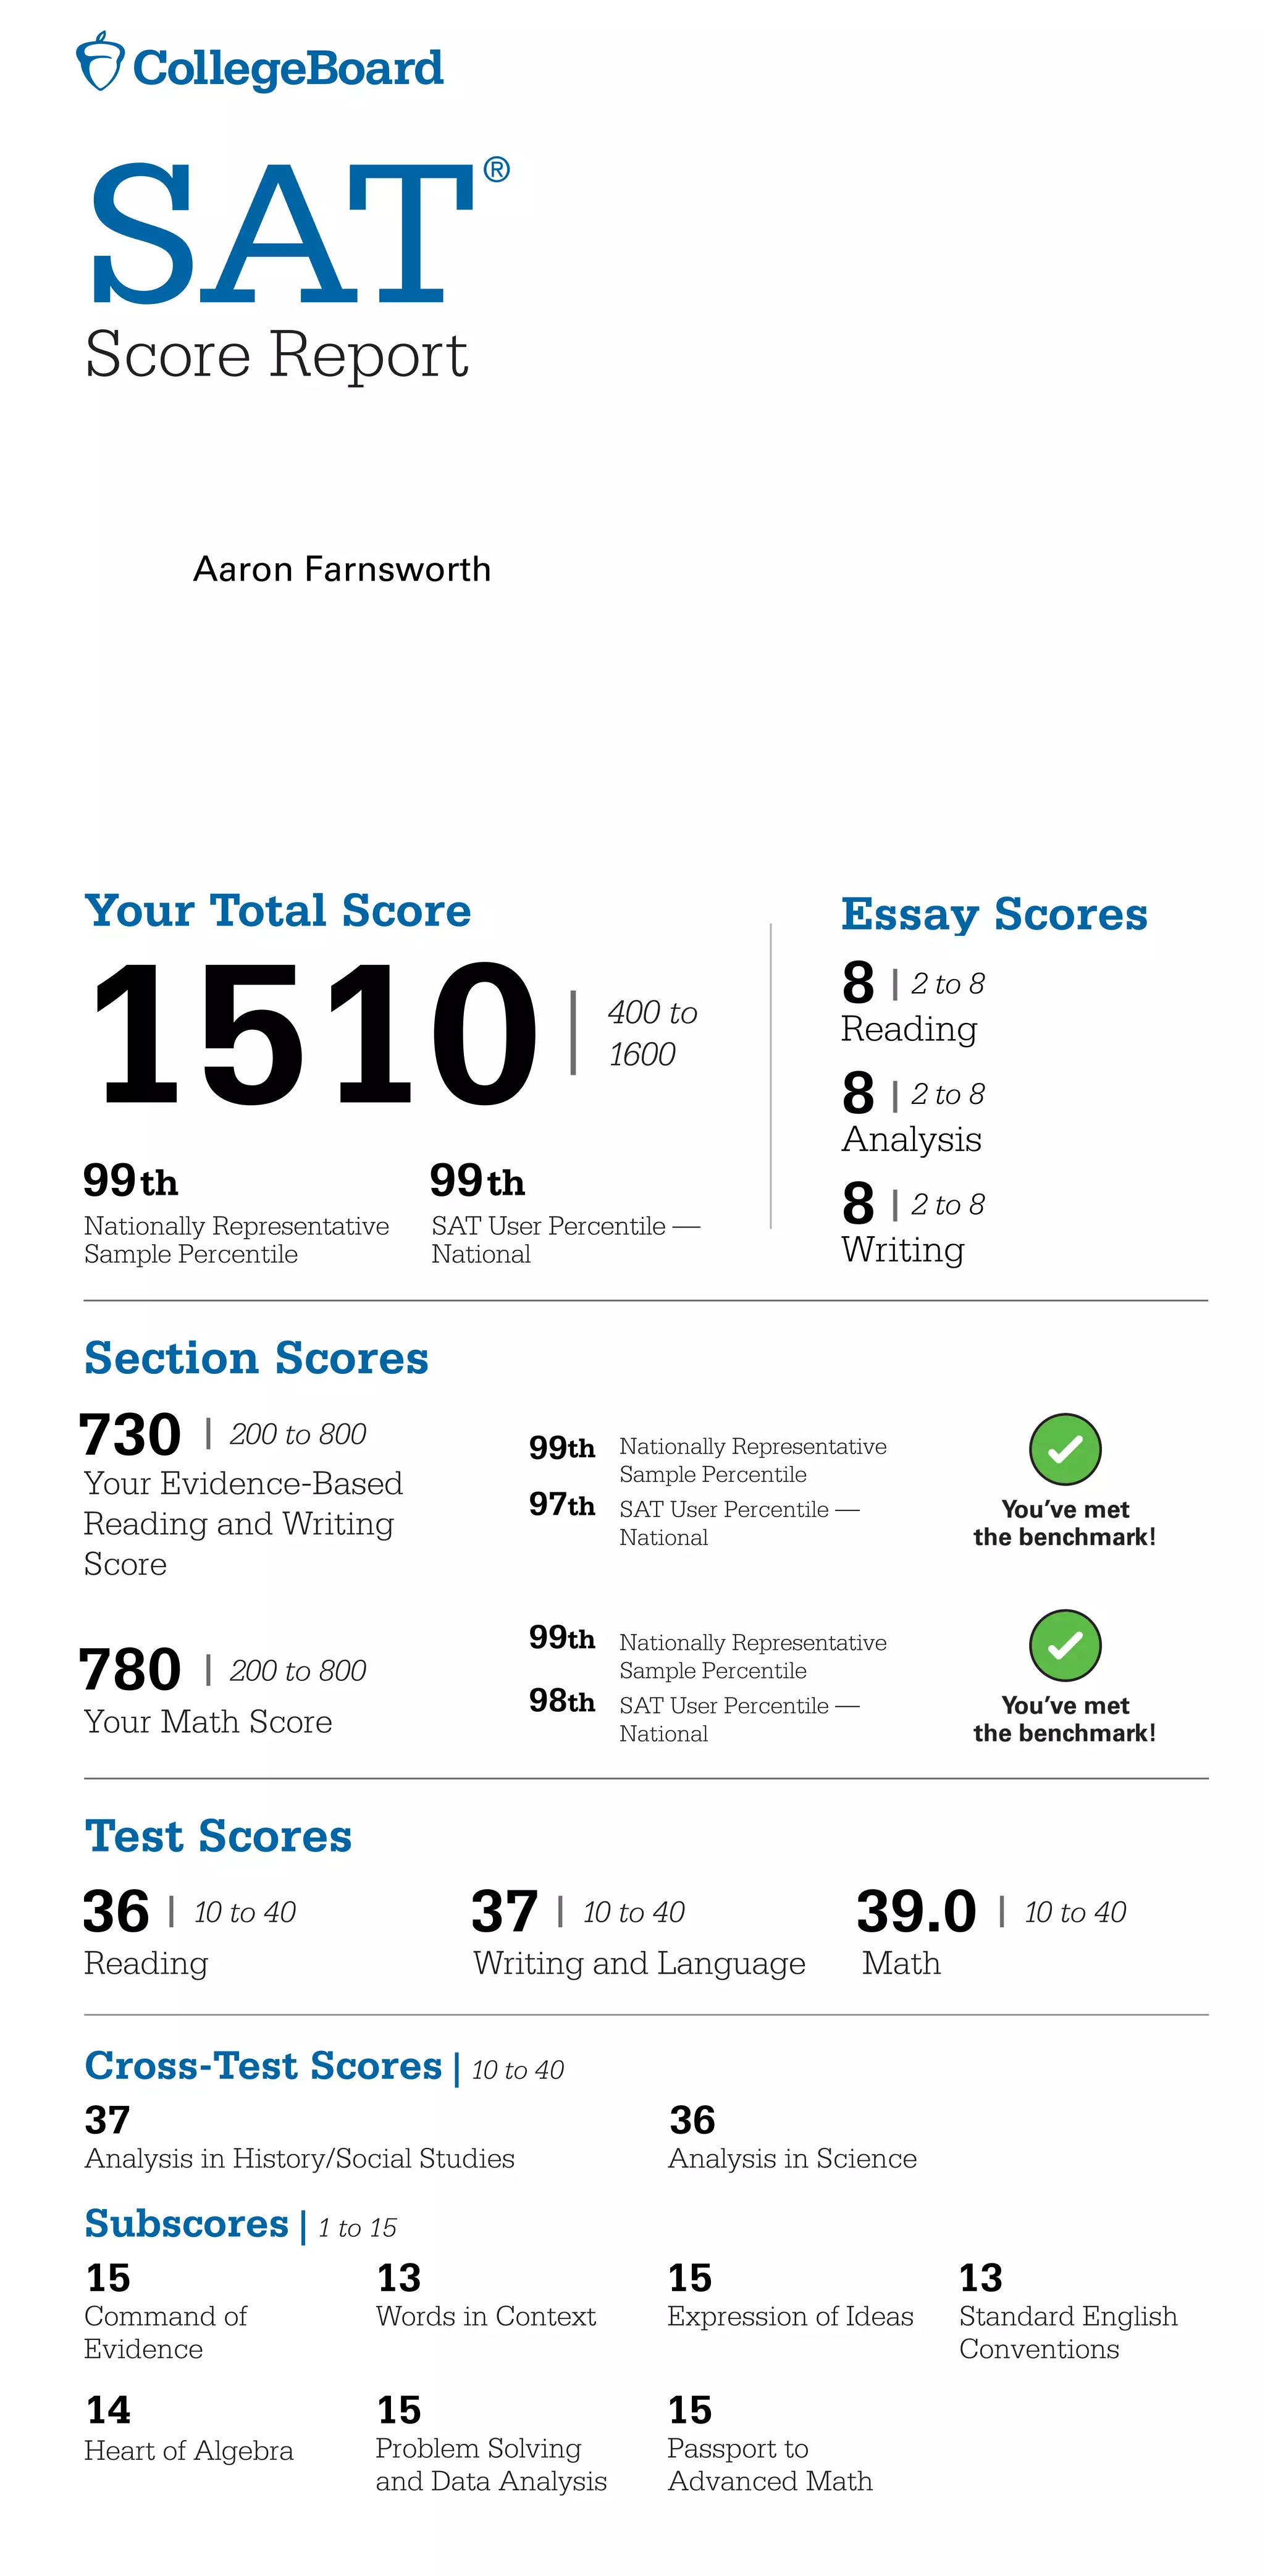
Test Scores
l 10 to 40
Reading
l 10 to 40
Writing and Language
l 10 to 40
Math
Your Total Score
400 to
1600
Nationally Representative
Sample Percentile
SAT User Percentile —
National
Get your full report online studentscores.collegeboard.org
Subscores | 1 to 15
Command of
Evidence
Heart of Algebra
Words in Context
Problem Solving
and Data Analysis
Expression of Ideas
Passport to
Advanced Math
Standard English
Conventions
Cross-Test Scores | 10 to 40
Analysis in History/Social Studies Analysis in Science
Section Scores
l 200 to 800
Your Evidence-Based
Reading and Writing
Score
l 200 to 800
Your Math Score
Nationally Representative
Sample Percentile
SAT User Percentile —
National
Nationally Representative
Sample Percentile
SAT User Percentile —
National
SAT
®
Score Report
Test Date:
Registration Number:
Sex:
Date of Birth:
Test Center Number:
High School Code:
High School Name:
Online Score Report
Go online to get more details about your performance,
including areas of strength, and check out the action
steps in Skills Insight to help you boost your college
readiness.
How Did I Score Compared to Others?
A percentile is a number between 1 and 99 that shows
how your score ranks compared to other students. It
represents the percentage of students whose scores
are equal to or below yours. For example, if your Math
score percentile is 57 that means 57 percent of test-
takers have Math scores equal to or below yours.
You’ll see two percentiles:
The Nationally Representative Sample Percentile
shows how your score compares to the scores of
all U.S. students in your grade, including those who
don’t typically take the test.
SAT®
User Percentile — National shows how your
score compares to the scores of students who
typically take the test.
Will My Scores Change and Why?
Tests are not exact measures, and many factors
can affect your score. After all, no two days are the
same, and if you took the SAT once a week for
a month your scores would change.
That’s why it helps to think of your true score as
a range from a few points below to a few points
above the score earned. Score ranges show how
your score can change with repeated testing,
assuming your skill level remains the same.
Usually, scores for Evidence-Based Reading and
Writing and for Math fall in a range of roughly 30 to
40 points above or below your reported score.
Total: Your score ± 40 points.
Section: Your score ± 30 points.
Test Scores and Cross-Test Scores:
Your score ± 2 points.
Subscores: Your score ± 2 points.
Am I onTrack to Be Ready for College?
You’ll see a benchmark score for each section of
the SAT. Benchmarks show your college readiness.
The Evidence-Based Reading and Writing benchmark
is 480 while the Math benchmark is 530.This means if
you score at or above the benchmark, you’re on track
to be ready for college when you graduate high school.
If you score below the benchmark, you can still get back
on track by focusing on areas where you didn’t perform
well. Use the detailed feedback in your online score
report to see which skills you need to work on most.
DB
2 to 8
14
98
101700
8
MALE
2 to 8
99
0050088366
th
8
Essay Scores
15
8
10670
Aaron Farnsworth
th
Nov. 05, 1987
13
36
780
15
Reading
36
June 04, 2016
37
th99
97
37
99
13
39.0
th
H B Plant High School
th
Writing
1510
99
15
730
2 to 8
15
th
Analysis

SAT Score Report

  • 1.
    Test Scores l 10to 40 Reading l 10 to 40 Writing and Language l 10 to 40 Math Your Total Score 400 to 1600 Nationally Representative Sample Percentile SAT User Percentile — National Get your full report online studentscores.collegeboard.org Subscores | 1 to 15 Command of Evidence Heart of Algebra Words in Context Problem Solving and Data Analysis Expression of Ideas Passport to Advanced Math Standard English Conventions Cross-Test Scores | 10 to 40 Analysis in History/Social Studies Analysis in Science Section Scores l 200 to 800 Your Evidence-Based Reading and Writing Score l 200 to 800 Your Math Score Nationally Representative Sample Percentile SAT User Percentile — National Nationally Representative Sample Percentile SAT User Percentile — National SAT ® Score Report Test Date: Registration Number: Sex: Date of Birth: Test Center Number: High School Code: High School Name: Online Score Report Go online to get more details about your performance, including areas of strength, and check out the action steps in Skills Insight to help you boost your college readiness. How Did I Score Compared to Others? A percentile is a number between 1 and 99 that shows how your score ranks compared to other students. It represents the percentage of students whose scores are equal to or below yours. For example, if your Math score percentile is 57 that means 57 percent of test- takers have Math scores equal to or below yours. You’ll see two percentiles: The Nationally Representative Sample Percentile shows how your score compares to the scores of all U.S. students in your grade, including those who don’t typically take the test. SAT® User Percentile — National shows how your score compares to the scores of students who typically take the test. Will My Scores Change and Why? Tests are not exact measures, and many factors can affect your score. After all, no two days are the same, and if you took the SAT once a week for a month your scores would change. That’s why it helps to think of your true score as a range from a few points below to a few points above the score earned. Score ranges show how your score can change with repeated testing, assuming your skill level remains the same. Usually, scores for Evidence-Based Reading and Writing and for Math fall in a range of roughly 30 to 40 points above or below your reported score. Total: Your score ± 40 points. Section: Your score ± 30 points. Test Scores and Cross-Test Scores: Your score ± 2 points. Subscores: Your score ± 2 points. Am I onTrack to Be Ready for College? You’ll see a benchmark score for each section of the SAT. Benchmarks show your college readiness. The Evidence-Based Reading and Writing benchmark is 480 while the Math benchmark is 530.This means if you score at or above the benchmark, you’re on track to be ready for college when you graduate high school. If you score below the benchmark, you can still get back on track by focusing on areas where you didn’t perform well. Use the detailed feedback in your online score report to see which skills you need to work on most. DB 2 to 8 14 98 101700 8 MALE 2 to 8 99 0050088366 th 8 Essay Scores 15 8 10670 Aaron Farnsworth th Nov. 05, 1987 13 36 780 15 Reading 36 June 04, 2016 37 th99 97 37 99 13 39.0 th H B Plant High School th Writing 1510 99 15 730 2 to 8 15 th Analysis