SlideShare a Scribd company logo
Test Scores
l 10 to 40
Reading
l 10 to 40
Writing and Language
l 10 to 40
Math
Your Total Score
400 to
1600
Nationally Representative
Sample Percentile
SAT User Percentile —
National
Get your full report online studentscores.collegeboard.org
Subscores | 1 to 15
Command of
Evidence
Heart of Algebra
Words in Context
Problem Solving
and Data Analysis
Expression of Ideas
Passport to
Advanced Math
Standard English
Conventions
Cross-Test Scores | 10 to 40
Analysis in History/Social Studies Analysis in Science
Section Scores
l 200 to 800
Your Evidence-Based
Reading and Writing
Score
l 200 to 800
Your Math Score
Nationally Representative
Sample Percentile
SAT User Percentile —
National
Nationally Representative
Sample Percentile
SAT User Percentile —
National
SAT
®
Score Report
Test Date:
Registration Number:
Sex:
Date of Birth:
Test Center Number:
High School Code:
High School Name:
Online Score Report
Go online to get more details about your performance,
including areas of strength, and check out the action
steps in Skills Insight to help you boost your college
readiness.
How Did I Score Compared to Others?
A percentile is a number between 1 and 99 that shows
how your score ranks compared to other students. It
represents the percentage of students whose scores
are equal to or below yours. For example, if your Math
score percentile is 57 that means 57 percent of test-
takers have Math scores equal to or below yours.
You’ll see two percentiles:
The Nationally Representative Sample Percentile
shows how your score compares to the scores of
all U.S. students in your grade, including those who
don’t typically take the test.
SAT®
User Percentile — National shows how your
score compares to the scores of students who
typically take the test.
Will My Scores Change and Why?
Tests are not exact measures, and many factors
can affect your score. After all, no two days are the
same, and if you took the SAT once a week for
a month your scores would change.
That’s why it helps to think of your true score as
a range from a few points below to a few points
above the score earned. Score ranges show how
your score can change with repeated testing,
assuming your skill level remains the same.
Usually, scores for Evidence-Based Reading and
Writing and for Math fall in a range of roughly 30 to
40 points above or below your reported score.
Total: Your score ± 40 points.
Section: Your score ± 30 points.
Test Scores and Cross-Test Scores:
Your score ± 2 points.
Subscores: Your score ± 2 points.
Am I onTrack to Be Ready for College?
You’ll see a benchmark score for each section of
the SAT. Benchmarks show your college readiness.
The Evidence-Based Reading and Writing benchmark
is 480 while the Math benchmark is 530.This means if
you score at or above the benchmark, you’re on track
to be ready for college when you graduate high school.
If you score below the benchmark, you can still get back
on track by focusing on areas where you didn’t perform
well. Use the detailed feedback in your online score
report to see which skills you need to work on most.
DB
2 to 8
13
87
151220
6
FEMALE
2 to 8
91
0048580679
th
6
Essay Scores
12
3
15815
Regina M. Novy
th
Sep. 13, 1998
13
36
660
11
Reading
32
Mar. 05, 2016
32
st91
81
30
PO Box 566
Avilla, IN 46710 - 0566
86
11
33.0
st
Garrett High School
st
Writing
1300
88
11
640
2 to 8
11
th
Analysis
SAT Summary of Scores
Date
Grade
SAT
Total
Evidence-Based Reading and Writing
Math
Essay
Reading
Analysis
Writing
Critical Reading
Mathematics
Writing
SAT Subject Test Scores
Date
Grade
Subject Test
Test Score
Language
Subscores
Reading
Listening
Usage
Subject Test
Test Score
Subject Test
Test Score
*Scores from the SAT Subject Test in Mathematics are not comparable to Math section, test, and related subscores on the SAT.
*Not all SAT Subject Tests have subscores.
© 2016The College Board. College Board, AP, SAT, and the acorn logo are registered trademarks of
the College Board. SAT SubjectTests, and Score Choice, are trademarks owned by the College Board.
Visit the College Board on the Web: www.collegeboard.org.
Khan Academy is a registered trademark in the United States and other jurisdictions.
Test Date:
Registration Number:
How Should I Send
My Scores to Colleges?
This student score report is for your use only.
Most colleges require you to have the College
accept copies of student score reports, online
score reports, or score report labels on transcripts.
With Score Choice™, you decide which scores
you send to colleges. Choose by test date for the
SAT and individual test for SAT Subject Tests™ —
in agreement with an institution’s stated score-use
practice. Visit studentscores.collegeboard.org
for detailed analysis of your scores and more
information on sending scores to colleges.
College Plan
There are a lot of great possibilities to explore in choosing a college.
Get a step-by-step road map and advice on what to do when.
Access your online score report for details.
SAT Practice
Keep improving your college readiness skills by connecting to
FREE, world-class personalized practice recommendations online on
khanacademy.org/sat.
AP®
and SAT SubjectTests™
Get ahead by challenging yourself. You may still be able to take
AP®
courses and SAT Subject Tests aligned with majors you’re
interested in. Some colleges may use those scores to place you
out of introductory-level college courses.
Old SAT
1300
6
Mar. 05, 2016
6
11
3
0048580679
Regina M. Novy
660
640
Mar. 05, 2016

More Related Content

Similar to StudentScoreReport_1472775603498

ACT June
ACT JuneACT June
ACT June
Dylan Schuck
 
All about sat
All about satAll about sat
All about sat
Suraj Saxena
 
Psat explained
Psat explainedPsat explained
Psat explained
YoAmoNYC
 
Psat explained
Psat explainedPsat explained
Psat explained
JSlinkyNY
 
PSAT explained
PSAT explainedPSAT explained
PSAT explained
JSlinkyNY
 
Introduction to SAT.pptx
Introduction to SAT.pptxIntroduction to SAT.pptx
Introduction to SAT.pptx
ssuser5ba95a
 
Summer Internship at Careers360
Summer Internship at Careers360Summer Internship at Careers360
Summer Internship at Careers360
Sayan Chakraborty
 
Psat results parent
Psat results parentPsat results parent
Psat results parent
MVL HS
 
1 9-12
1 9-121 9-12
2008_06_02 GMAT
2008_06_02 GMAT2008_06_02 GMAT
2008_06_02 GMAT
Spencer Drury, MBA
 
Act vs sat vs psat which do you need
Act vs sat vs psat which do you needAct vs sat vs psat which do you need
Act vs sat vs psat which do you need
SamuelSweetwood
 
SAT presentation of teacher's module pdf
SAT presentation of teacher's module pdfSAT presentation of teacher's module pdf
SAT presentation of teacher's module pdf
ShivamMishra465316
 
PowerPoint using psat/nmsqt scores: college readiness presentation
PowerPoint using psat/nmsqt scores: college readiness presentationPowerPoint using psat/nmsqt scores: college readiness presentation
PowerPoint using psat/nmsqt scores: college readiness presentation
webern79
 
CogAt Introduction
CogAt IntroductionCogAt Introduction
CogAt Introduction
sycamorecreek
 
Atar Score
Atar ScoreAtar Score
Atar Score
Ron273
 
CogAt Parent Presentation
CogAt Parent PresentationCogAt Parent Presentation
CogAt Parent Presentation
Heather Callahan
 
Year 10-UAC 2010
Year 10-UAC 2010Year 10-UAC 2010
Year 10-UAC 2010
cornchip
 
Everything You Need To Know About the Sat
Everything You Need To Know About the SatEverything You Need To Know About the Sat
Everything You Need To Know About the Sat
Global Opportunities
 
Career and college planning for undeclassment presentation 2014 2015
Career and college planning for undeclassment presentation 2014 2015Career and college planning for undeclassment presentation 2014 2015
Career and college planning for undeclassment presentation 2014 2015
webern79
 
Psat understanding psat-nmsqt results presentation 2012-2013
Psat understanding psat-nmsqt results presentation 2012-2013Psat understanding psat-nmsqt results presentation 2012-2013
Psat understanding psat-nmsqt results presentation 2012-2013
sjordan1573
 

Similar to StudentScoreReport_1472775603498 (20)

ACT June
ACT JuneACT June
ACT June
 
All about sat
All about satAll about sat
All about sat
 
Psat explained
Psat explainedPsat explained
Psat explained
 
Psat explained
Psat explainedPsat explained
Psat explained
 
PSAT explained
PSAT explainedPSAT explained
PSAT explained
 
Introduction to SAT.pptx
Introduction to SAT.pptxIntroduction to SAT.pptx
Introduction to SAT.pptx
 
Summer Internship at Careers360
Summer Internship at Careers360Summer Internship at Careers360
Summer Internship at Careers360
 
Psat results parent
Psat results parentPsat results parent
Psat results parent
 
1 9-12
1 9-121 9-12
1 9-12
 
2008_06_02 GMAT
2008_06_02 GMAT2008_06_02 GMAT
2008_06_02 GMAT
 
Act vs sat vs psat which do you need
Act vs sat vs psat which do you needAct vs sat vs psat which do you need
Act vs sat vs psat which do you need
 
SAT presentation of teacher's module pdf
SAT presentation of teacher's module pdfSAT presentation of teacher's module pdf
SAT presentation of teacher's module pdf
 
PowerPoint using psat/nmsqt scores: college readiness presentation
PowerPoint using psat/nmsqt scores: college readiness presentationPowerPoint using psat/nmsqt scores: college readiness presentation
PowerPoint using psat/nmsqt scores: college readiness presentation
 
CogAt Introduction
CogAt IntroductionCogAt Introduction
CogAt Introduction
 
Atar Score
Atar ScoreAtar Score
Atar Score
 
CogAt Parent Presentation
CogAt Parent PresentationCogAt Parent Presentation
CogAt Parent Presentation
 
Year 10-UAC 2010
Year 10-UAC 2010Year 10-UAC 2010
Year 10-UAC 2010
 
Everything You Need To Know About the Sat
Everything You Need To Know About the SatEverything You Need To Know About the Sat
Everything You Need To Know About the Sat
 
Career and college planning for undeclassment presentation 2014 2015
Career and college planning for undeclassment presentation 2014 2015Career and college planning for undeclassment presentation 2014 2015
Career and college planning for undeclassment presentation 2014 2015
 
Psat understanding psat-nmsqt results presentation 2012-2013
Psat understanding psat-nmsqt results presentation 2012-2013Psat understanding psat-nmsqt results presentation 2012-2013
Psat understanding psat-nmsqt results presentation 2012-2013
 

StudentScoreReport_1472775603498

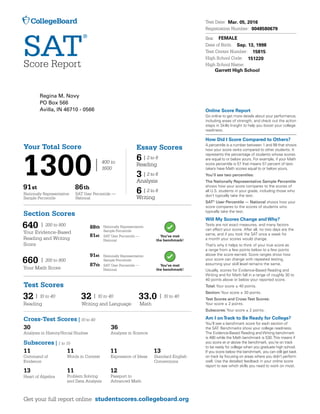
  • 1. Test Scores l 10 to 40 Reading l 10 to 40 Writing and Language l 10 to 40 Math Your Total Score 400 to 1600 Nationally Representative Sample Percentile SAT User Percentile — National Get your full report online studentscores.collegeboard.org Subscores | 1 to 15 Command of Evidence Heart of Algebra Words in Context Problem Solving and Data Analysis Expression of Ideas Passport to Advanced Math Standard English Conventions Cross-Test Scores | 10 to 40 Analysis in History/Social Studies Analysis in Science Section Scores l 200 to 800 Your Evidence-Based Reading and Writing Score l 200 to 800 Your Math Score Nationally Representative Sample Percentile SAT User Percentile — National Nationally Representative Sample Percentile SAT User Percentile — National SAT ® Score Report Test Date: Registration Number: Sex: Date of Birth: Test Center Number: High School Code: High School Name: Online Score Report Go online to get more details about your performance, including areas of strength, and check out the action steps in Skills Insight to help you boost your college readiness. How Did I Score Compared to Others? A percentile is a number between 1 and 99 that shows how your score ranks compared to other students. It represents the percentage of students whose scores are equal to or below yours. For example, if your Math score percentile is 57 that means 57 percent of test- takers have Math scores equal to or below yours. You’ll see two percentiles: The Nationally Representative Sample Percentile shows how your score compares to the scores of all U.S. students in your grade, including those who don’t typically take the test. SAT® User Percentile — National shows how your score compares to the scores of students who typically take the test. Will My Scores Change and Why? Tests are not exact measures, and many factors can affect your score. After all, no two days are the same, and if you took the SAT once a week for a month your scores would change. That’s why it helps to think of your true score as a range from a few points below to a few points above the score earned. Score ranges show how your score can change with repeated testing, assuming your skill level remains the same. Usually, scores for Evidence-Based Reading and Writing and for Math fall in a range of roughly 30 to 40 points above or below your reported score. Total: Your score ± 40 points. Section: Your score ± 30 points. Test Scores and Cross-Test Scores: Your score ± 2 points. Subscores: Your score ± 2 points. Am I onTrack to Be Ready for College? You’ll see a benchmark score for each section of the SAT. Benchmarks show your college readiness. The Evidence-Based Reading and Writing benchmark is 480 while the Math benchmark is 530.This means if you score at or above the benchmark, you’re on track to be ready for college when you graduate high school. If you score below the benchmark, you can still get back on track by focusing on areas where you didn’t perform well. Use the detailed feedback in your online score report to see which skills you need to work on most. DB 2 to 8 13 87 151220 6 FEMALE 2 to 8 91 0048580679 th 6 Essay Scores 12 3 15815 Regina M. Novy th Sep. 13, 1998 13 36 660 11 Reading 32 Mar. 05, 2016 32 st91 81 30 PO Box 566 Avilla, IN 46710 - 0566 86 11 33.0 st Garrett High School st Writing 1300 88 11 640 2 to 8 11 th Analysis
  • 2. SAT Summary of Scores Date Grade SAT Total Evidence-Based Reading and Writing Math Essay Reading Analysis Writing Critical Reading Mathematics Writing SAT Subject Test Scores Date Grade Subject Test Test Score Language Subscores Reading Listening Usage Subject Test Test Score Subject Test Test Score *Scores from the SAT Subject Test in Mathematics are not comparable to Math section, test, and related subscores on the SAT. *Not all SAT Subject Tests have subscores. © 2016The College Board. College Board, AP, SAT, and the acorn logo are registered trademarks of the College Board. SAT SubjectTests, and Score Choice, are trademarks owned by the College Board. Visit the College Board on the Web: www.collegeboard.org. Khan Academy is a registered trademark in the United States and other jurisdictions. Test Date: Registration Number: How Should I Send My Scores to Colleges? This student score report is for your use only. Most colleges require you to have the College accept copies of student score reports, online score reports, or score report labels on transcripts. With Score Choice™, you decide which scores you send to colleges. Choose by test date for the SAT and individual test for SAT Subject Tests™ — in agreement with an institution’s stated score-use practice. Visit studentscores.collegeboard.org for detailed analysis of your scores and more information on sending scores to colleges. College Plan There are a lot of great possibilities to explore in choosing a college. Get a step-by-step road map and advice on what to do when. Access your online score report for details. SAT Practice Keep improving your college readiness skills by connecting to FREE, world-class personalized practice recommendations online on khanacademy.org/sat. AP® and SAT SubjectTests™ Get ahead by challenging yourself. You may still be able to take AP® courses and SAT Subject Tests aligned with majors you’re interested in. Some colleges may use those scores to place you out of introductory-level college courses. Old SAT 1300 6 Mar. 05, 2016 6 11 3 0048580679 Regina M. Novy 660 640 Mar. 05, 2016