Submit Search
Upload
ABCi Skills for Improvement- Pareto Chart
•
0 likes
•
402 views
ABCiABUHB
Follow
A guide to help with the creation of a Pareto chart.
Read less
Read more
Healthcare
Report
Share
Report
Share
1 of 2
Download now
Download to read offline
Recommended
1b s4 i interpreting runcharts final
ABCiABUHB
1c s4 i using runcharts final
ABCiABUHB
1a s4 i creating runcharts final
ABCiABUHB
ABCi Charts - Runcharts Tool user guide
ABCiABUHB
Pareto guide final
Pareto guide final
ABCiABUHB
Basicseventools
Basicseventools
ahmad bassiouny
Pareto Diagrams
Pareto Diagrams
Deborah_W
Scatter diagram and control chart
nithyanithi26
scatter diagram
scatter diagram
shrey8916
AIG Seven QC Tools
AIG Seven QC Tools
advanceinnovationgroup
Production and Quality Tools: The Basic Seven Quality Tools
Dr. John V. Padua
Pareto chart importance & making
Kamleshwar Pandey
how quality tools are used to monitor and control the quality of an organizat...
AnkonRoy2
Scatter diagram in tqm
kerala universty
Scatter Plot
Scatter Plot
Nishant Narendra
7 basic tool for QUALITY
SK MD RAIJUL HAQUE
Pareto Diagram
Pareto Diagram
Divyansh jain
Tools of total quality management
Tommie0607
5 6 Scatter Plots & Best Fit Lines
Bitsy Griffin
Presentation 2
Presentation 2
sushilnifft
Runchart
Runchart
Sun Technologies
Qcl 14-v3 pareto-chart_potholes_in_the_city_banasthali-university_rashi
twinkle_singhal7
Quality tools by Er. Manish Dwivedi
Er. Manish Dwivedi
7 QC Tools PowerPoint Presentation Slides
SlideTeam
Problem Solving Tools - Susan
elsanora
Managing change risk in Excel spreadsheets
ExcelForManagers.com
Pareto chart sample paper
Assignment Lab
Distribution of normal data understanding it numerical way by arun umrao
ssuserd6b1fd
Pareto analysis
Pareto analysis
Cik Liana Omar
Pareto Principle Explained
Ed Simpson
More Related Content
What's hot
scatter diagram
scatter diagram
shrey8916
AIG Seven QC Tools
AIG Seven QC Tools
advanceinnovationgroup
Production and Quality Tools: The Basic Seven Quality Tools
Dr. John V. Padua
Pareto chart importance & making
Kamleshwar Pandey
how quality tools are used to monitor and control the quality of an organizat...
AnkonRoy2
Scatter diagram in tqm
kerala universty
Scatter Plot
Scatter Plot
Nishant Narendra
7 basic tool for QUALITY
SK MD RAIJUL HAQUE
Pareto Diagram
Pareto Diagram
Divyansh jain
Tools of total quality management
Tommie0607
5 6 Scatter Plots & Best Fit Lines
Bitsy Griffin
Presentation 2
Presentation 2
sushilnifft
Runchart
Runchart
Sun Technologies
Qcl 14-v3 pareto-chart_potholes_in_the_city_banasthali-university_rashi
twinkle_singhal7
Quality tools by Er. Manish Dwivedi
Er. Manish Dwivedi
7 QC Tools PowerPoint Presentation Slides
SlideTeam
Problem Solving Tools - Susan
elsanora
Managing change risk in Excel spreadsheets
ExcelForManagers.com
Pareto chart sample paper
Assignment Lab
Distribution of normal data understanding it numerical way by arun umrao
ssuserd6b1fd
What's hot
(20)
scatter diagram
scatter diagram
AIG Seven QC Tools
AIG Seven QC Tools
Production and Quality Tools: The Basic Seven Quality Tools
Pareto chart importance & making
how quality tools are used to monitor and control the quality of an organizat...
Scatter diagram in tqm
Scatter Plot
Scatter Plot
7 basic tool for QUALITY
Pareto Diagram
Pareto Diagram
Tools of total quality management
5 6 Scatter Plots & Best Fit Lines
Presentation 2
Presentation 2
Runchart
Runchart
Qcl 14-v3 pareto-chart_potholes_in_the_city_banasthali-university_rashi
Quality tools by Er. Manish Dwivedi
7 QC Tools PowerPoint Presentation Slides
Problem Solving Tools - Susan
Managing change risk in Excel spreadsheets
Pareto chart sample paper
Distribution of normal data understanding it numerical way by arun umrao
Similar to ABCi Skills for Improvement- Pareto Chart
Pareto analysis
Pareto analysis
Cik Liana Omar
Pareto Principle Explained
Ed Simpson
CHAPTER 7.pptx
CHAPTER 7.pptx
CristyDocdocos1
Seven Basic Tools of QC and their Applications
DrJayantaKumarMahato1
Week 11 data collation & analysis
Kevin Goh At Np
17053257 implementing-tqm-in-education
lostwithabhi
17053257 implementing-tqm-in-education
lostwithabhi
Pareto analysis
Pareto analysis
Johar Ismail
Conquer Process Improvement With These 9 Lean Six Sigma Tools
QuekelsBaro
Paretho
Paretho
Jo Balucanag - Bitonio
QCL-14-v3_Pareto Banasthali University_Himani Bhandari
Himani Bhandari
Himani_Bhandari (4)
Himani_Bhandari (4)
Himani Bhandari
QCL-14-v3_Pareto Banasthali University_Himani Bhandari
Himani Bhandari
Seven Statistical tools for Quality Management
Shilpi Arora
Quality Management and NABH.pptx
ssuser10233b1
Pareto Chart Explained with Example With Excel Template.pdf
VkAn2
Pareto
Pareto
Amir Razvi
Qcl 14-v3 [pareto diagram]-[banathali_university]_[suyashi_rastogi]
Suyashi Rastogi
Big Data Analytics Tools..DS_Store__MACOSXBig Data Analyti.docx
tangyechloe
Seven Basic Quality Control Tools أدوات ضبط الجودة السبعة
Mohamed Khaled
Similar to ABCi Skills for Improvement- Pareto Chart
(20)
Pareto analysis
Pareto analysis
Pareto Principle Explained
CHAPTER 7.pptx
CHAPTER 7.pptx
Seven Basic Tools of QC and their Applications
Week 11 data collation & analysis
17053257 implementing-tqm-in-education
Pareto analysis
Pareto analysis
Conquer Process Improvement With These 9 Lean Six Sigma Tools
Paretho
Paretho
QCL-14-v3_Pareto Banasthali University_Himani Bhandari
Himani_Bhandari (4)
Himani_Bhandari (4)
QCL-14-v3_Pareto Banasthali University_Himani Bhandari
Seven Statistical tools for Quality Management
Quality Management and NABH.pptx
Pareto Chart Explained with Example With Excel Template.pdf
Pareto
Pareto
Qcl 14-v3 [pareto diagram]-[banathali_university]_[suyashi_rastogi]
Big Data Analytics Tools..DS_Store__MACOSXBig Data Analyti.docx
Seven Basic Quality Control Tools أدوات ضبط الجودة السبعة
More from ABCiABUHB
ABCi Working Styles workbook
ABCiABUHB
24 s4 i affinity diagram final
ABCiABUHB
23 s4 i nominal group technique final
ABCiABUHB
22 s4 i brainstorming final
ABCiABUHB
14 s4 i scatter plot final
ABCiABUHB
10 s4 i spaghetti diagram final
ABCiABUHB
7 s4 i model for improvement final
ABCiABUHB
5 s4 i ease benefit matrix final
ABCiABUHB
2 s4 i driver diagram final
ABCiABUHB
Fishbone template
Fishbone template
ABCiABUHB
ABCi Skills for Improvement- Fishbone Diagram
ABCiABUHB
2019 11-18 -- abci training prospectusv7 (1)
ABCiABUHB
More from ABCiABUHB
(12)
ABCi Working Styles workbook
24 s4 i affinity diagram final
23 s4 i nominal group technique final
22 s4 i brainstorming final
14 s4 i scatter plot final
10 s4 i spaghetti diagram final
7 s4 i model for improvement final
5 s4 i ease benefit matrix final
2 s4 i driver diagram final
Fishbone template
Fishbone template
ABCi Skills for Improvement- Fishbone Diagram
2019 11-18 -- abci training prospectusv7 (1)
Recently uploaded
Russian Call Girls Hyderabad Indira 9907093804 Independent Escort Service Hyd...
delhimodelshub1
Low Rate Call Girls In Bommanahalli Just Call 7001305949
ps5894268
VIP Call Girls Sector 67 Gurgaon Just Call Me 9711199012
Call Girls Service Gurgaon
Russian Call Girls South Delhi 9711199171 discount on your booking
Russian Escorts Delhi | 9711199171 | To Enjoy Every Moments Of Life!
pOOJA sexy Call Girls In Sector 49,9999965857 Young Female Escorts Service In...
Call Girls Noida
Local Housewife and effective ☎️ 8250192130 🍉🍓 Sexy Girls VIP Call Girls Chan...
Russian Call Girls Amritsar
VIP Call Girl Sector 25 Gurgaon Just Call Me 9899900591
adityaroy0215
Gurgaon Sector 90 Call Girls ( 9873940964 ) Book Hot And Sexy Girls In A Few ...
ggsonu500
Russian Call Girls in Hyderabad Ishita 9907093804 Independent Escort Service ...
delhimodelshub1
Call Girls Hyderabad Kirti 9907093804 Independent Escort Service Hyderabad
delhimodelshub1
Call Girls in Hyderabad Lavanya 9907093804 Independent Escort Service Hyderabad
delhimodelshub1
Call Girls in Mohali Surbhi ❤️🍑 9907093804 👄🫦 Independent Escort Service Mohali
High Profile Call Girls Chandigarh Aarushi
indian Call Girl Panchkula ❤️🍑 9907093804 Low Rate Call Girls Ludhiana Tulsi
High Profile Call Girls Chandigarh Aarushi
No Advance 9053900678 Chandigarh Call Girls , Indian Call Girls For Full Ni...
Vip call girls In Chandigarh
Call Girls Service Chandigarh Grishma ❤️🍑 9907093804 👄🫦 Independent Escort Se...
High Profile Call Girls Chandigarh Aarushi
Russian Call Girls in Raipur 9873940964 Book Hot And Sexy Girls
ddev2574
Gurgaon Sector 68 Call Girls ( 9873940964 ) Book Hot And Sexy Girls In A Few ...
ggsonu500
Basics of Anatomy- Language of Anatomy.pptx
Ayush Gupta
Model Call Girl in Subhash Nagar Delhi reach out to us at 🔝9953056974🔝
9953056974 Low Rate Call Girls In Saket, Delhi NCR
Russian Escorts Aishbagh Road * 9548273370 Naughty Call Girls Service in Lucknow
gragteena
Recently uploaded
(20)
Russian Call Girls Hyderabad Indira 9907093804 Independent Escort Service Hyd...
Low Rate Call Girls In Bommanahalli Just Call 7001305949
VIP Call Girls Sector 67 Gurgaon Just Call Me 9711199012
Russian Call Girls South Delhi 9711199171 discount on your booking
pOOJA sexy Call Girls In Sector 49,9999965857 Young Female Escorts Service In...
Local Housewife and effective ☎️ 8250192130 🍉🍓 Sexy Girls VIP Call Girls Chan...
VIP Call Girl Sector 25 Gurgaon Just Call Me 9899900591
Gurgaon Sector 90 Call Girls ( 9873940964 ) Book Hot And Sexy Girls In A Few ...
Russian Call Girls in Hyderabad Ishita 9907093804 Independent Escort Service ...
Call Girls Hyderabad Kirti 9907093804 Independent Escort Service Hyderabad
Call Girls in Hyderabad Lavanya 9907093804 Independent Escort Service Hyderabad
Call Girls in Mohali Surbhi ❤️🍑 9907093804 👄🫦 Independent Escort Service Mohali
indian Call Girl Panchkula ❤️🍑 9907093804 Low Rate Call Girls Ludhiana Tulsi
No Advance 9053900678 Chandigarh Call Girls , Indian Call Girls For Full Ni...
Call Girls Service Chandigarh Grishma ❤️🍑 9907093804 👄🫦 Independent Escort Se...
Russian Call Girls in Raipur 9873940964 Book Hot And Sexy Girls
Gurgaon Sector 68 Call Girls ( 9873940964 ) Book Hot And Sexy Girls In A Few ...
Basics of Anatomy- Language of Anatomy.pptx
Model Call Girl in Subhash Nagar Delhi reach out to us at 🔝9953056974🔝
Russian Escorts Aishbagh Road * 9548273370 Naughty Call Girls Service in Lucknow
ABCi Skills for Improvement- Pareto Chart
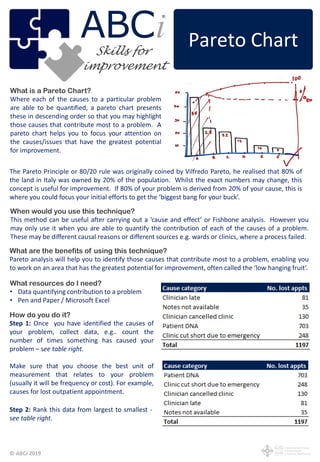
1.
© ABCi 2019 What
is a Pareto Chart? Where each of the causes to a particular problem are able to be quantified, a pareto chart presents these in descending order so that you may highlight those causes that contribute most to a problem. A pareto chart helps you to focus your attention on the causes/issues that have the greatest potential for improvement. What are the benefits of using this technique? Pareto analysis will help you to identify those causes that contribute most to a problem, enabling you to work on an area that has the greatest potential for improvement, often called the ‘low hanging fruit’. When would you use this technique? This method can be useful after carrying out a ‘cause and effect’ or Fishbone analysis. However you may only use it when you are able to quantify the contribution of each of the causes of a problem. These may be different causal reasons or different sources e.g. wards or clinics, where a process failed. How do you do it? Step 1: Once you have identified the causes of your problem, collect data, e.g.. count the number of times something has caused your problem – see table right. Make sure that you choose the best unit of measurement that relates to your problem (usually it will be frequency or cost). For example, causes for lost outpatient appointment. What resources do I need? • Data quantifying contribution to a problem • Pen and Paper / Microsoft Excel Step 2: Rank this data from largest to smallest - see table right. Pareto ChartABC improvement iSkills for The Pareto Principle or 80/20 rule was originally coined by Vilfredo Pareto, he realised that 80% of the land in Italy was owned by 20% of the population. Whilst the exact numbers may change, this concept is useful for improvement. If 80% of your problem is derived from 20% of your cause, this is where you could focus your initial efforts to get the ‘biggest bang for your buck’.
2.
© ABCi 2019 Step
3: This data then needs to be represented as a percentage of the total. For example 703/1197 x 100 = 59% - see right. Step 5: Now a Pareto chart can be created in order to illustrate your findings. Problem causes/sources will be plotted on the horizontal axis and frequency/cost will be on the vertical axis. Constructing a column chart, where the contribution of each problem cause is ranked in descending order forms the basis of a pareto chart (see below). Immediately you can see where the largest problem lies i.e. Patient DNA. Adding another axis (right of chart), representing the cumulative frequency, enables you to assess the contribution of each cause. For instance ‘Patient DNA’ constitutes around 60% of the number of lost appointments. If you follow the dotted line from 80% to where this cuts through the cumulative percentage line, and then down. Anything to the left of this line represents 80% of your problem, ‘the vital few’. Focussing your improvement efforts here will achieve higher gains. Step 4: A cumulative percentage of each category is then calculated. To do this leave the top category as it is (in this example 59%) and then add on each category’s percentage down the list. For example 59% + 21% = 80%, 80% + 11% = 91%, 91% + 7% = 97% (rounded down) etc. The cumulative percentage will always add up to 100% - see below.
Download now