
Recommended
More Related Content
What's hot
What's hot (20)
Similar to My trading journal
Similar to My trading journal (20)
More from Nizam Uddin
More from Nizam Uddin (20)
Recently uploaded
Recently uploaded (20)
My trading journal
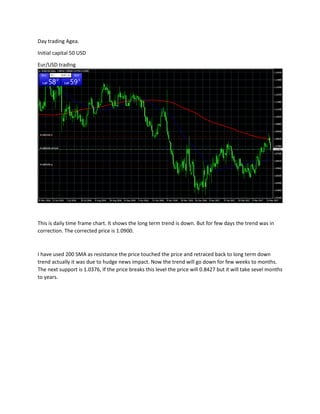
- 1. Day trading Agea. Initial capital 50 USD Eur/USD trading This is daily time frame chart. It shows the long term trend is down. But for few days the trend was in correction. The corrected price is 1.0900. I have used 200 SMA as resistance the price touched the price and retraced back to long term down trend actually it was due to hudge news impact. Now the trend will go down for few weeks to months. The next support is 1.0376, If the price breaks this level the price will 0.8427 but it will take sevel months to years.
- 2. There was short term correction for last few weeks and price was in range bound. What we use to forecast : we use 200 MA in daily time frame and weekly time frame for support trend line for weekly, daily,4hrs chart.But for short time trading we use SMA 50,100,200. 50MA for trend detection , 100,200 MA for finding support and resistance. What I mostly prefer for EUR/USD forecasting. Daily time frame, For trend detection: MA, 50,100,200 and trendline Multiple time frame Analysis: Trend in daily chart Up Trend in 4hrs chart Up Trend in 1hrs chart Up
- 3. Trend in 15 min chart Up Final comment: total long term trend, intermediate time trend and short time trend is up Trend in daily chart Up Trend in 4hrs chart Up Trend in 1hrs chart down Trend in 15 min chart down Final comment: long term, intermediate term trend up short term trend is down, the price is in correction. Trend in daily chart up Trend in 4hrs chart down Trend in 1hrs cahrt down Trend in 15 min chart down Fincal comments: long term trend is Up, price is in correction for few days to weeks intermediate and short term trend is down. The vice versa for down trend. How to identify New trend. To identify new trend we use MA and trendline, Price breaks out previous support or resistance and retest the support or resistance. Example: In 15
- 4. Look at the picture ,it is daily chart, it shows the trend in down, look price closed below the 200 MA, so the long term trend of this currency pair is down. The most important thing is that trend line shows maximum resistance is approximately 1.10, Hence I prefer the trendline more than the MA in daily time frame. Look price is respecting fibbonacci 61.8% properly.
- 5. So, I think Ideal entry for long term trade could be here.It is around 1.0900 Profit target could be 1.600. So the profit will be 300 pips for swing .
- 6. This is 15 min chart.It shows the short term trend is changing from up to down.Price has croosed 50 then 100 SMA then 200 SMA, It is definite down trend for few days. Look price is retesting on MA and the moving average is diverging, it is good sign of trending of this pair. But it is late that means it is lagging. In Forex nothing is absolute and No holy grail the main thing is Money management and discipline. With Thanks Dr Nizam Financial Analyst, Owner the-whole.com
- 7. Look at the chart it is 15 min chart a trend started from 28th march and ended on 31 march, its good trend started from1.0852 to 1.0700 total of 152 pips. Look at the below chart its 15 min chart, we have ended the trade when price closed above 100 MA and below 200 MA.
- 9. Look at the chart below It is GBPUSD chart for 15 min chart. It shows a trend started as downwards 3rd april and still down with strong support at This is GBP/USD daily chart. Now price Is 1.2835, trend is downwards for long term.It is short term correction 38.2% fibbonacci level. This price will go down after breaking this support level. But for the short term the trend is up it started 1.2300 now 1.2835.
- 11. Look at the chart below it is captured on 21 april.it shows price action of 12 april 2013 to 21 april 2017 that is total of 4 yrs or 48 months. Here high is1.7199 and low is 1.1515 that is resistance is 1.7199 it was 14.07.2014 and support is 1.1515 it was 05.10.2016, Current price is 1.2818, it failed to break this support 1.1515 that is price is rejected and now going up.
- 12. So question how much up? Its probably 61.8% of fibbonacci level, Now the price is 1.2818 it is 23.6% of fibbonacci the trend will go down if down trend have sufficient pressure nor it will go up to 1.5028, it is 61.8% retracement level, so now the trend is moved up to 1.5028, it will take severl month to years,
- 13. What 200 SMA say: We have plotted 200 SMA, price is above the SMA and retested, so the trend is moved up. Now look at the chart below in larger view
- 14. It is daily chart ,price is rejected 1.1515 and now moved upword, It has broken the resistance of 1.2742 it was strong resistance and the price aslo tested low and low which makes an upcoming uptrend, price is also above 200 SMA, so we can say price is now uptrend.It has made upword channel it will follow the trend channel