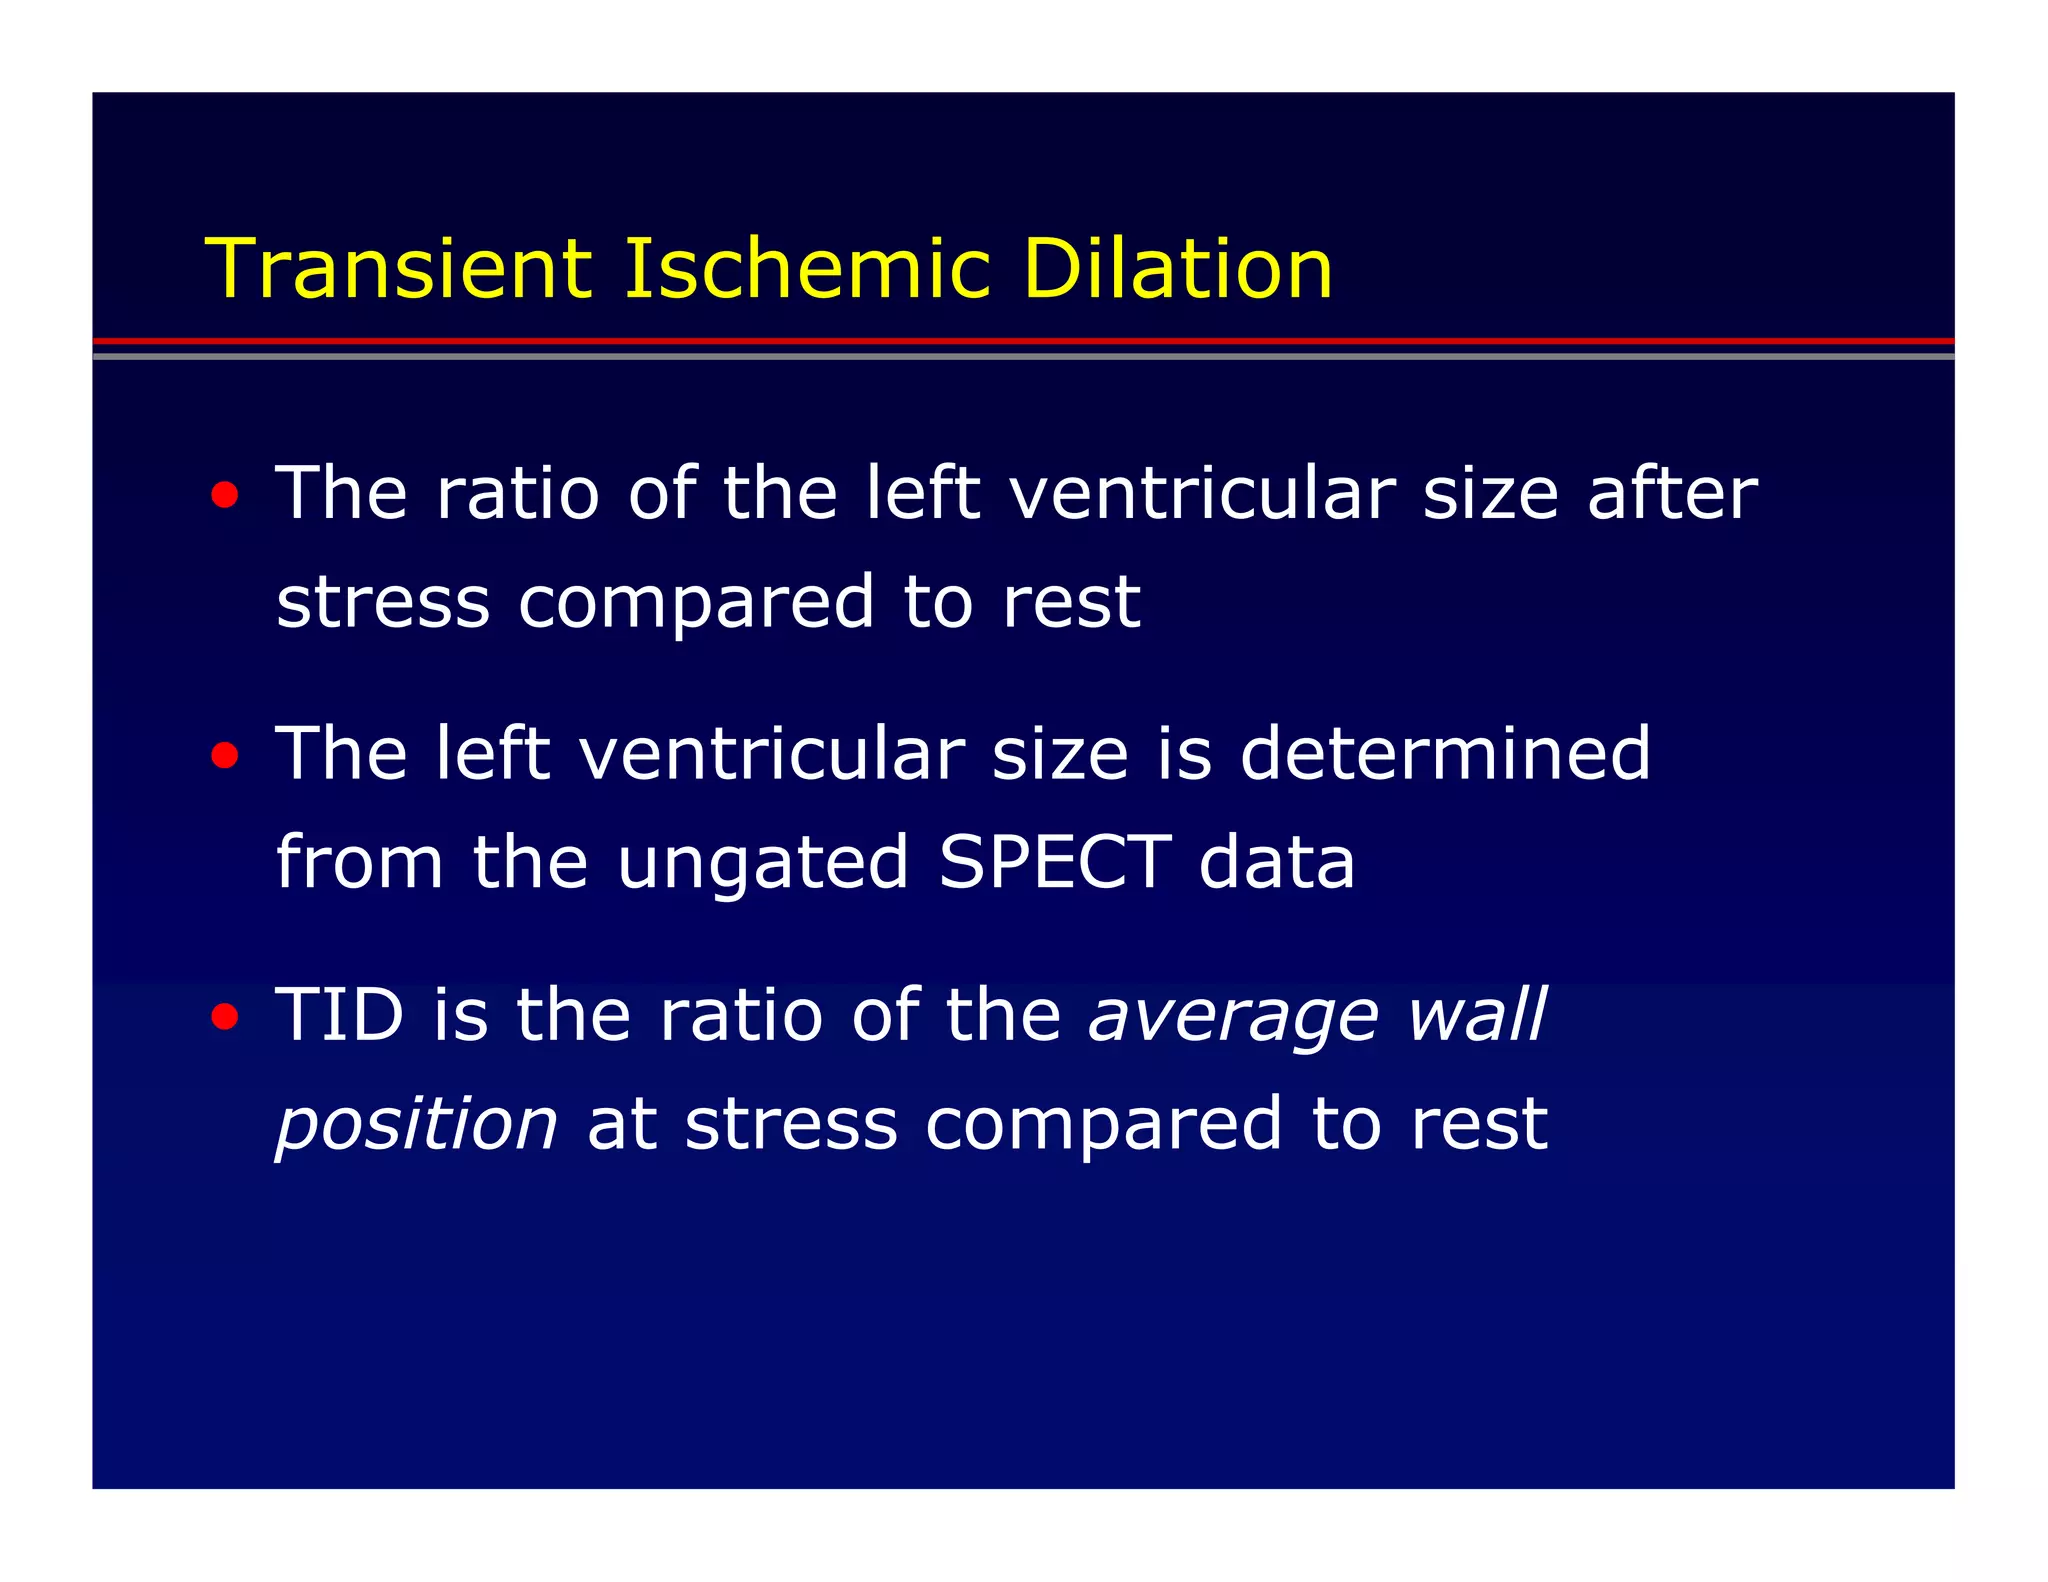
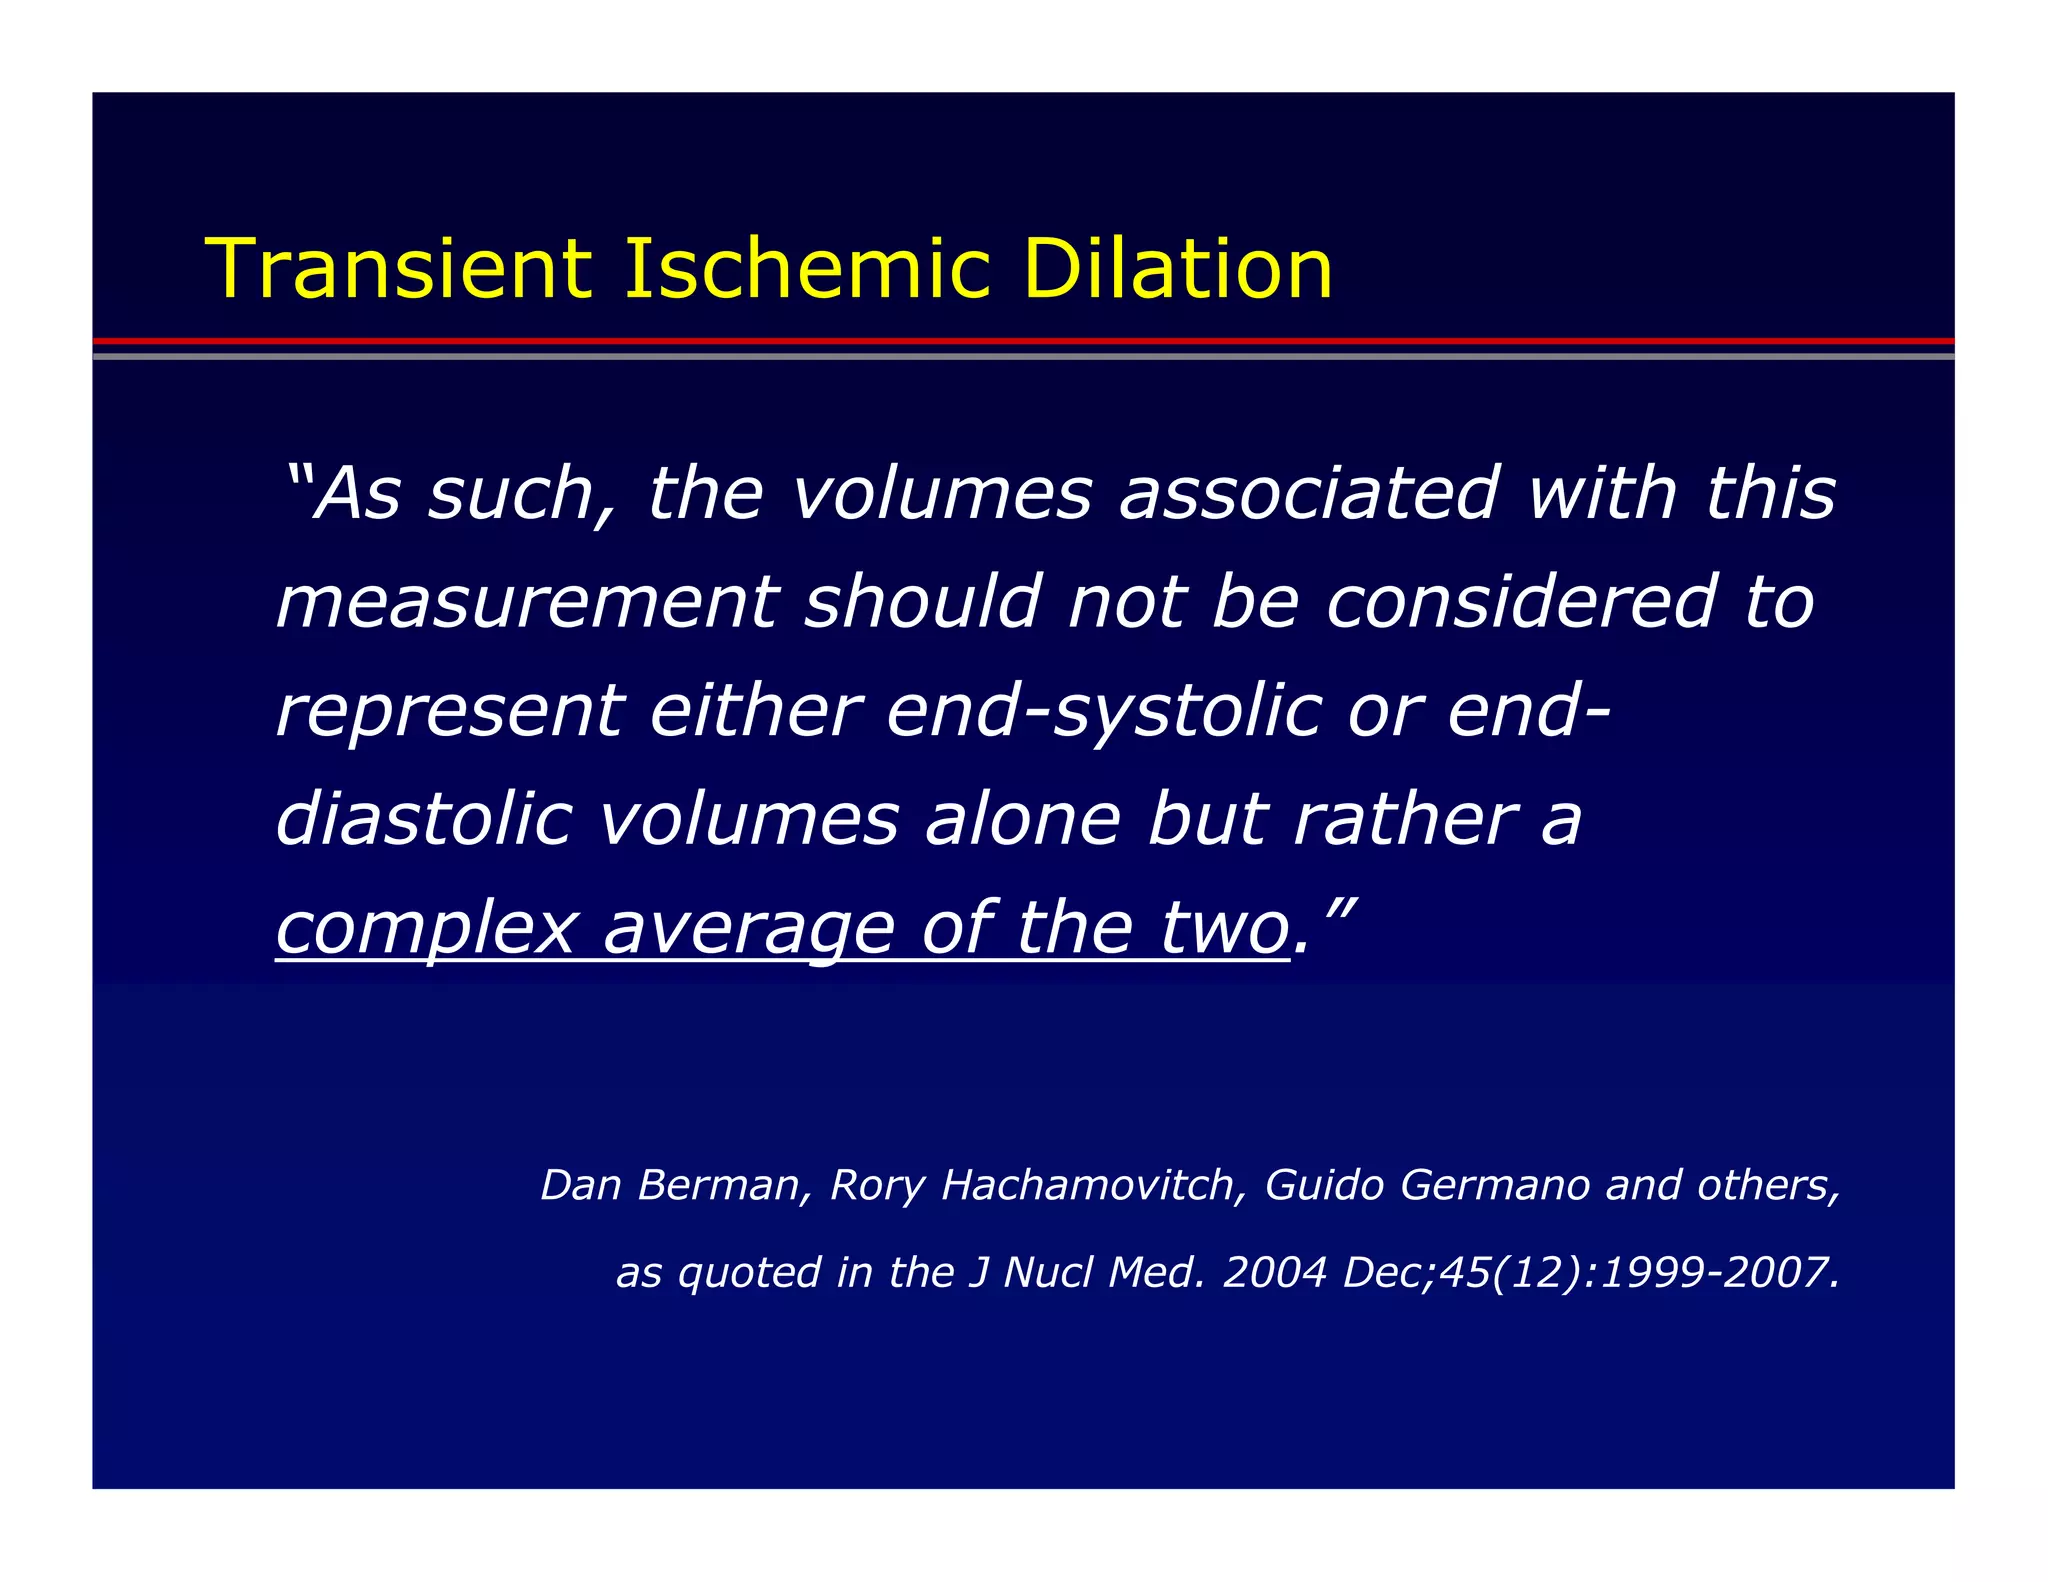
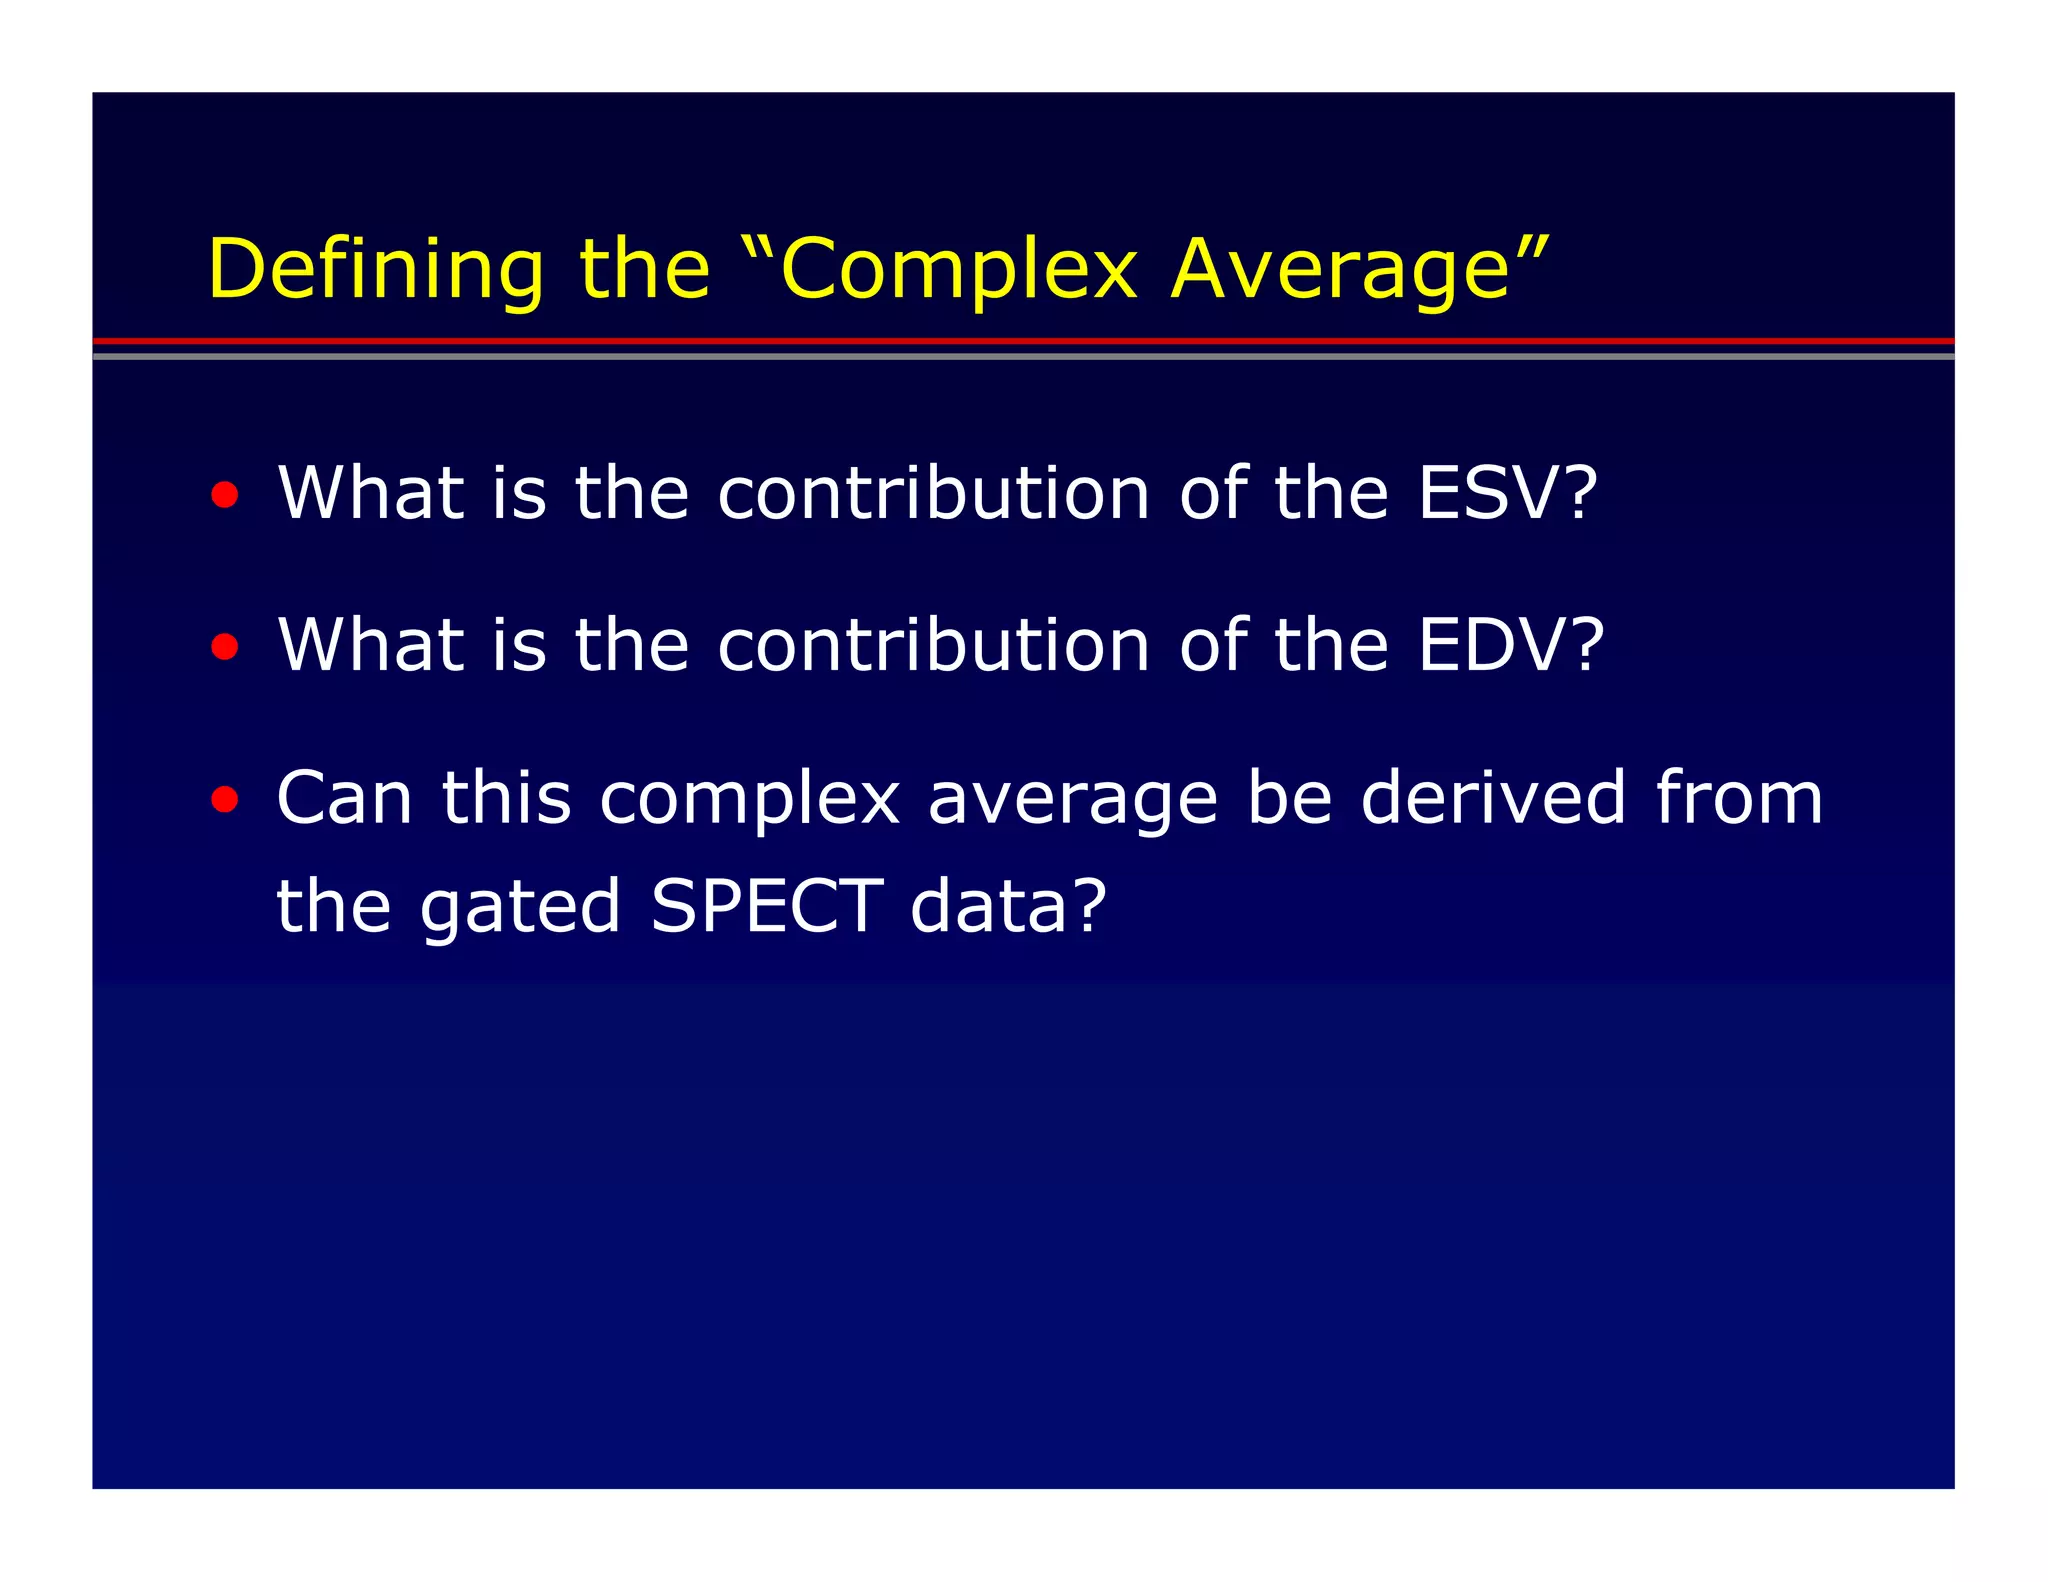
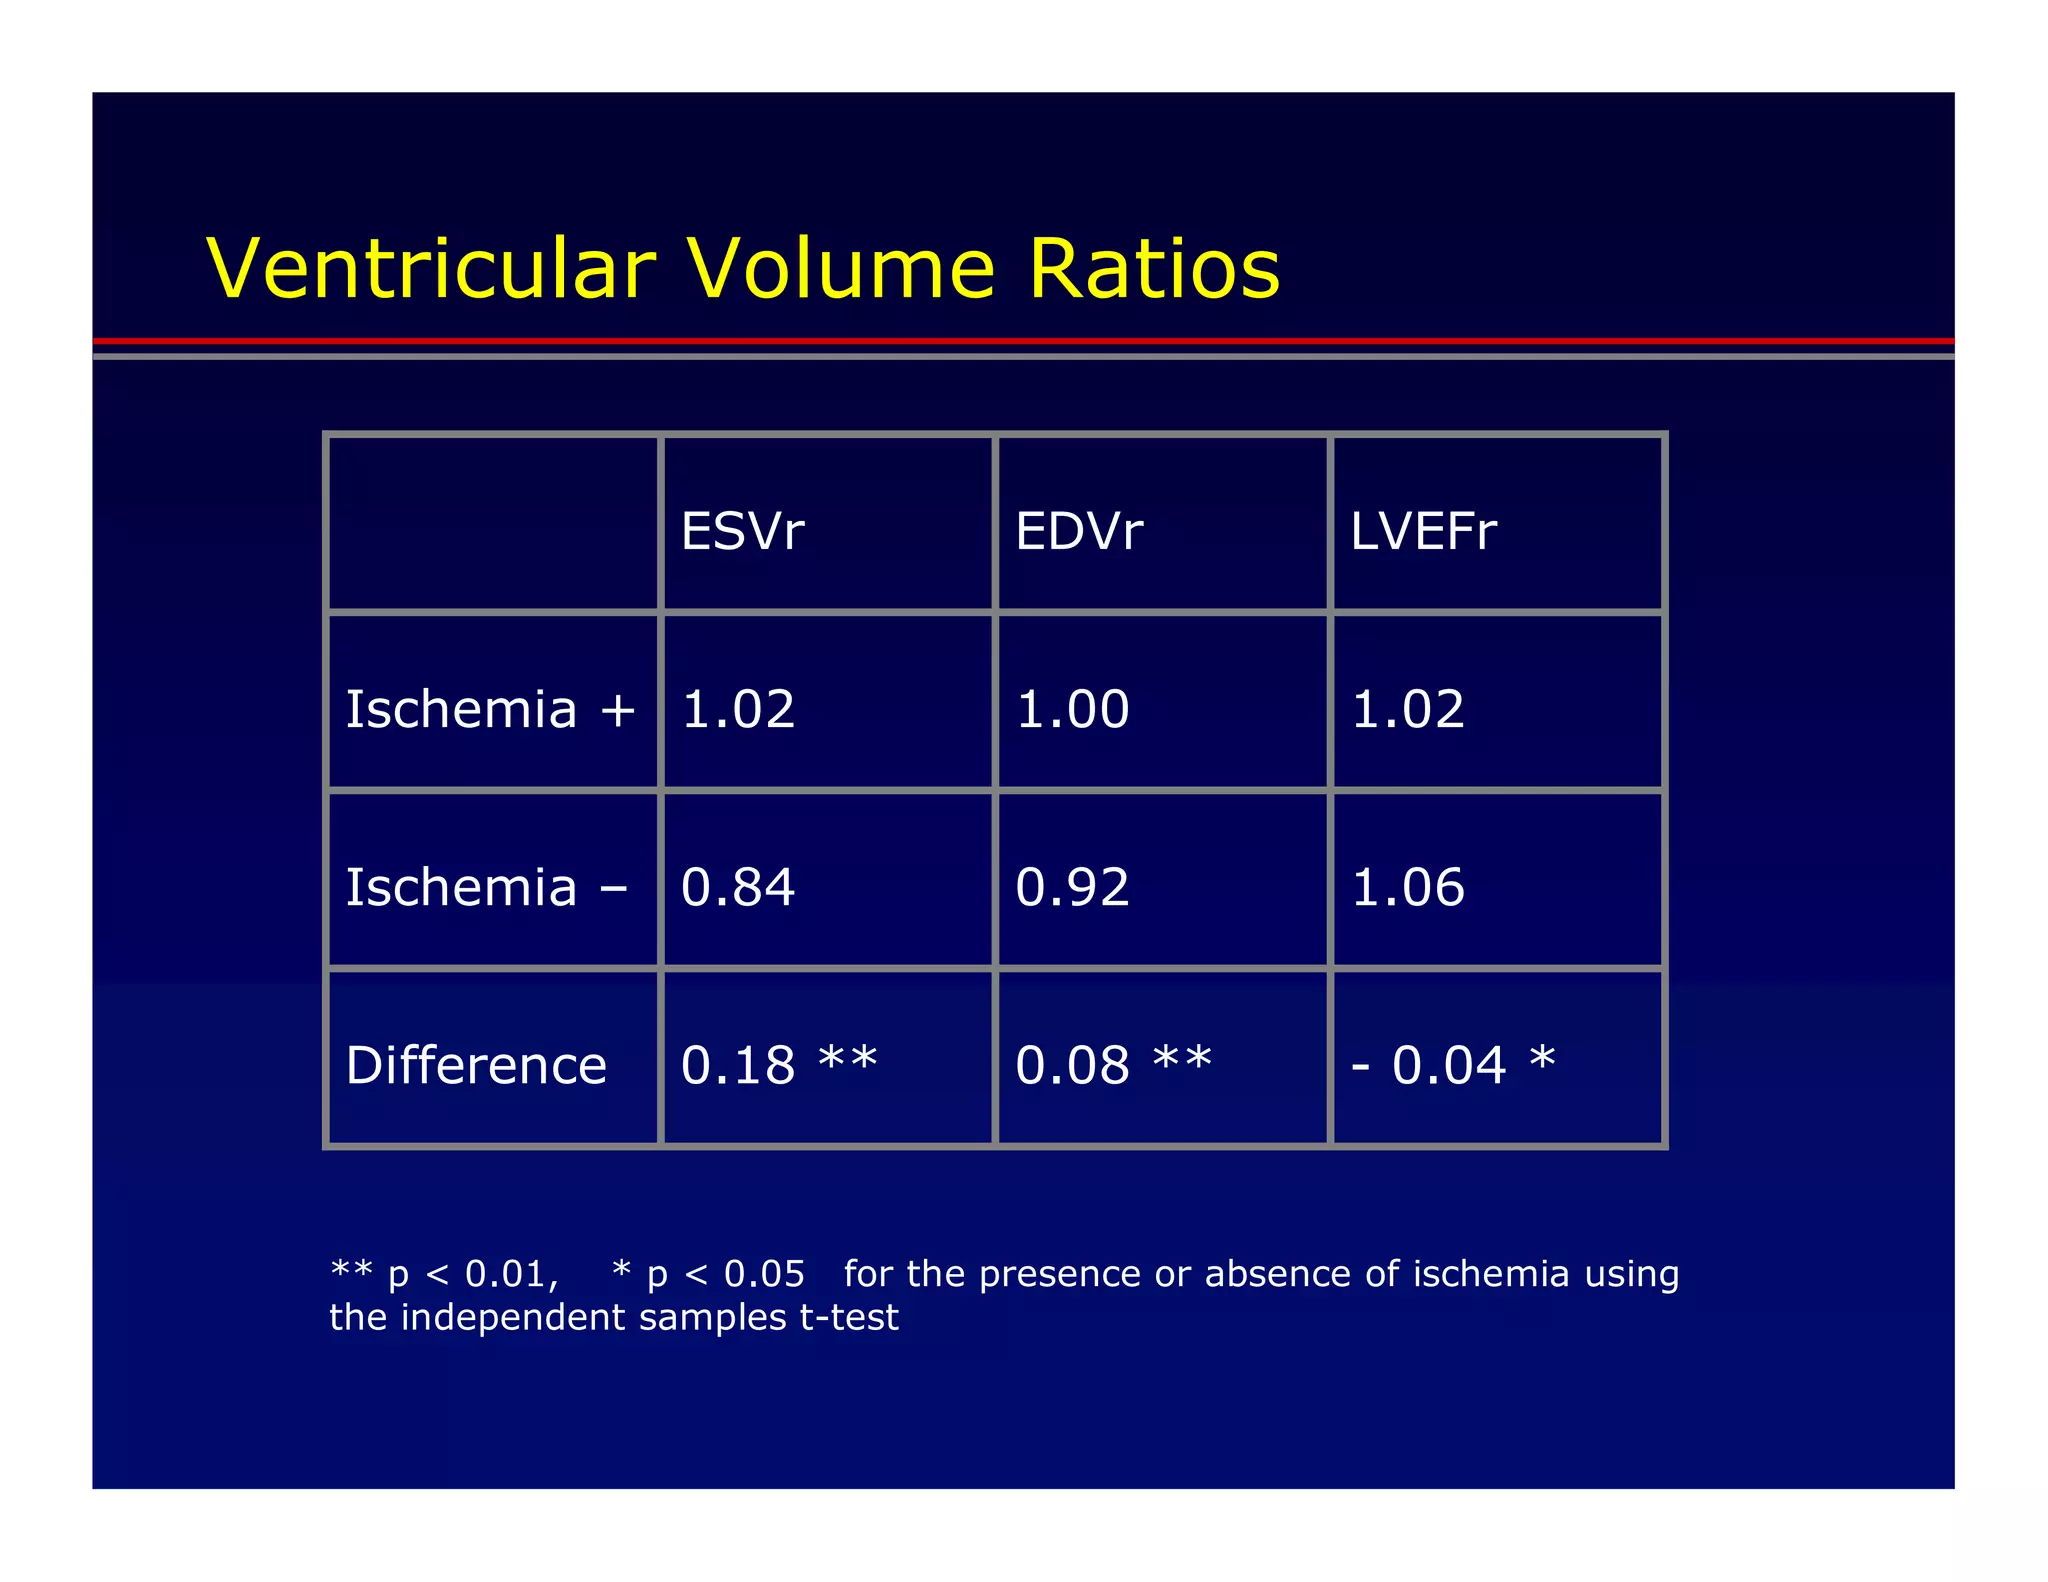
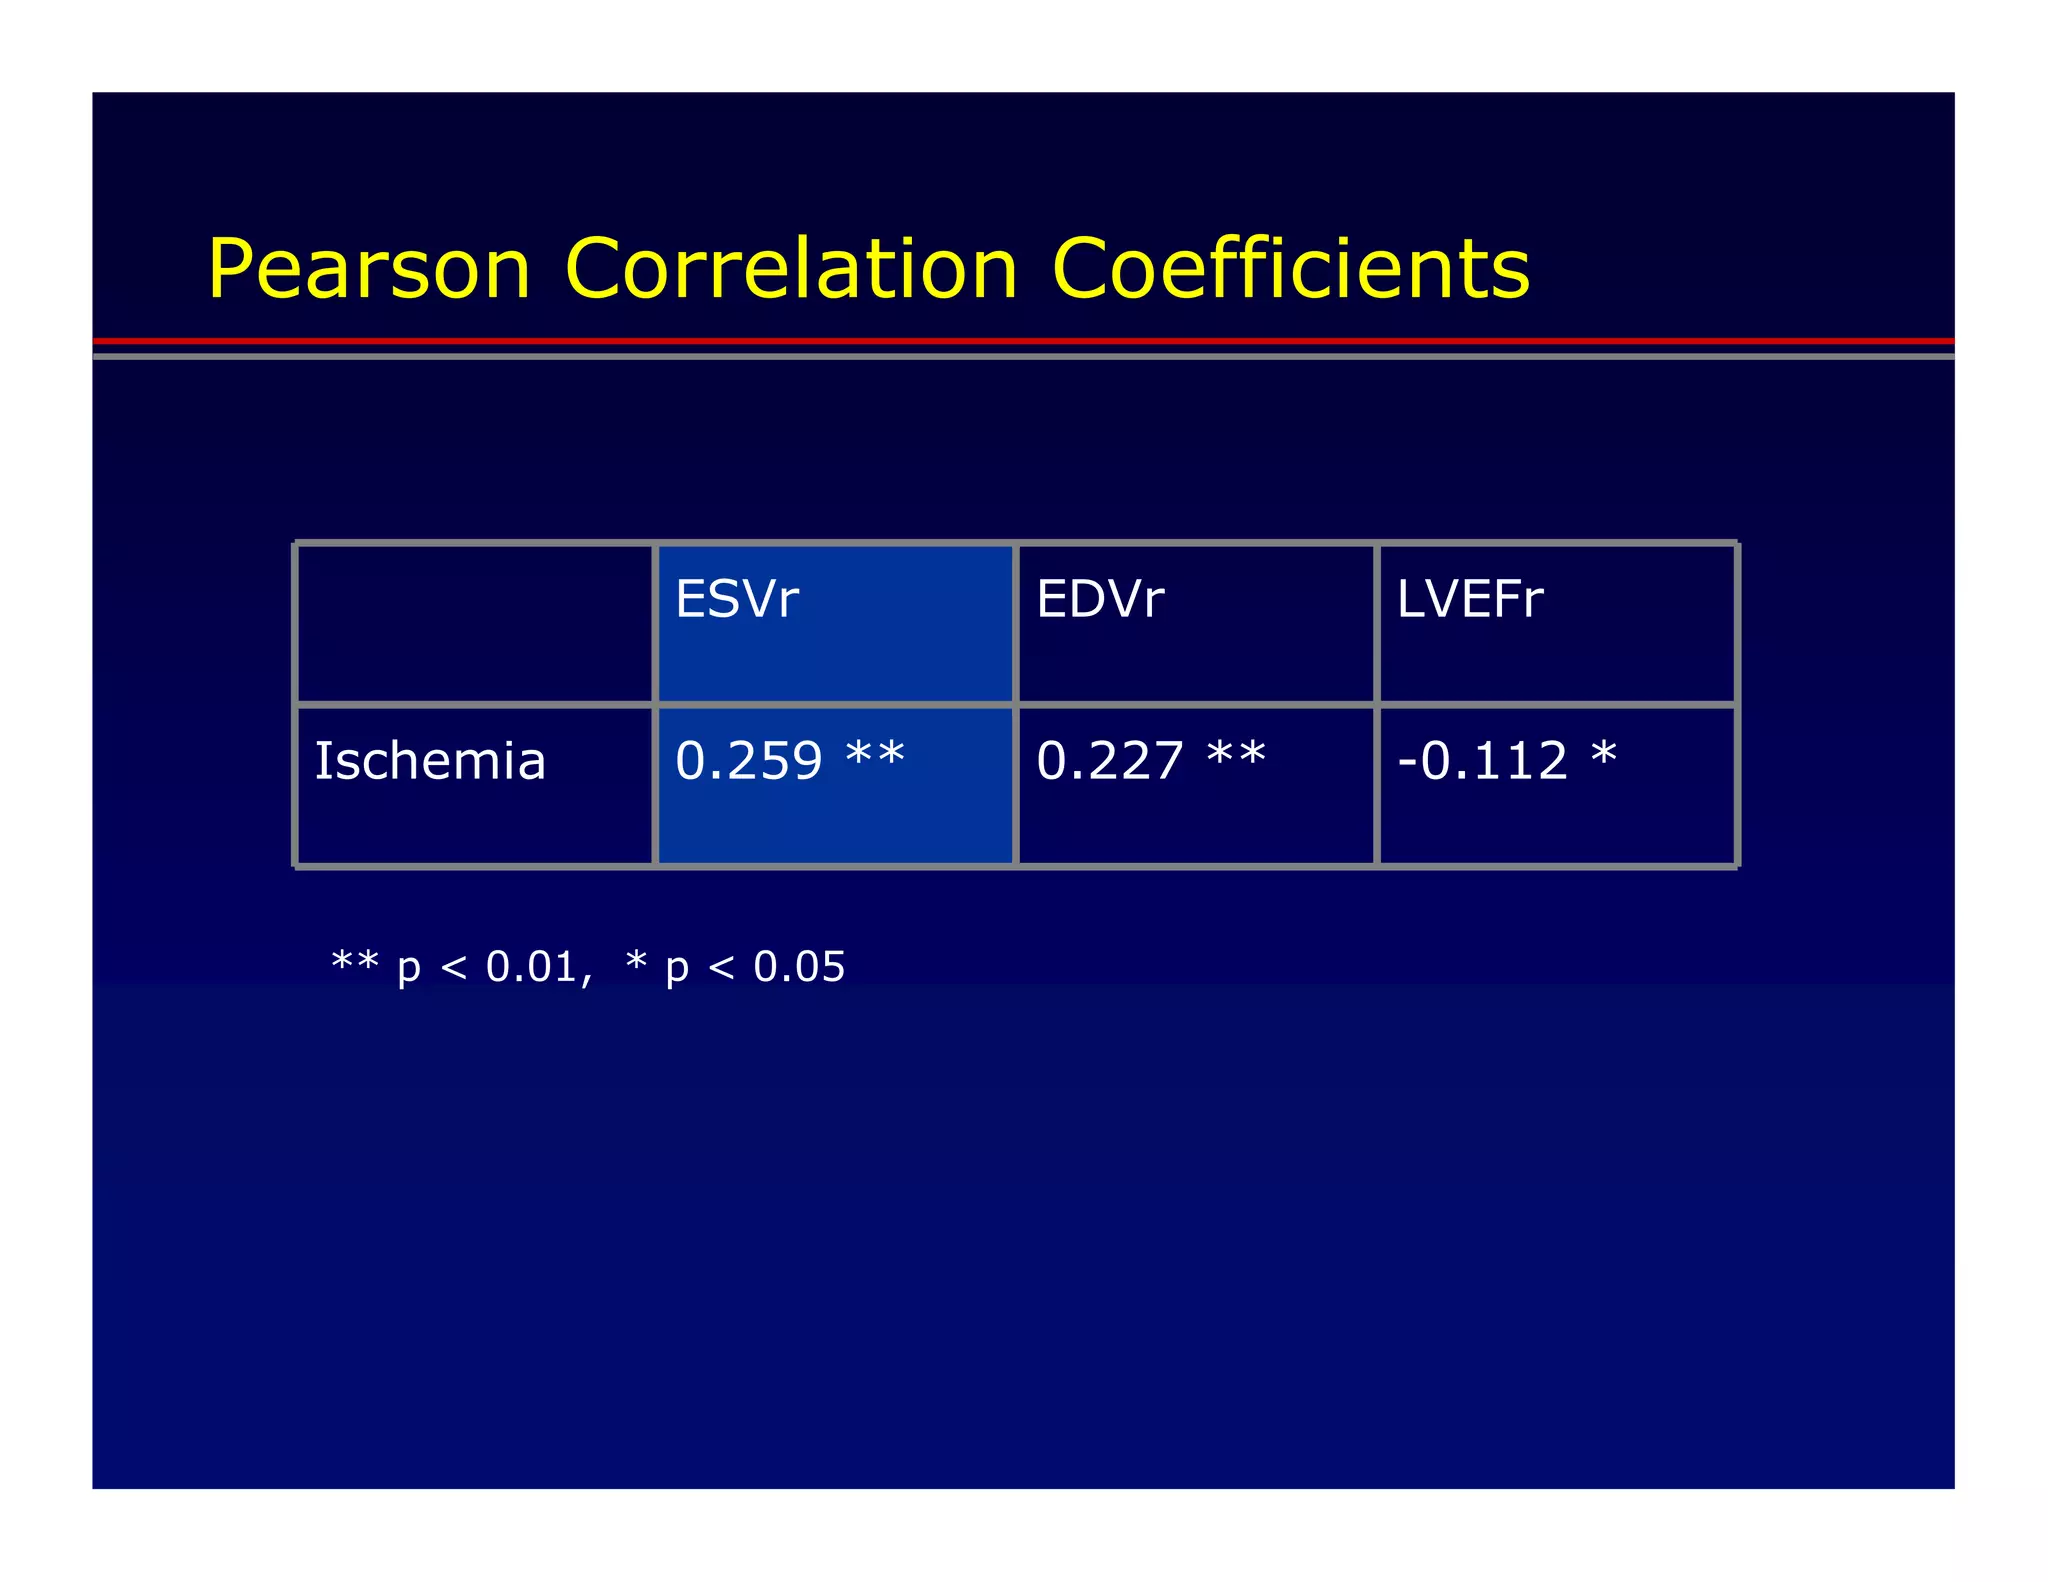
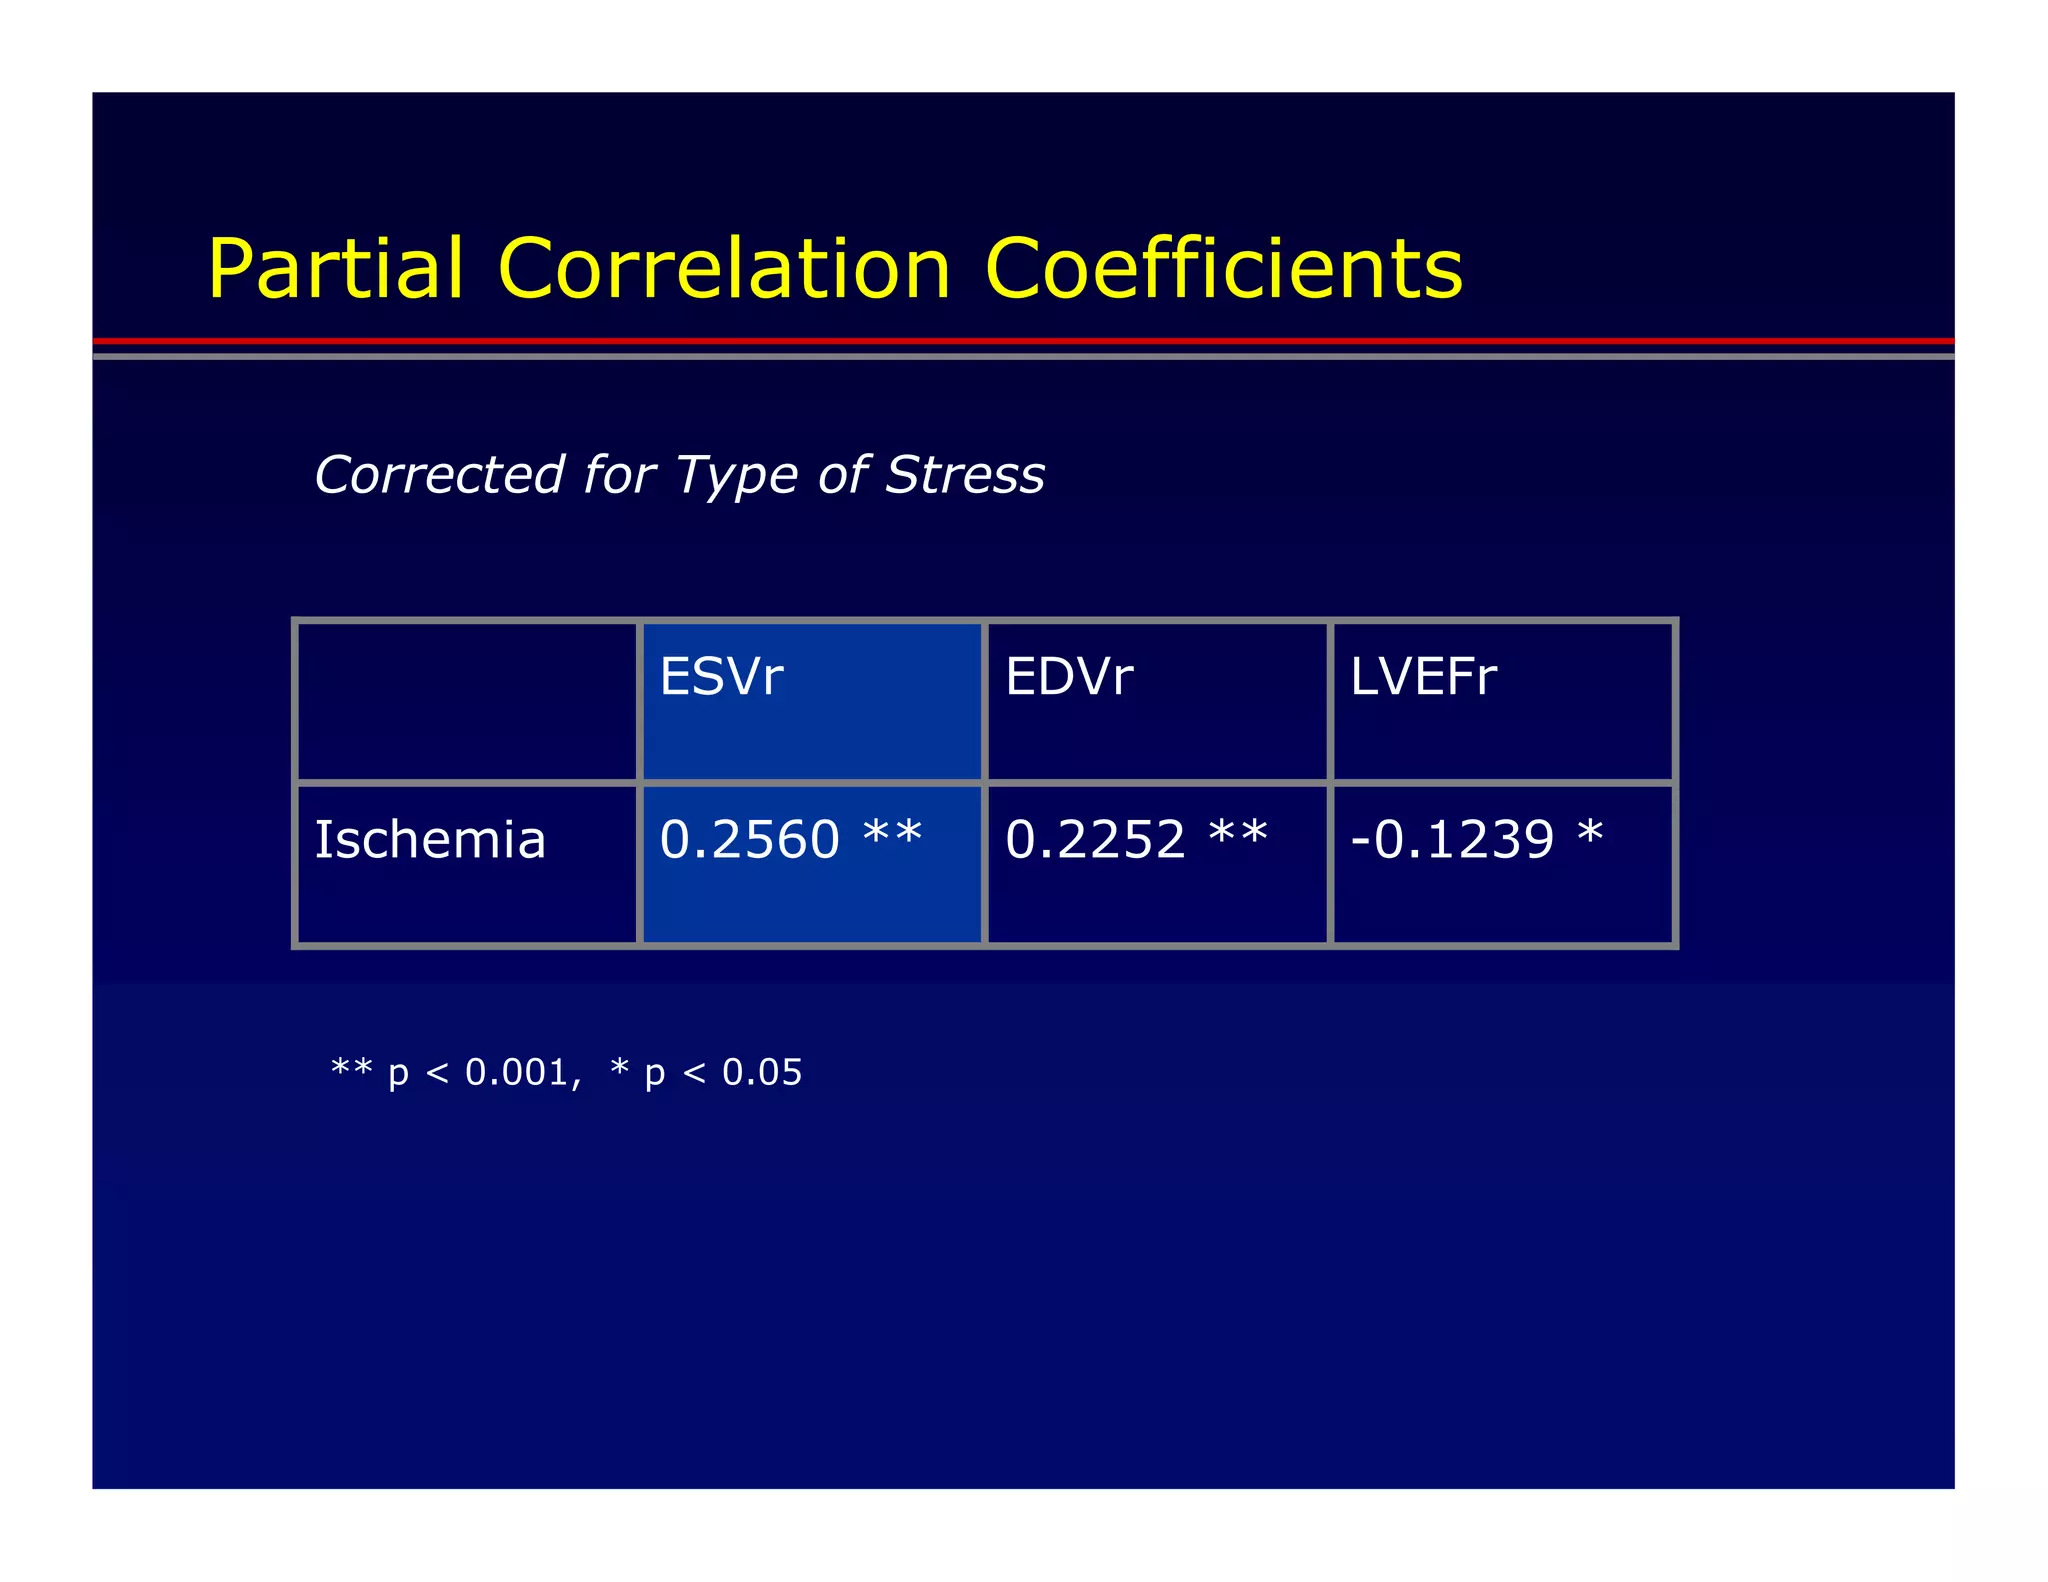
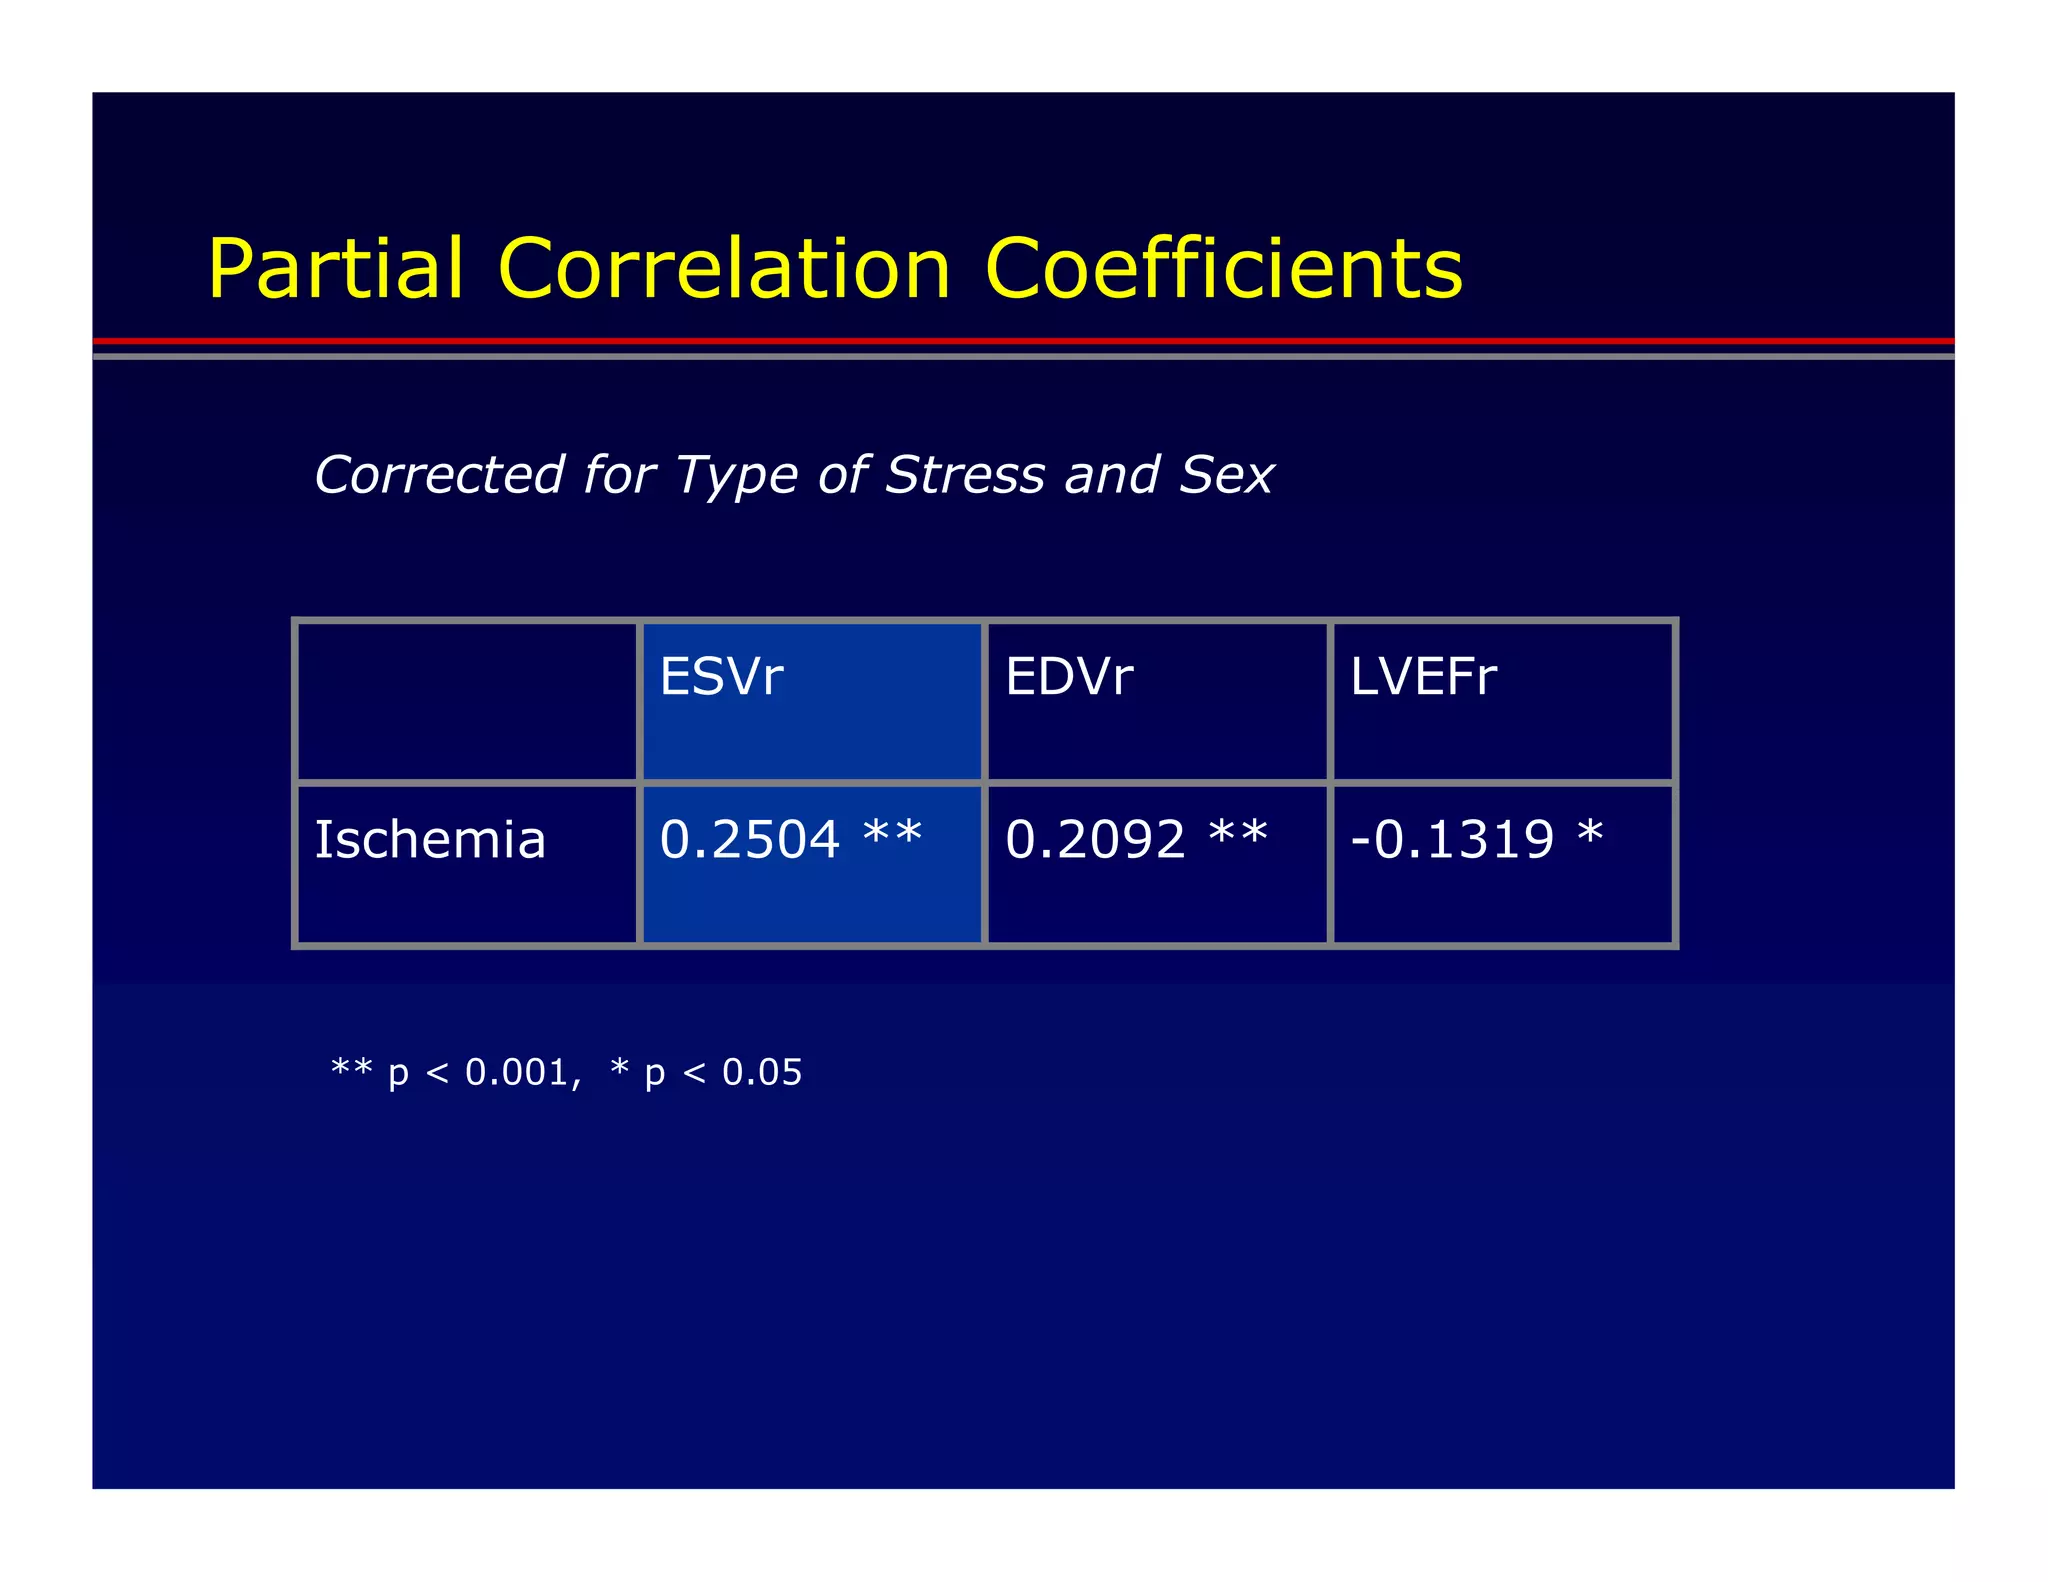
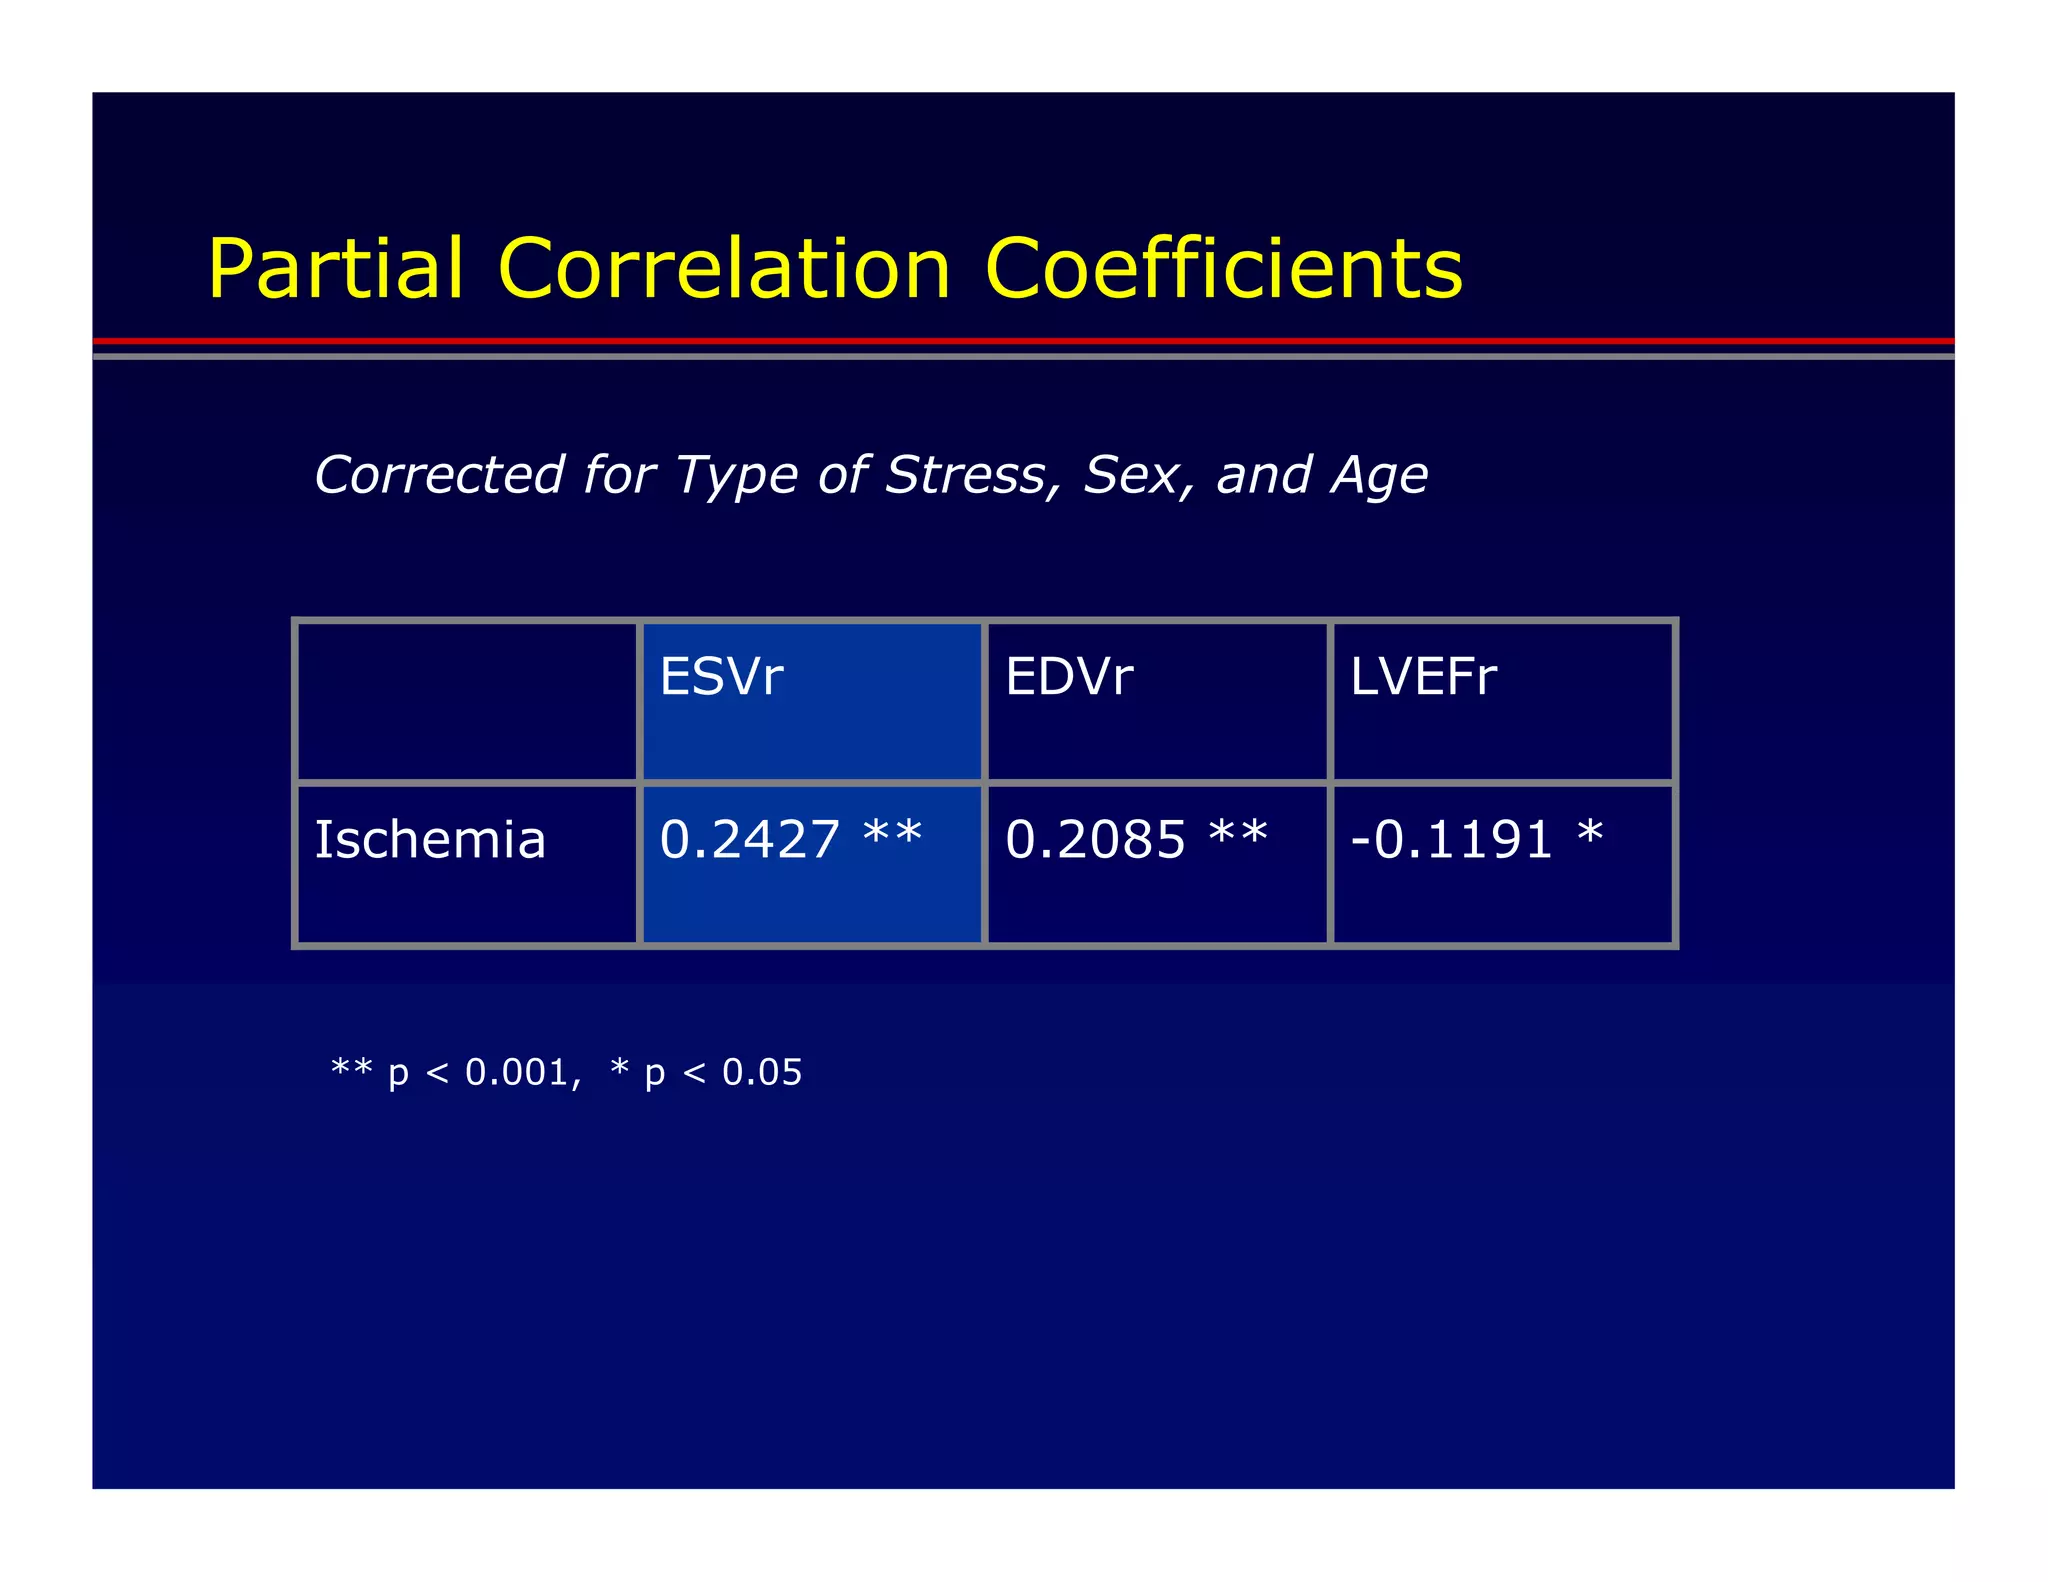
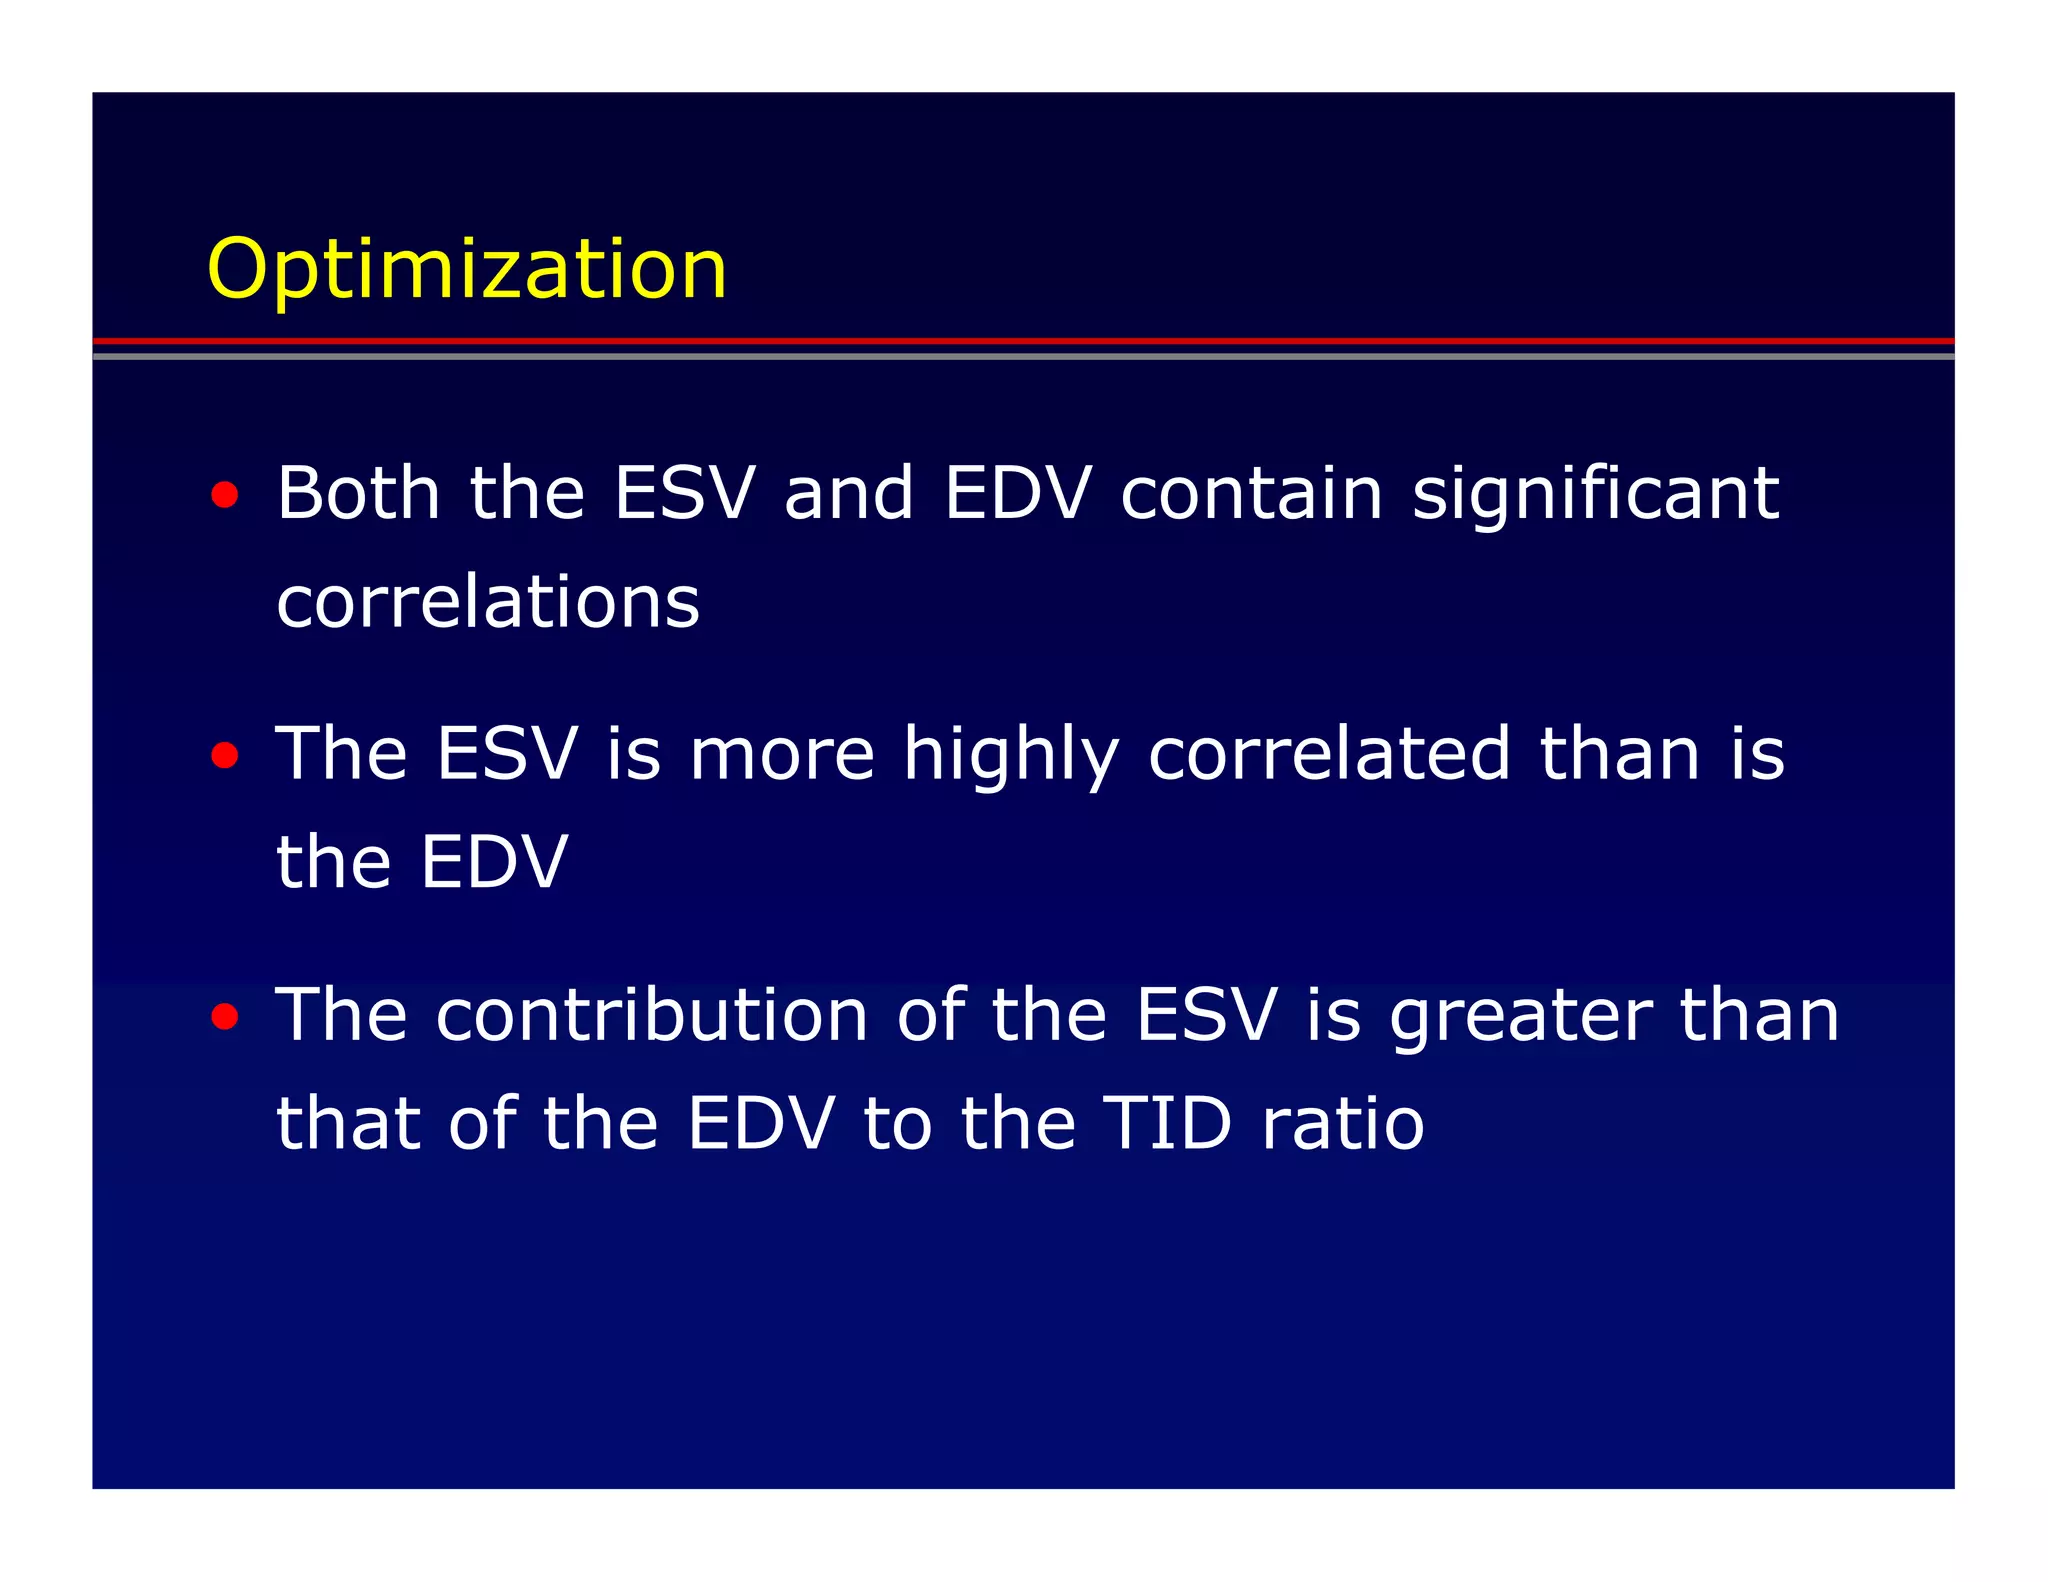
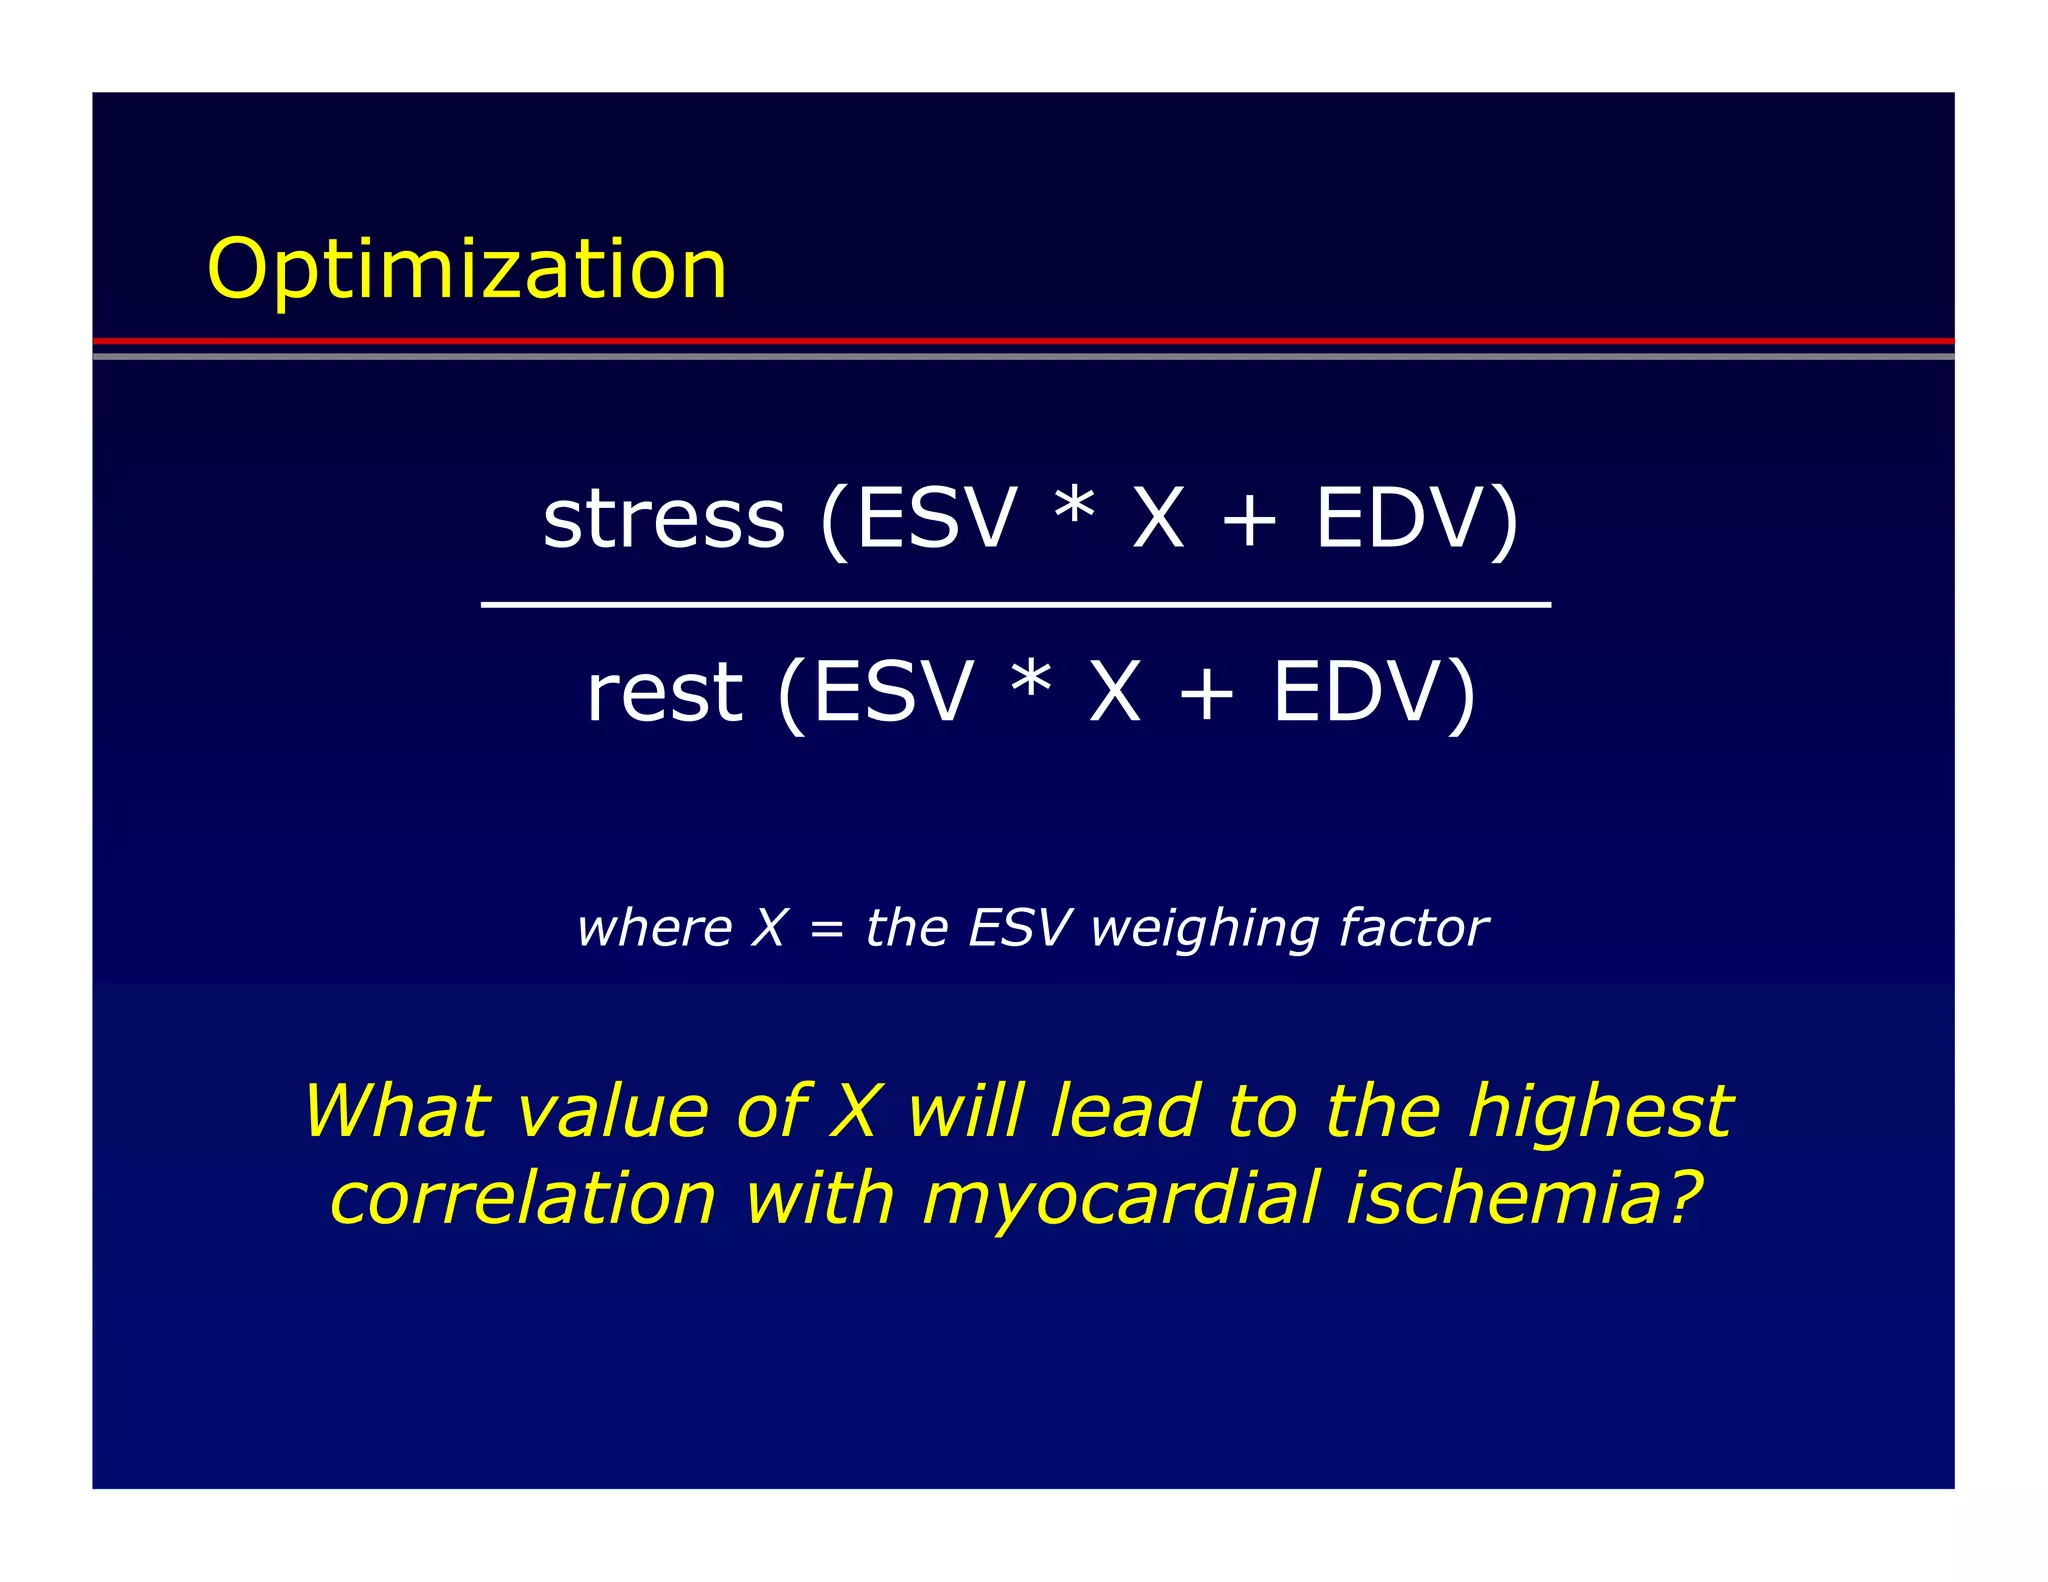
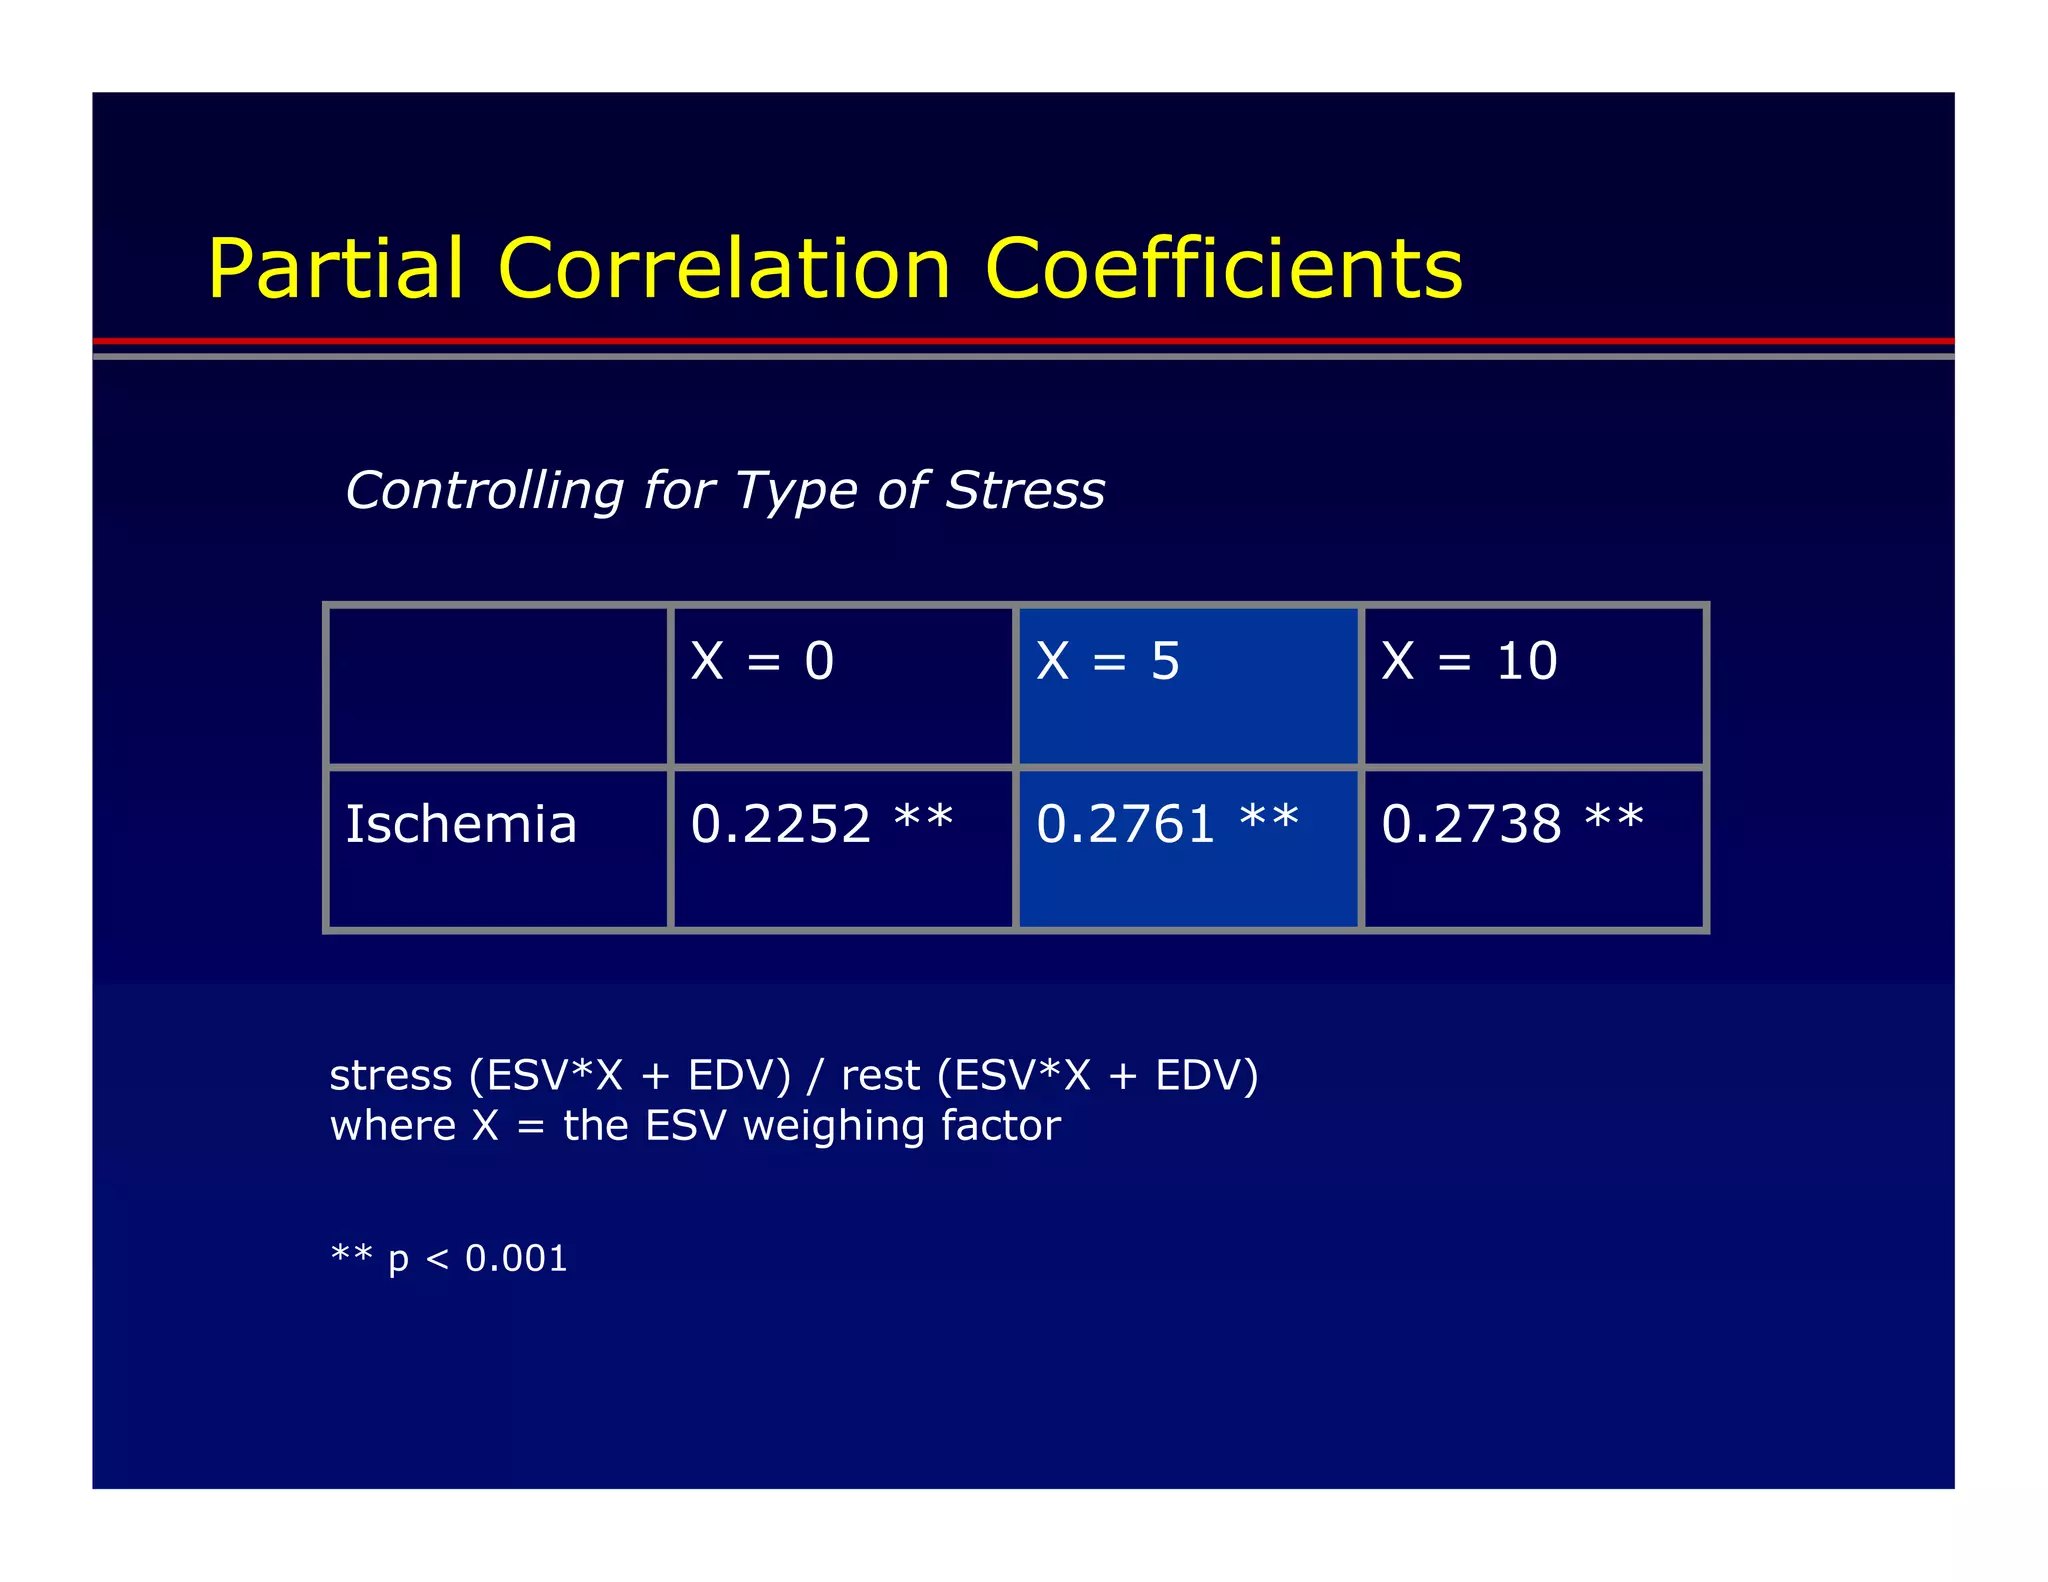
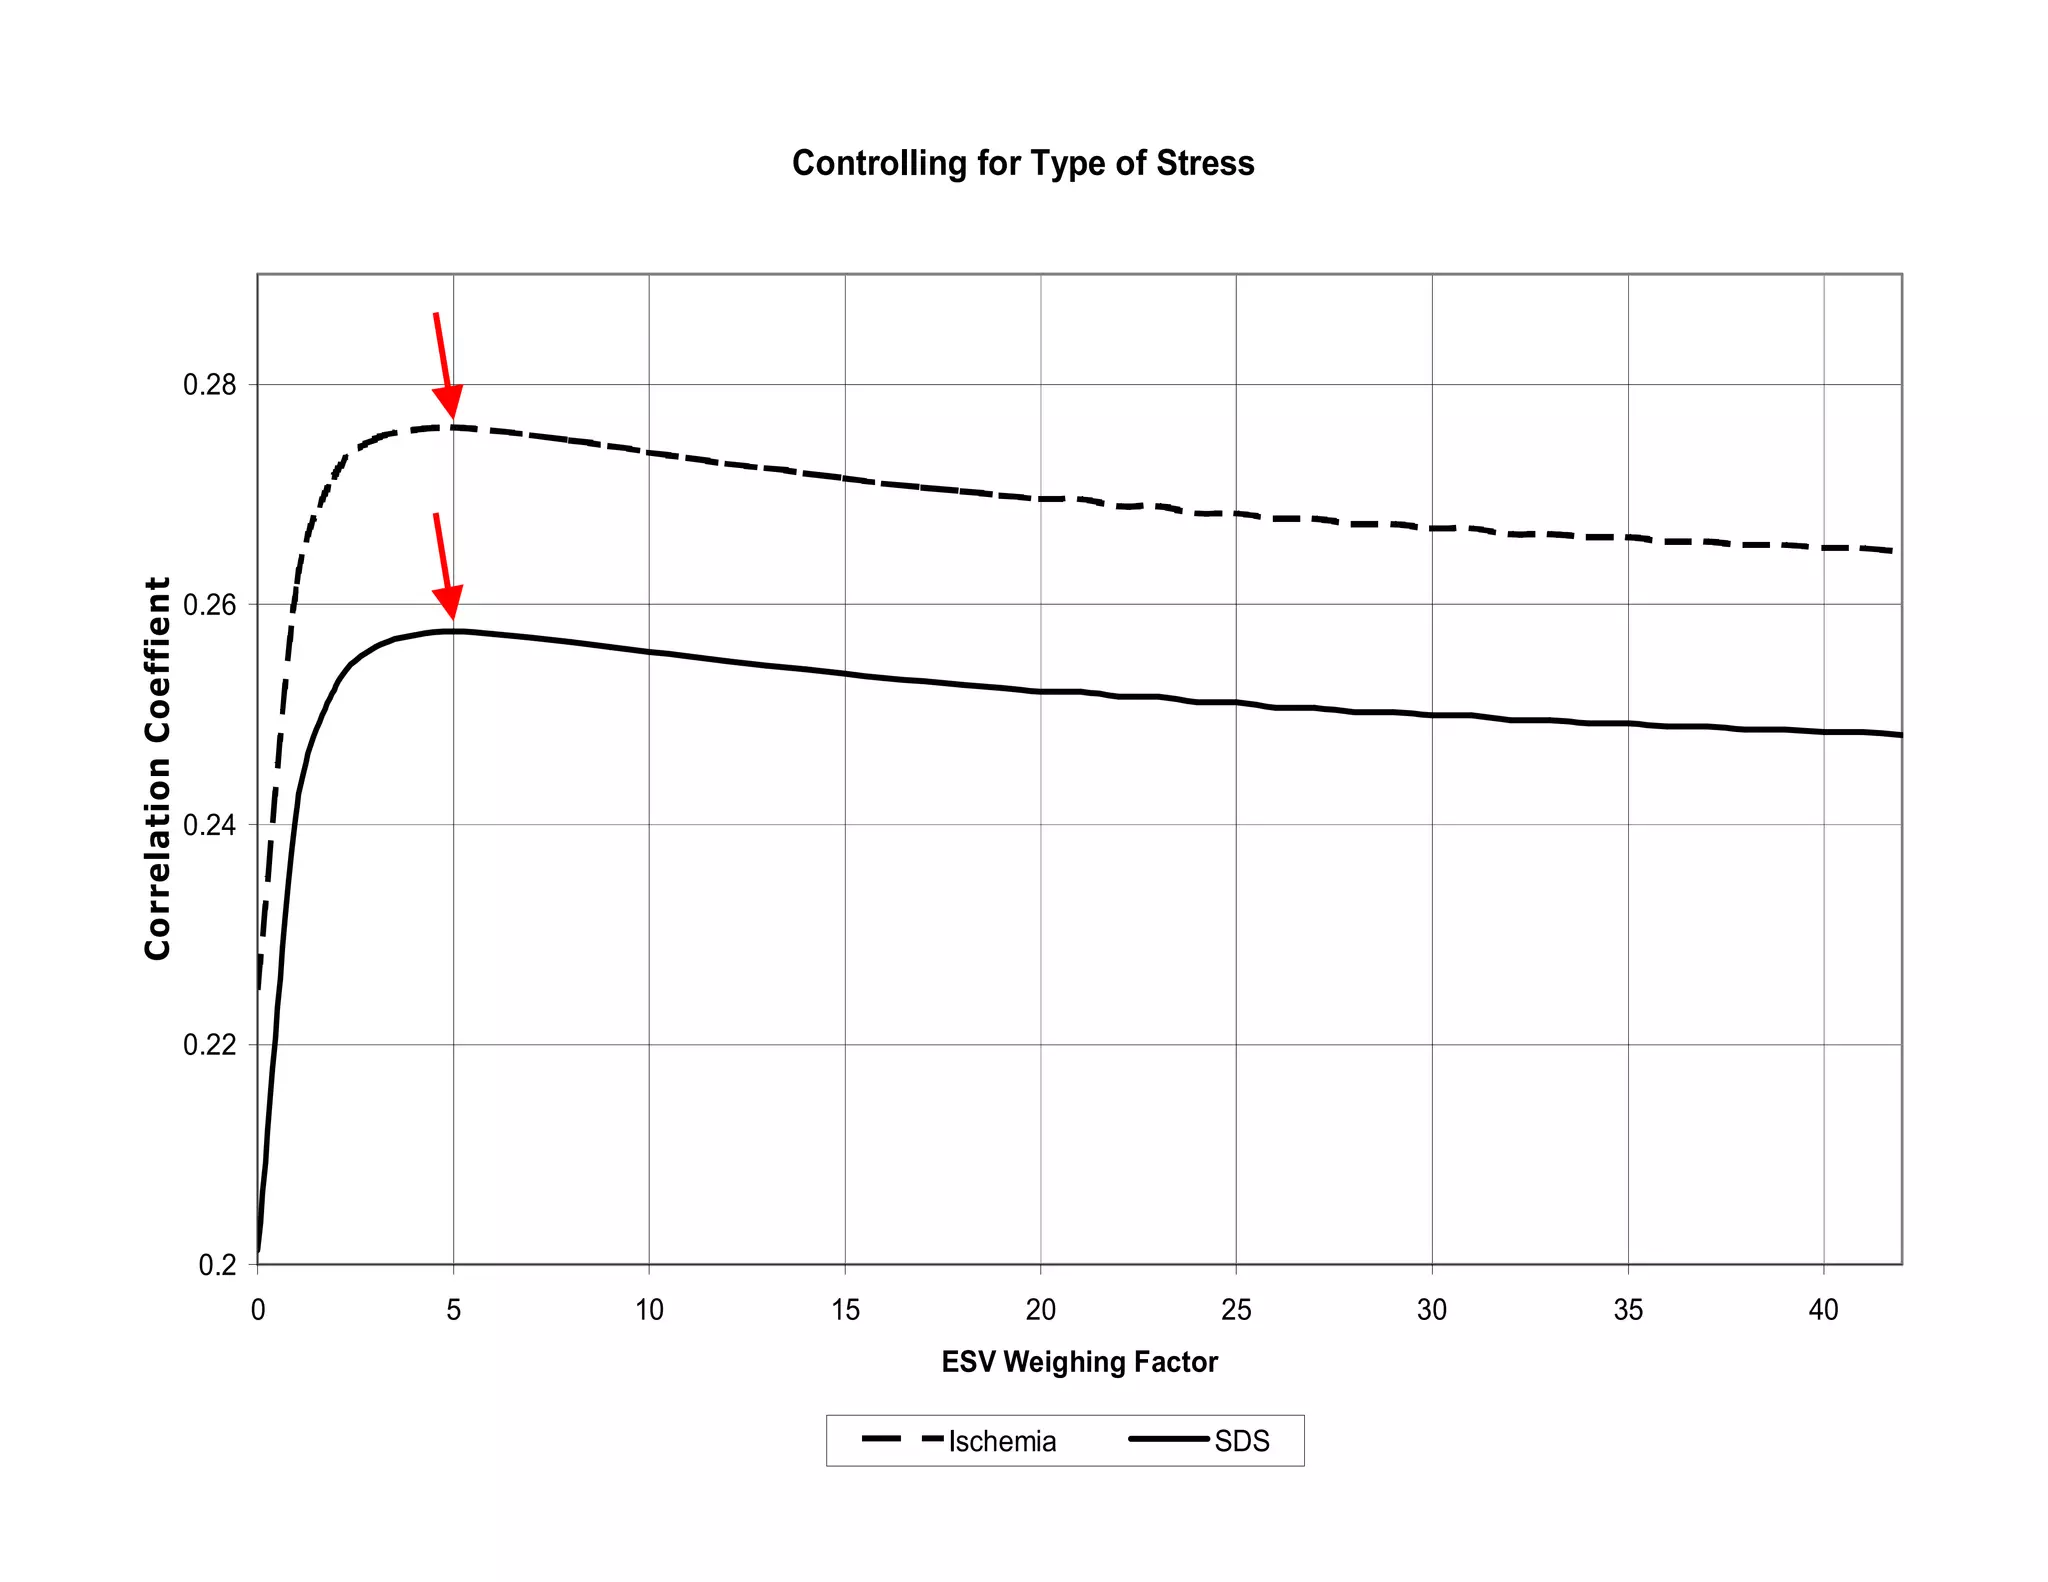
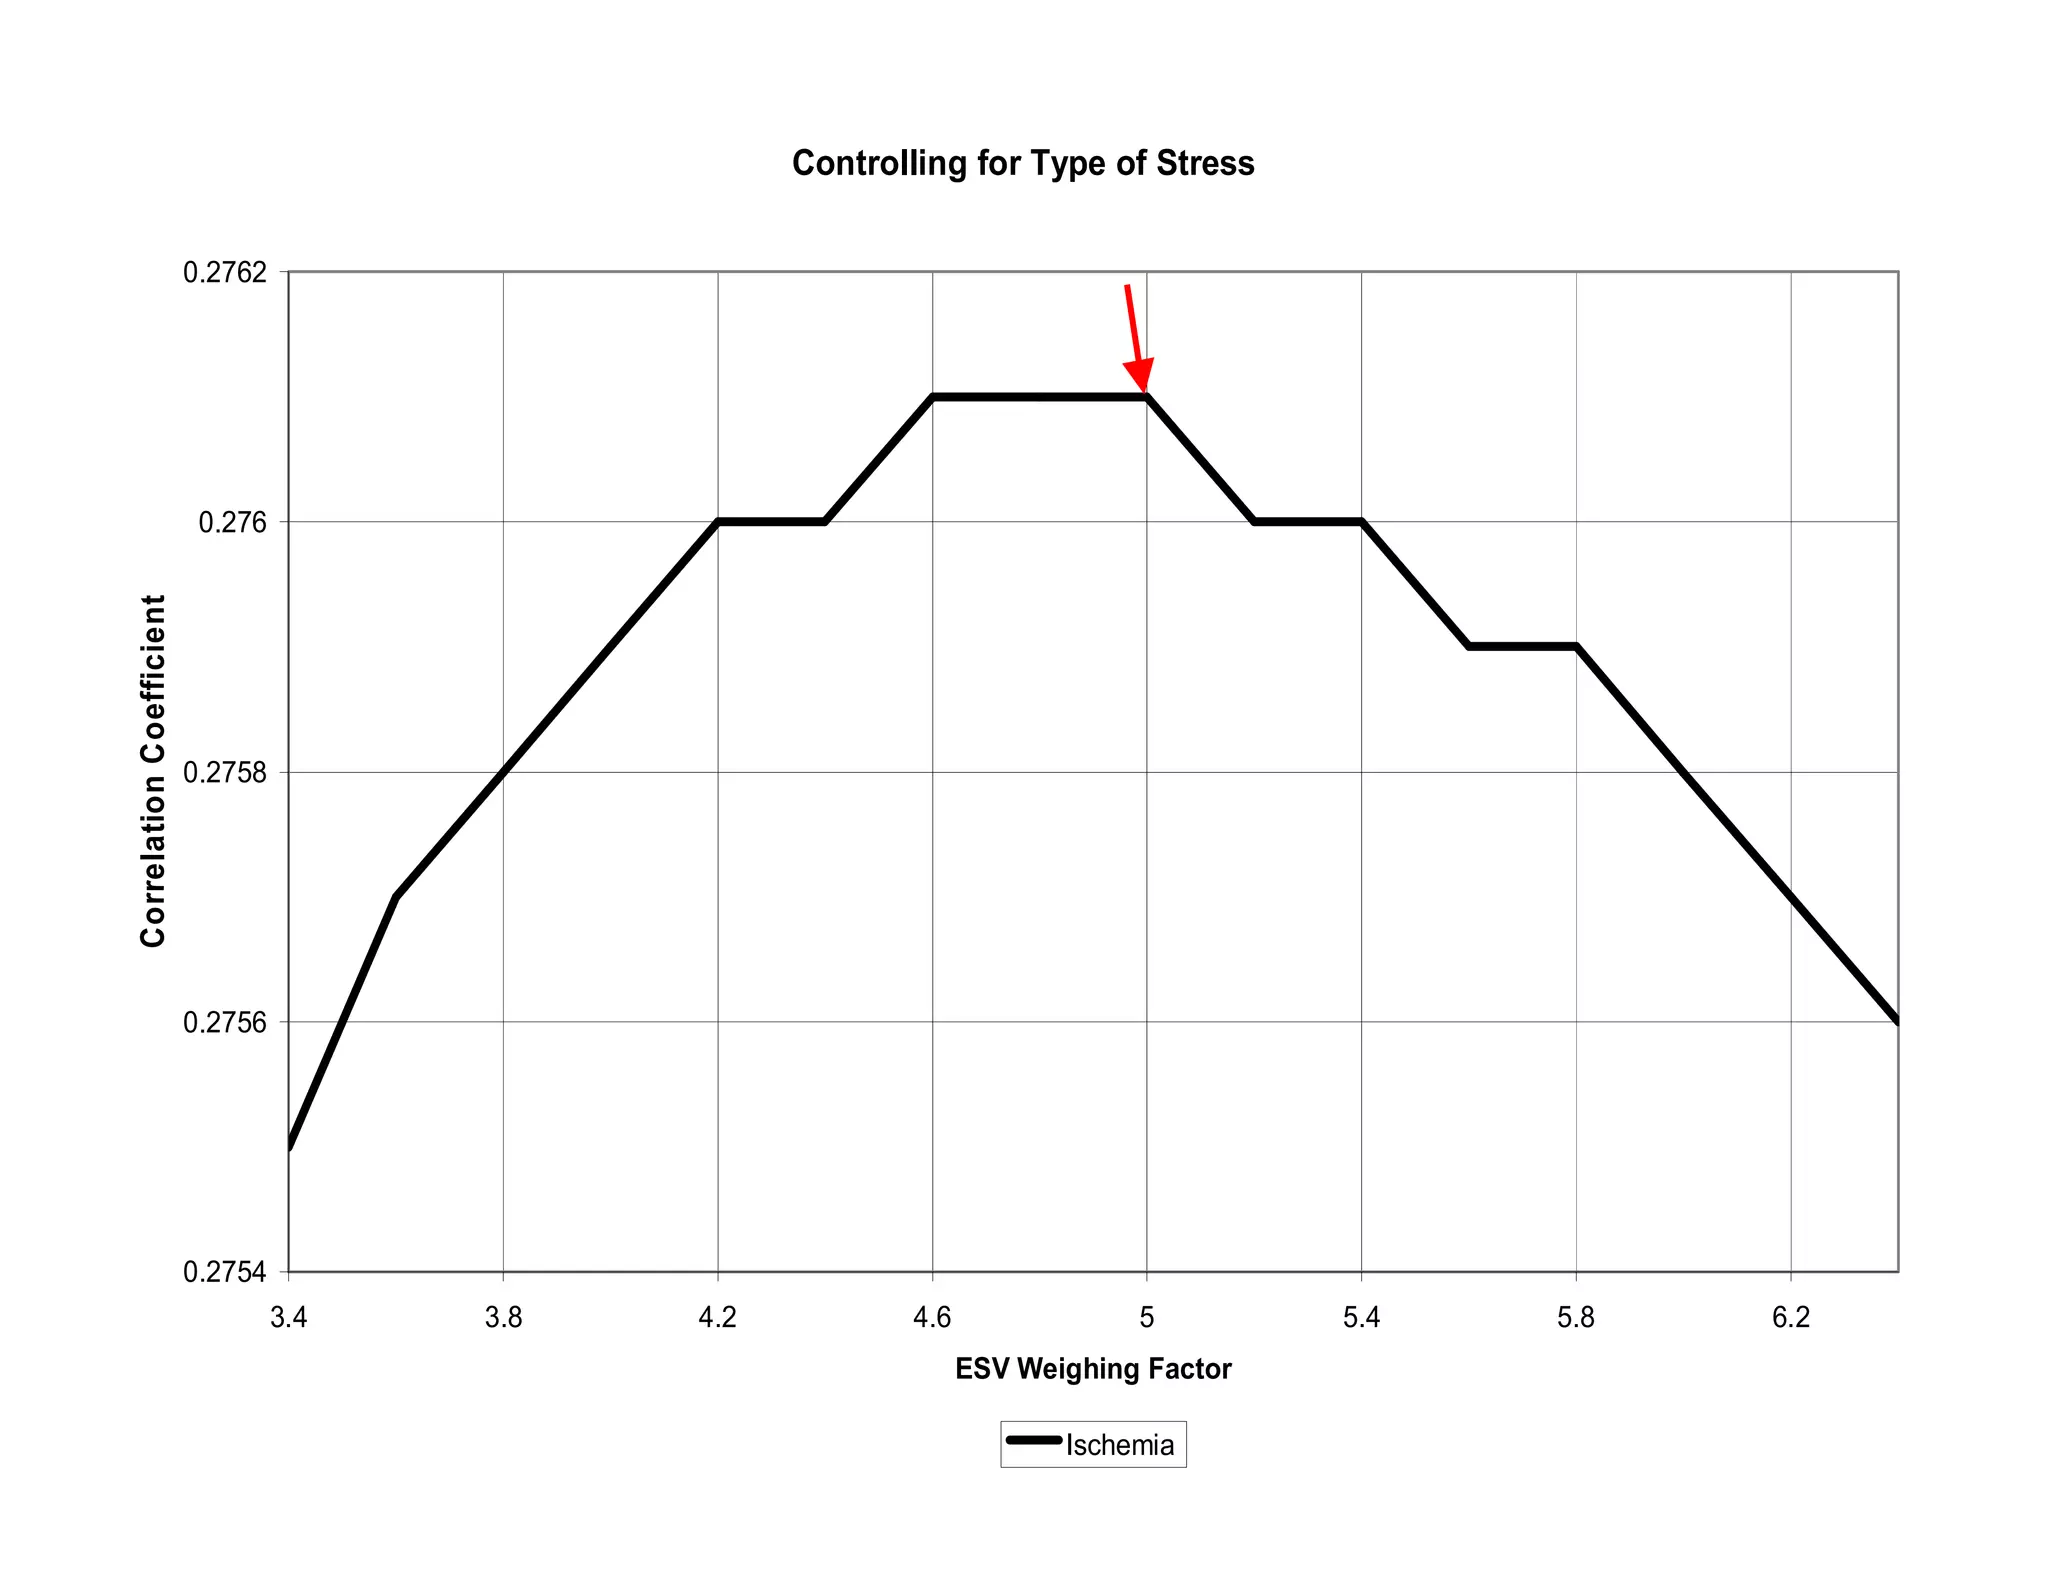
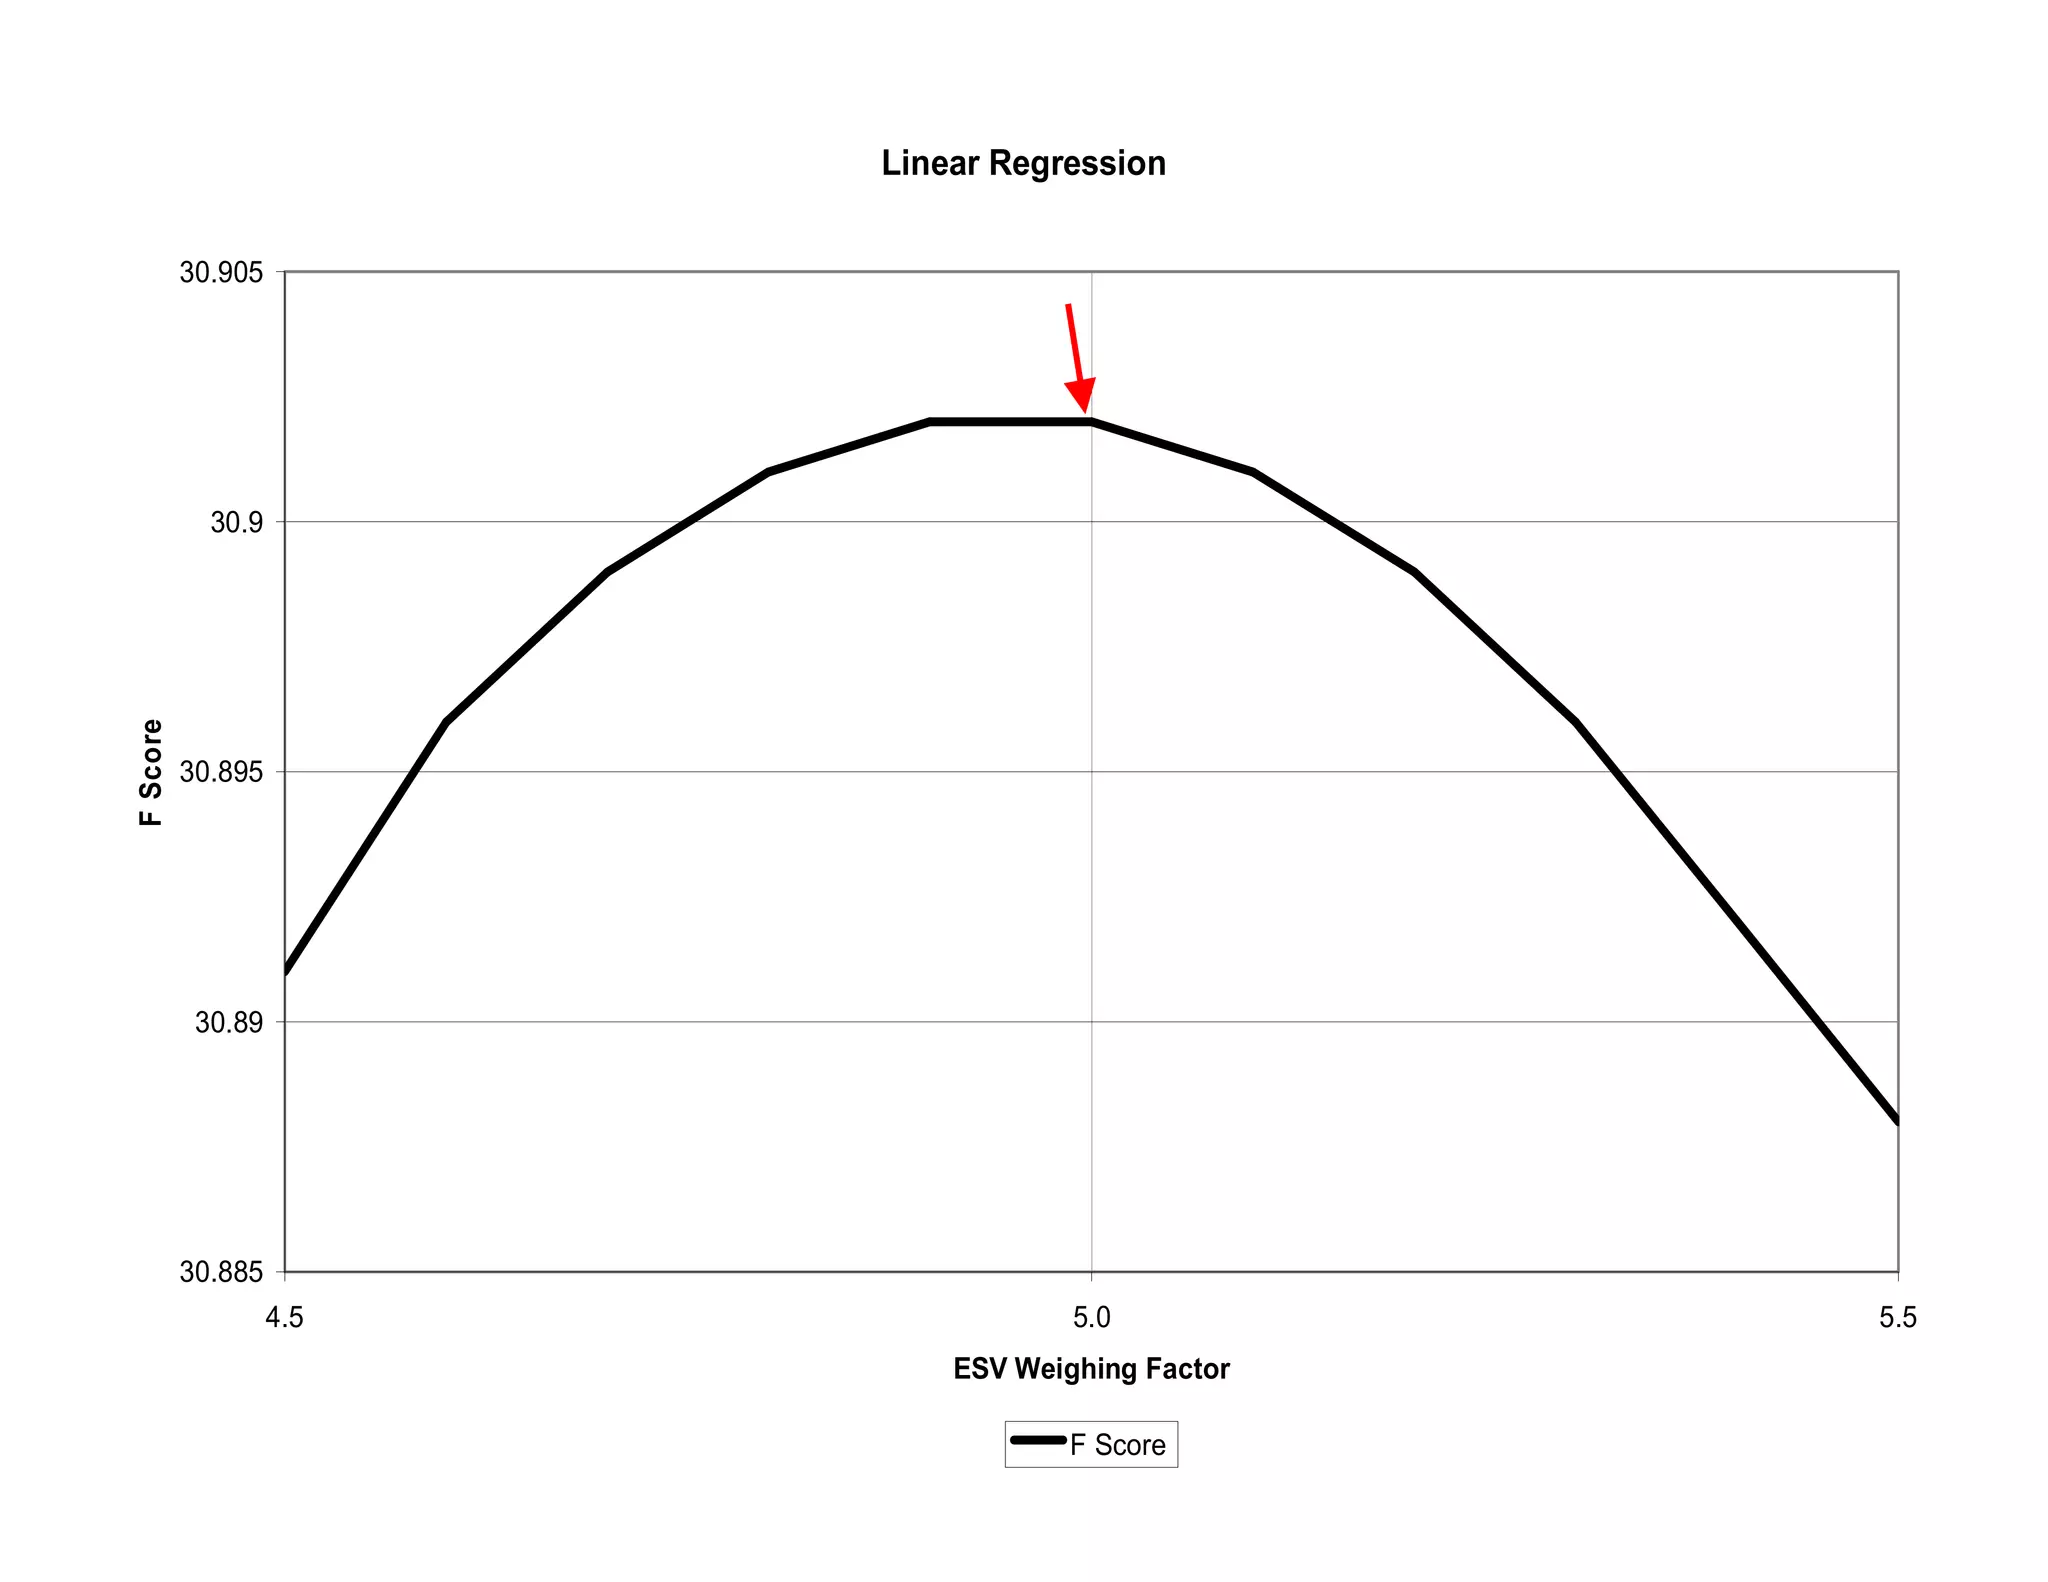
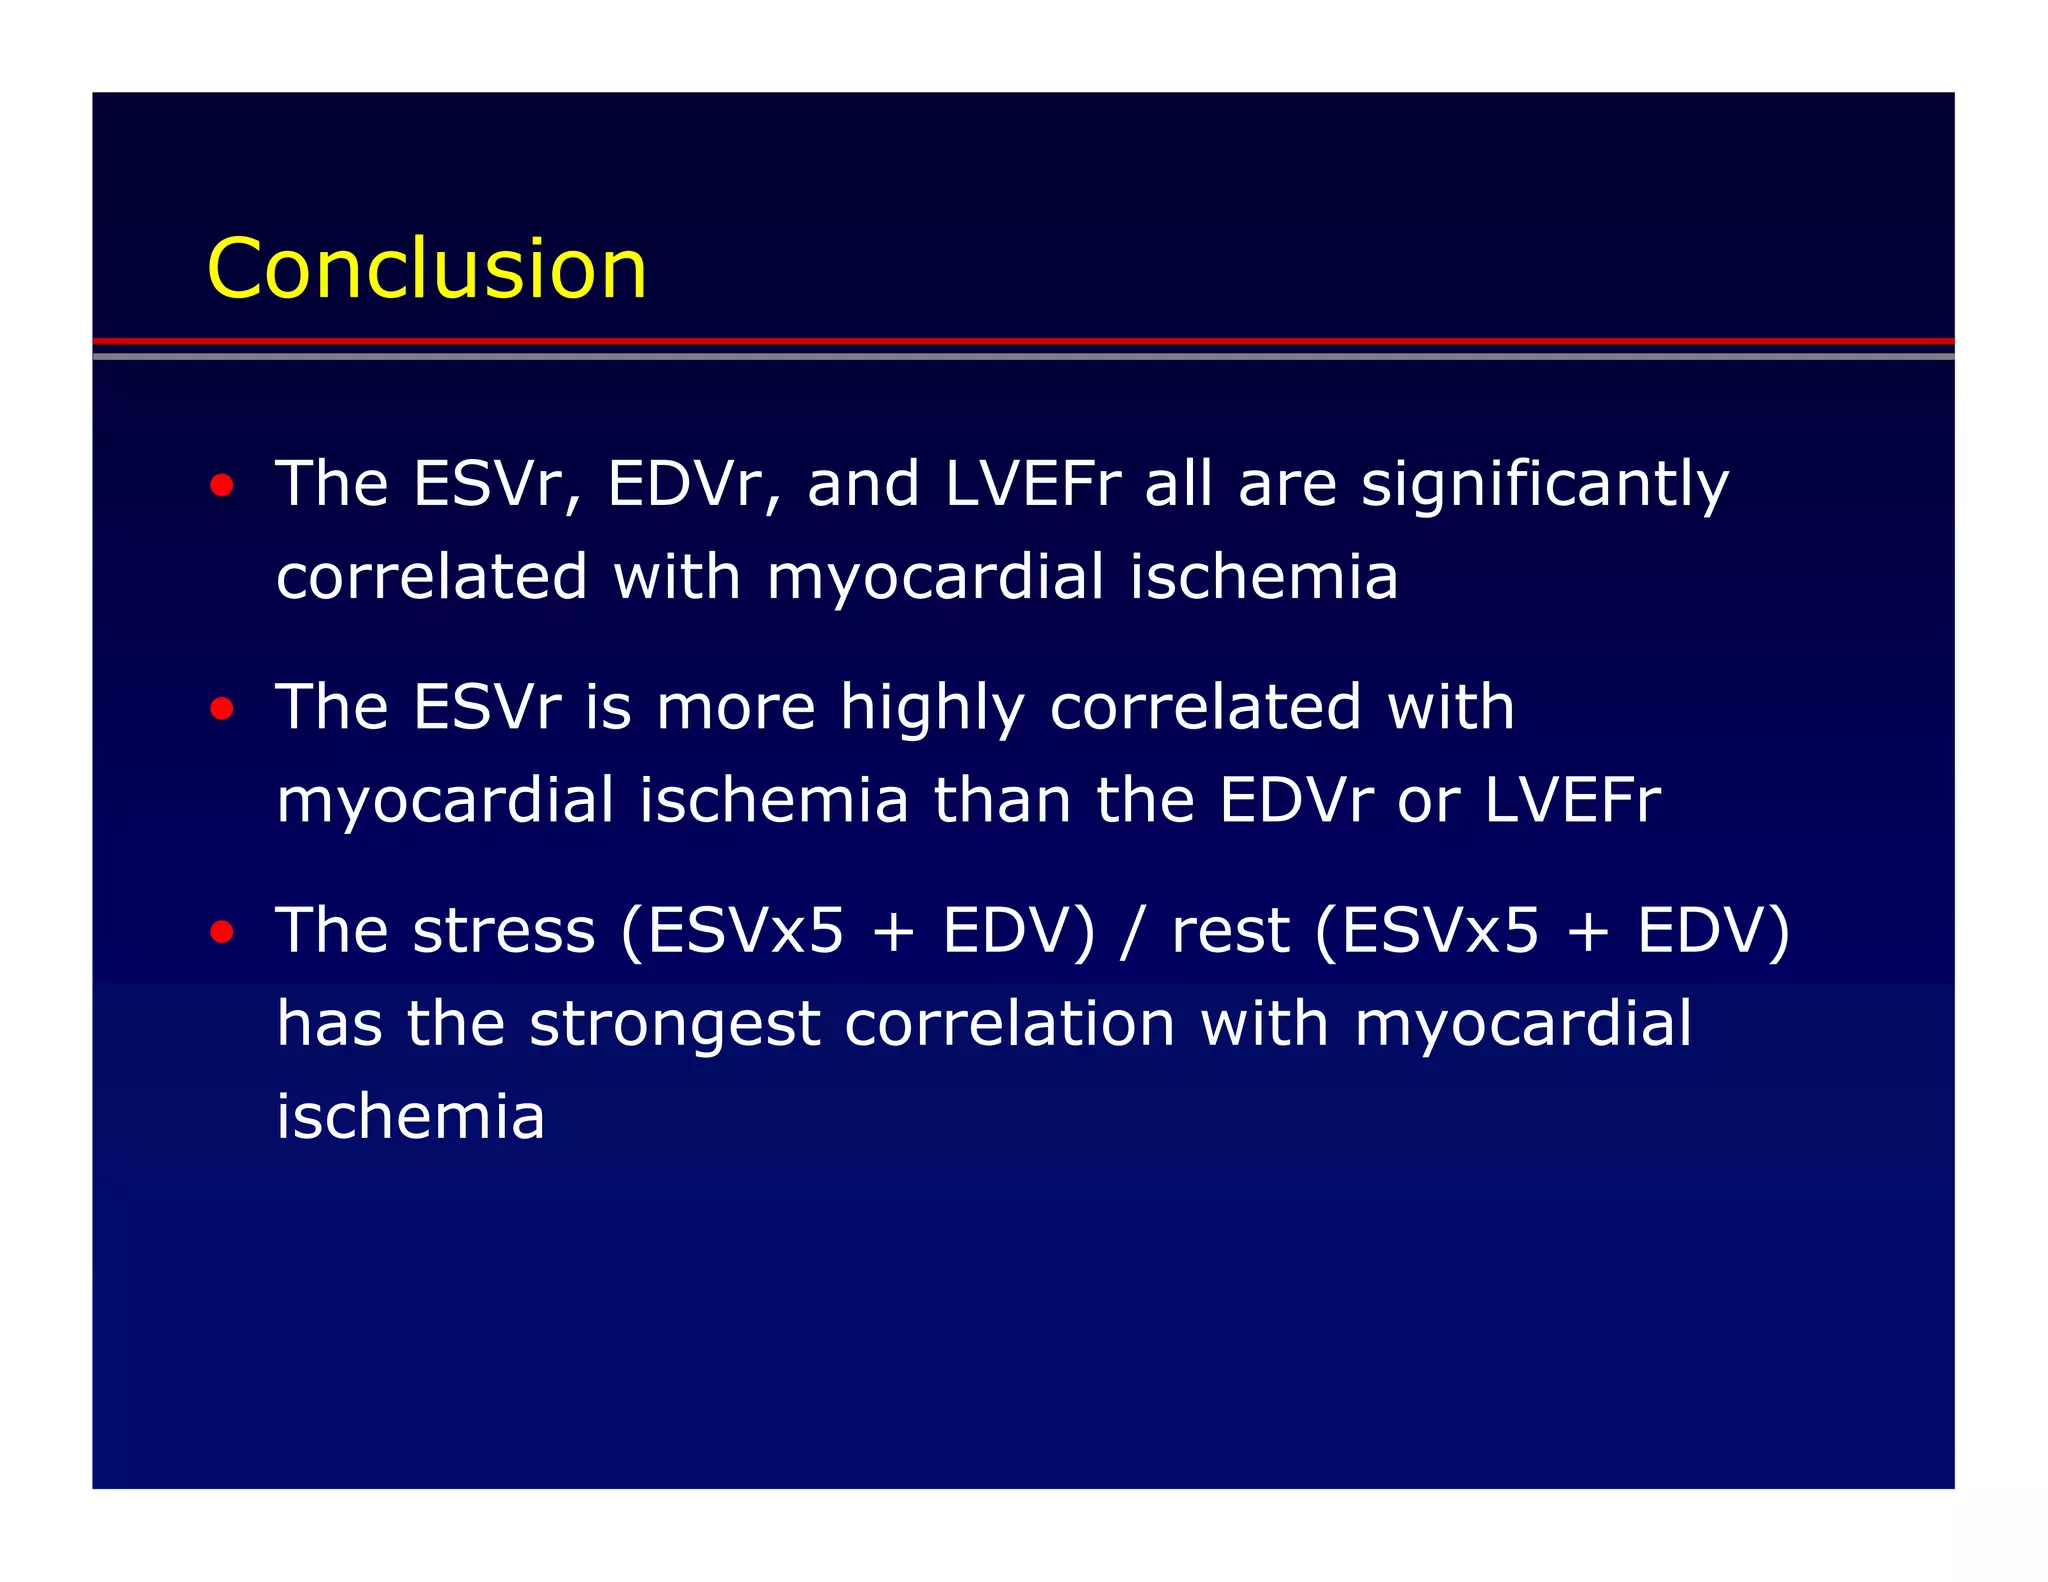
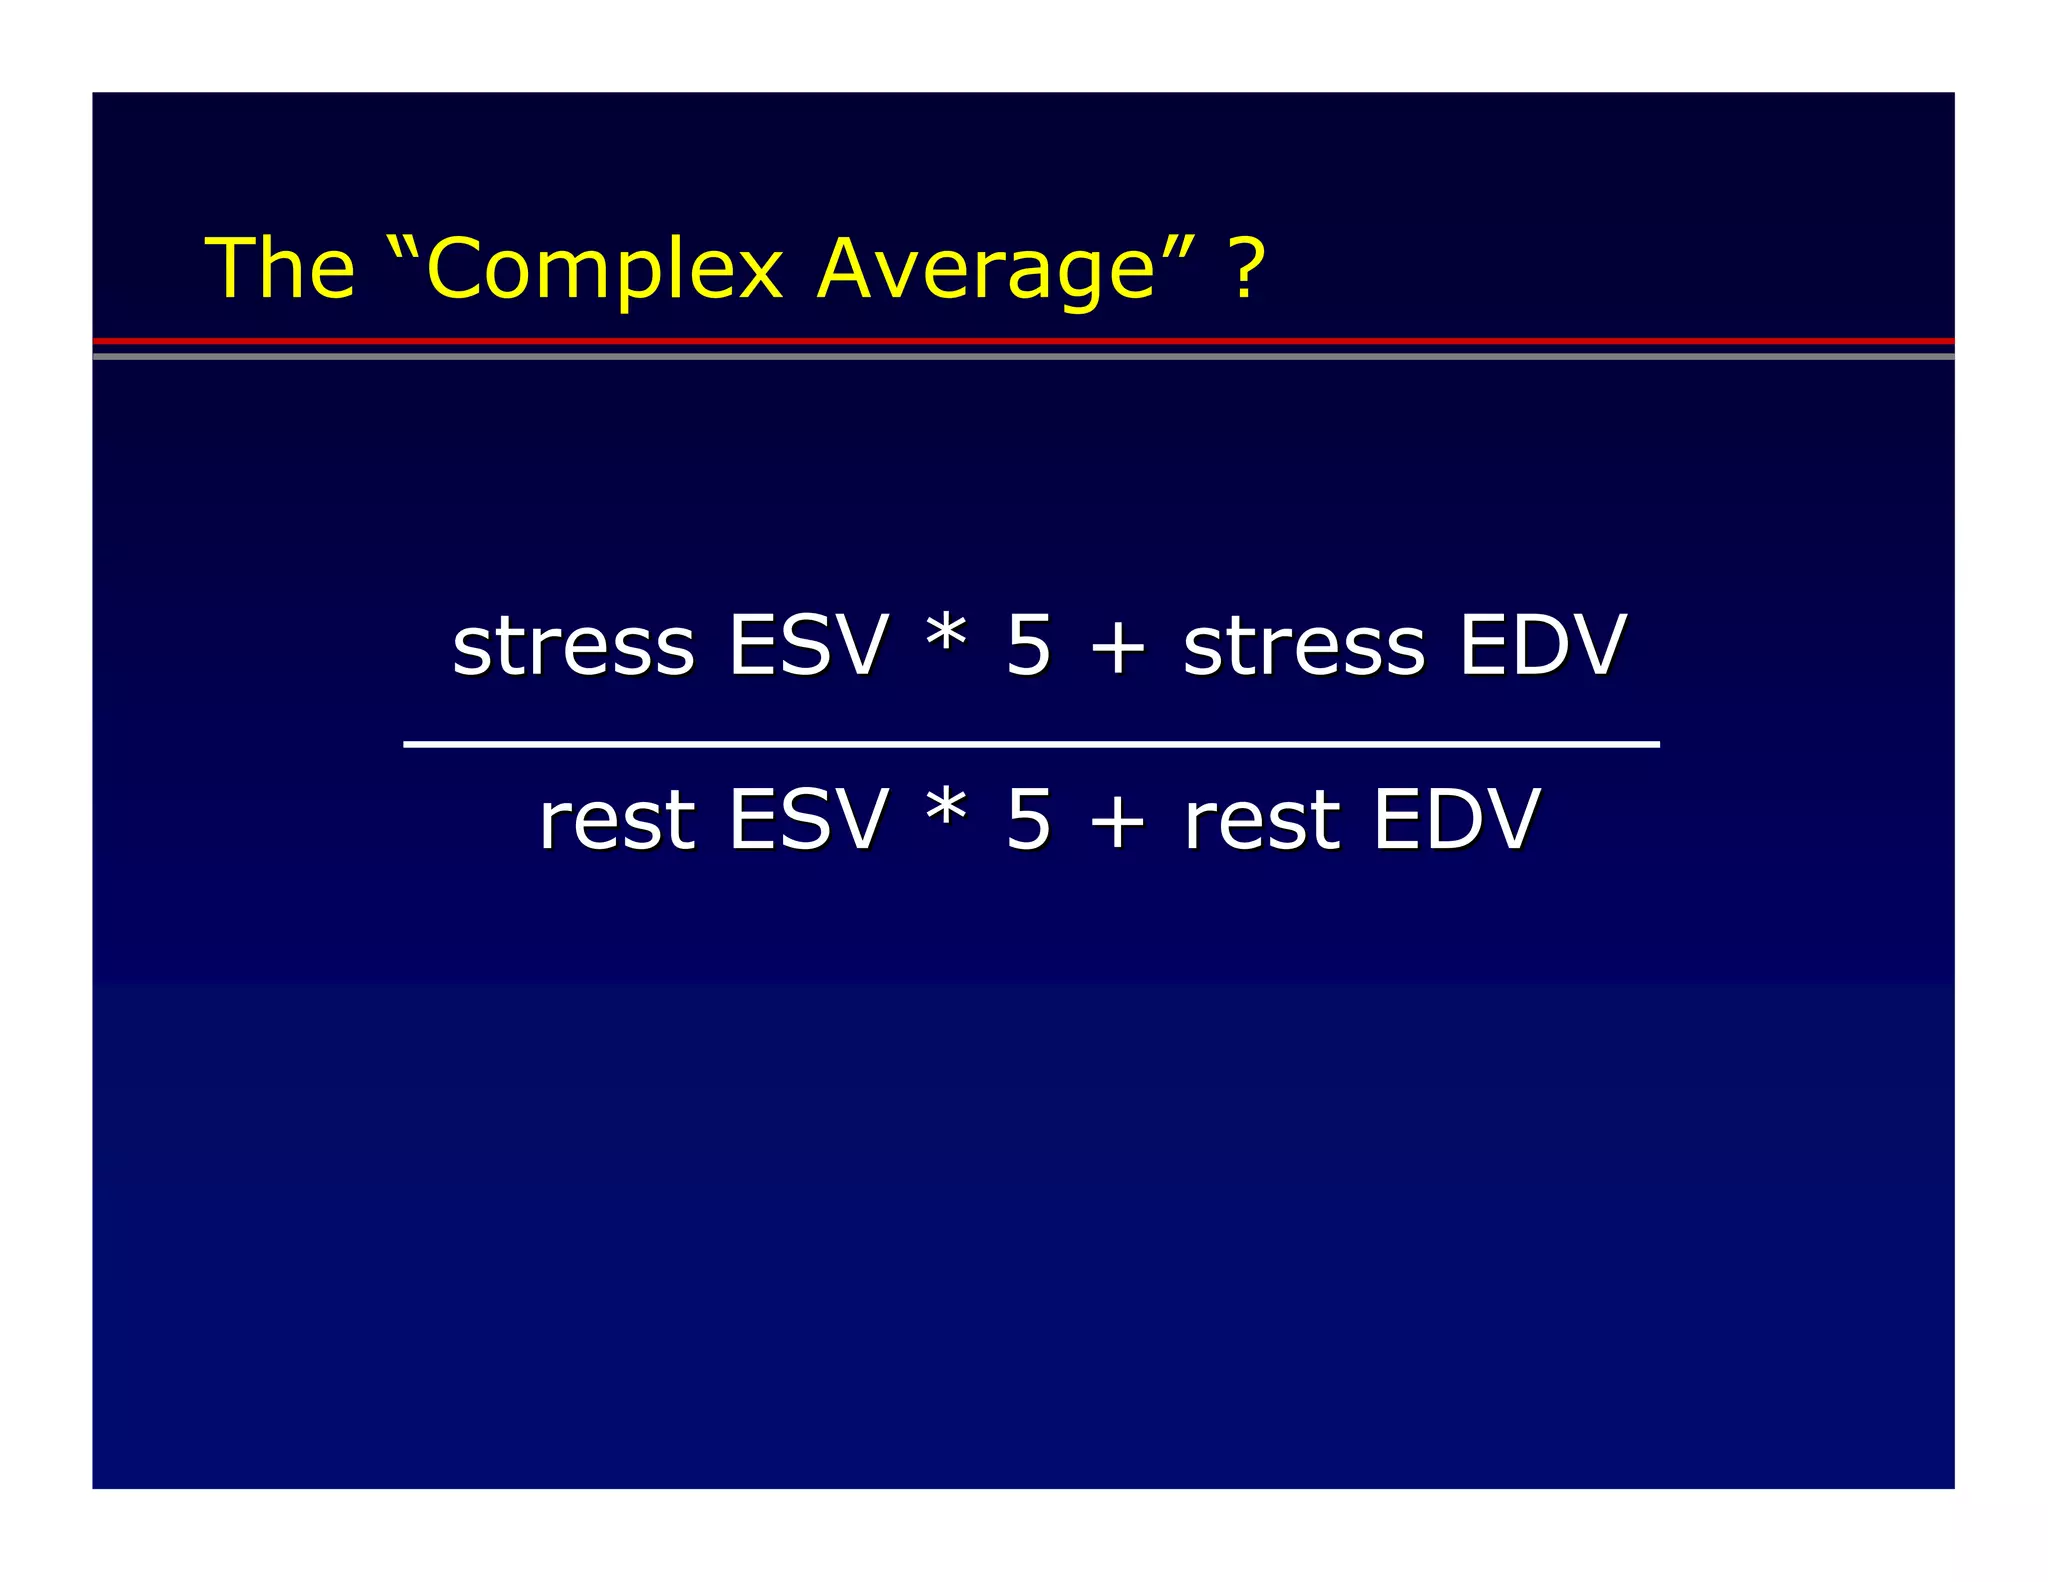
Necessity is the Mother of Invention.
                                                 - Plato


                  The Bitterroot Mountains From Kellogg Peak
Defining Transient Ischemic Dilation

• Background

• Methods

• Results

• Conclusion
Transient Ischemic Dilation

• The ratio of the left ventricular size after
  stress compared to rest

• The left ventricular size is determined
  from the ungated SPECT data

• TID is the ratio of the average wall
  position at stress compared to rest
Transient Ischemic Dilation

 “As such, the volumes associated with this
 measurement should not be considered to
 represent either end-systolic or end-
 diastolic volumes alone but rather a
 complex average of the two.”


        Dan Berman, Rory Hachamovitch, Guido Germano and others,

           as quoted in the J Nucl Med. 2004 Dec;45(12):1999-2007.
Transient Ischemic Dilation
Defining the “Complex Average”

• What is the contribution of the ESV?

• What is the contribution of the EDV?

• Can this complex average be derived from
  the gated SPECT data?
“When you cannot explain it in
numbers, your knowledge is of a
meager and unsatisfactory kind.”

         – Lord Kelvin (William Thomson, 1824-1907)
Defining Transient Ischemic Dilation

• Background

• Methods

• Results

• Conclusion
Methods

• Retrospective review of 422 consecutive
  patients

• Ischemia determined semi-quantitatively
  using a 17 segment, 5 point scale

• Post-stress to rest ventricular volume
  ratios correlated with ischemia
Defining Transient Ischemic Dilation

• Background

• Methods

• Results

• Conclusion
Ventricular Volume Ratios


                   ESVr             EDVr              LVEFr


   Ischemia + 1.02                  1.00              1.02


   Ischemia – 0.84                  0.92              1.06


   Difference      0.18 **          0.08 **           - 0.04 *


  ** p < 0.01, * p < 0.05 for the presence or absence of ischemia using
  the independent samples t-test
Pearson Correlation Coefficients


                 ESVr       EDVr       LVEFr


  Ischemia       0.259 **   0.227 **   -0.112 *


  ** p < 0.01, * p < 0.05
Partial Correlation Coefficients

  Corrected for Type of Stress


                   ESVr        EDVr        LVEFr


  Ischemia         0.2560 **   0.2252 **   -0.1239 *


   ** p < 0.001, * p < 0.05
Partial Correlation Coefficients

  Corrected for Type of Stress and Sex


                   ESVr        EDVr        LVEFr


  Ischemia         0.2504 **   0.2092 **   -0.1319 *


   ** p < 0.001, * p < 0.05
Partial Correlation Coefficients

  Corrected for Type of Stress, Sex, and Age


                   ESVr        EDVr        LVEFr


  Ischemia         0.2427 **   0.2085 **   -0.1191 *


   ** p < 0.001, * p < 0.05
Optimization

• Both the ESV and EDV contain significant
  correlations

• The ESV is more highly correlated than is
  the EDV

• The contribution of the ESV is greater than
  that of the EDV to the TID ratio
Optimization


        stress (ESV * X + EDV)

         rest (ESV * X + EDV)

         where X = the ESV weighing factor


  What value of X will lead to the highest
  correlation with myocardial ischemia?
Partial Correlation Coefficients

   Controlling for Type of Stress


                  X=0             X=5          X = 10


   Ischemia       0.2252 **       0.2761 **    0.2738 **


   stress (ESV*X + EDV) / rest (ESV*X + EDV)
   where X = the ESV weighing factor


   ** p < 0.001
Controlling for Type of Stress


                        0.28
Correlation Coeffient


                        0.26


                        0.24


                        0.22


                         0.2
                               0   5   10     15           20              25   30   35   40
                                                     ESV Weighing Factor

                                                      Ischemia         SDS
Controlling for Type of Stress

                          0.2762


                           0.276
Correlation Coefficient


                          0.2758


                          0.2756


                          0.2754
                                   3.4   3.8   4.2          4.6               5         5.4   5.8   6.2
                                                                  ESV Weighing Factor

                                                                         Ischemia
Linear Regression

          30.905


            30.9
F Score


          30.895


           30.89


          30.885
                   4.5               5.0           5.5
                             ESV Weighing Factor

                                     F Score
Defining Transient Ischemic Dilation

• Background

• Methods

• Results

• Conclusion
Conclusion

• The ESVr, EDVr, and LVEFr all are significantly
  correlated with myocardial ischemia

• The ESVr is more highly correlated with
  myocardial ischemia than the EDVr or LVEFr

• The stress (ESVx5 + EDV) / rest (ESVx5 + EDV)
  has the strongest correlation with myocardial
  ischemia
The “Complex Average” ?


     stress ESV * 5 + stress EDV

       rest ESV * 5 + rest EDV

Redefining the Transient Ischemic Dilation Ratio

  • 2.
    Necessity is theMother of Invention. - Plato The Bitterroot Mountains From Kellogg Peak
  • 3.
    Defining Transient IschemicDilation • Background • Methods • Results • Conclusion
  • 4.
    Transient Ischemic Dilation •The ratio of the left ventricular size after stress compared to rest • The left ventricular size is determined from the ungated SPECT data • TID is the ratio of the average wall position at stress compared to rest
  • 5.
    Transient Ischemic Dilation “As such, the volumes associated with this measurement should not be considered to represent either end-systolic or end- diastolic volumes alone but rather a complex average of the two.” Dan Berman, Rory Hachamovitch, Guido Germano and others, as quoted in the J Nucl Med. 2004 Dec;45(12):1999-2007.
  • 6.
  • 7.
    Defining the “ComplexAverage” • What is the contribution of the ESV? • What is the contribution of the EDV? • Can this complex average be derived from the gated SPECT data?
  • 8.
    “When you cannotexplain it in numbers, your knowledge is of a meager and unsatisfactory kind.” – Lord Kelvin (William Thomson, 1824-1907)
  • 9.
    Defining Transient IschemicDilation • Background • Methods • Results • Conclusion
  • 10.
    Methods • Retrospective reviewof 422 consecutive patients • Ischemia determined semi-quantitatively using a 17 segment, 5 point scale • Post-stress to rest ventricular volume ratios correlated with ischemia
  • 11.
    Defining Transient IschemicDilation • Background • Methods • Results • Conclusion
  • 12.
    Ventricular Volume Ratios ESVr EDVr LVEFr Ischemia + 1.02 1.00 1.02 Ischemia – 0.84 0.92 1.06 Difference 0.18 ** 0.08 ** - 0.04 * ** p < 0.01, * p < 0.05 for the presence or absence of ischemia using the independent samples t-test
  • 13.
    Pearson Correlation Coefficients ESVr EDVr LVEFr Ischemia 0.259 ** 0.227 ** -0.112 * ** p < 0.01, * p < 0.05
  • 14.
    Partial Correlation Coefficients Corrected for Type of Stress ESVr EDVr LVEFr Ischemia 0.2560 ** 0.2252 ** -0.1239 * ** p < 0.001, * p < 0.05
  • 15.
    Partial Correlation Coefficients Corrected for Type of Stress and Sex ESVr EDVr LVEFr Ischemia 0.2504 ** 0.2092 ** -0.1319 * ** p < 0.001, * p < 0.05
  • 16.
    Partial Correlation Coefficients Corrected for Type of Stress, Sex, and Age ESVr EDVr LVEFr Ischemia 0.2427 ** 0.2085 ** -0.1191 * ** p < 0.001, * p < 0.05
  • 17.
    Optimization • Both theESV and EDV contain significant correlations • The ESV is more highly correlated than is the EDV • The contribution of the ESV is greater than that of the EDV to the TID ratio
  • 18.
    Optimization stress (ESV * X + EDV) rest (ESV * X + EDV) where X = the ESV weighing factor What value of X will lead to the highest correlation with myocardial ischemia?
  • 19.
    Partial Correlation Coefficients Controlling for Type of Stress X=0 X=5 X = 10 Ischemia 0.2252 ** 0.2761 ** 0.2738 ** stress (ESV*X + EDV) / rest (ESV*X + EDV) where X = the ESV weighing factor ** p < 0.001
  • 20.
    Controlling for Typeof Stress 0.28 Correlation Coeffient 0.26 0.24 0.22 0.2 0 5 10 15 20 25 30 35 40 ESV Weighing Factor Ischemia SDS
  • 21.
    Controlling for Typeof Stress 0.2762 0.276 Correlation Coefficient 0.2758 0.2756 0.2754 3.4 3.8 4.2 4.6 5 5.4 5.8 6.2 ESV Weighing Factor Ischemia
  • 22.
    Linear Regression 30.905 30.9 F Score 30.895 30.89 30.885 4.5 5.0 5.5 ESV Weighing Factor F Score
  • 23.
    Defining Transient IschemicDilation • Background • Methods • Results • Conclusion
  • 24.
    Conclusion • The ESVr,EDVr, and LVEFr all are significantly correlated with myocardial ischemia • The ESVr is more highly correlated with myocardial ischemia than the EDVr or LVEFr • The stress (ESVx5 + EDV) / rest (ESVx5 + EDV) has the strongest correlation with myocardial ischemia
  • 25.
    The “Complex Average”? stress ESV * 5 + stress EDV rest ESV * 5 + rest EDV