SlideShare a Scribd company logo
1 of 85
Download to read offline
1
Marketing Strategy and Customer comforts
with reference to Bharat Big cinemas
Doc: M.B.A( Marketing) -V.T.U final semester project.
Name: Swasthik Shetty
Qualification: B.E, MBA
College: St.Joseph Mangalore (Mysore Region)
Year: 2011-2013
Project place: Big cinemas Mangalore
2
EXECUTIVE SUMMARY
Entertainment Industry today is being redefined in terms of content, delivery mechanisms and
the emerging technologies. The Film Industry is overwhelmed by the growth of multiplexes,
which has changed not only the entire entertainment experience for the consumers but also
impacted the movie making business. The Television Industry continues to boom new channels
being launched and new content formats emerging such as reality shows, niche and kid’s
channels. Here again, emerging technologies such as broadband and digitalization will cover the
way for growth in this segment.
The Indian entertainment and media industry has out-performed the Indian economy and is one
of the fastest growing sectors in India. The entertainment and media industry generally tends to
grow faster when the economy is expanding. The Indian economy has been growing at a fast clip
over the last few years, and the income levels too have been experiencing a high growth rate.
Above that, consumer spending is also on the rise, due to a sustained increase in disposable
incomes, brought about by reduction in personal income tax over the last decade. All these
factors have given an impetus to the entertainment and media industry and are likely to
contribute to the growth of this industry in the future. Based on industry feedback, additional
sections showcasing the emerging International Trends in each segment have been included in
this year’s report. We thank Big cinemas for drawing the necessary knowledge from their global
resources for this endeavor. Their effort to present the content of the report in a form that is
interesting and useful, not only to the industry people but also the public at large is greatly
appreciated. The crux of the problem is the Formulation of Innovative Marketing Strategies of
Entertainment Services at Big cinemas, Mangalore. The research objectives include examination
the services offered by Big cinemas, ascertaining the customer satisfaction level and explore the
fun innovation of Big cinemas. The research investigation indicated that the Big cinemas
promotional activities are very effective; services are youth-oriented and have the cutting edge
technology. However constant innovation is needed to sustain its distinctive competitive
advantage.
3
1. INDUSTRY PROFILE
Today, new media of all types must be considered when considering the scope of the
entertainment and media industry. Broadly measured, the entertainment and media industry
spans multiple sectors, from America's 9,042 FM radio stations, to the 1.4 billion movie tickets
sold each year. Meanwhile, Newspapers are finding it increasingly difficult to compete against
Internet news and advertising delivery rivals. Recorded music sales on CD-ROM continue to
suffer while sales of digital music files are soaring. Traditional radio broadcasting is suffering,
finding it increasingly difficult to gather listeners for advertising-based radio programming due
to such alternatives as satellite radio and digital MP3 players. The burning issue affecting all
sectors of the entertainment and media industry is maintaining control of content and audiences
while taking advantage of myriad new electronic delivery venues. Competition in the
entertainment sector is fierce. Gone are the days when television and radio programmers enjoyed
captive audiences who happily sat through ad after ad, or planned their schedules around a
favorite show. Consumers, especially consumers in younger demographics, now demand more
and more control over what they watch, read and listen to. The various Issues related to control
include the factors such as Pricing for content including free-of-charge access; illegal downloads
versus authorized downloads; and full ownership of a paid download versus pay-per-view.
Portability including the ability for a consumer to download once, and then use a file on multiple
platforms and devices including iPods and cell phones, or the ability to share a download with
friends. Delayed viewing or listening such as viewing TV programming at the consumer's
convenience and similar personal video recorders.
The competition among entertainment delivery platforms has intensified; all sectors face
daunting challenges from alternative delivery methods. For example, satellite radio delivery of
subscription based music and talk programming has hit its stride multimillion subscriber counts
for Sirius and its competitor XM. Another example: telecommunications companies such as
AT&T are now delivering television programming to the home via telephone wires, battling
cable and satellite TV firms for market share.
Today Entertainment and media industry in India is seen as one of the most happening market
place in the global market. Currently India is one of the best performing economies in the world.
The magnitude of The Indian Entertainment and Media Industry can be made out from the fact
4
that it has out-performed the Indian economy and is one of the fastest growing sectors in India,
riding on the back of economic growth and rising income levels that India has been experiencing
in the past years with the onus of global entertainment industry expected to touch $1.8 trillion
shifting towards the Asian region, India is well poised to garner a sizable share of it. India’s film
industry is already the largest producer of feature films in the world. In the context of Indian
Entertainment and Media industry, the Filmed Entertainment and Television segment dominate
the industry followed by the Print, Radio and the Music segments. The Indian Entertainment and
Media Industry offers ample opportunities for investing be it animation, films, dubbing, music
etc. This report covers all the important aspects related to the industry with useful and important
data thus offering a useful insight to the investor/reader looking to invest in this sector.
Entry of new players in the year 2005 saw across all segments of the E&M industry. The most
prominent entry was that of the Reliance Group in the filmed entertainment and radio segment.
During 2005, Reliance Capital bought a majority stake in Big cinemas which enabled it to have a
presence across the entire value chain of the filmed entertainment segment ranging from film
production, exhibition and distribution. Through Big cinemas, Reliance also made its entry into
the radio segment by bidding for over 50 FM radio stations across the country with aggregate
bids of over INR 1.5 billion. The other significant entry into the entertainment and media
segment was that of the Tata group, through its subsidiary Videsh Sanchar Nigam Limited
.VSNL tied up with the Paris-based Thomson Group in 2005 with the objective of identifying
opportunities in managing and delivering content for third parties, including broadcasters and
content providers. Thomson Group has partnership with Tata Sky Limited for manufacturing set-
top-boxes and providing sales service and support network for their DTH customers. Foreign
investment Owing to the strong impetus for growth from the economic and demographic factors
coupled with some regulatory corrections, the sector also recently witnessed increasing foreign
investment inflows in most segments of the E&M industry, especially the print media. Recent
examples include foreign investment in English dailies such as Hindustan Times and Business
Standard by Henderson Global and Financial Times respectively. Vernacular media too saw its
share of foreign investment with a strategic equity investment by Independent News & Media in
DainikJagran, a leading Hindi Daily. In thebroadcasting space, most channels beaming into India
such as Walt Disney, ESPN-Star Sports, Star, Discovery, BBC etc. have established
foreigninvestment subsidiary companies for content development and advertisementairtime
5
sales. In the television distribution space arena, foreign investment isbeing drawn by the larger
cable operators referred to as ‘multi-system operatorssuch as Hathway and Hindujas. In the
television content space, therecent investment in Nimbus Communications by a foreign private
equityplayer is seen as the start of a significant trend of foreign investment inflows.Current status
of the industry with Indian economy continues to perform strongly and one of the key sectors
that benefits from this fast economic growth is the E&M industry. This is because the E&M
industry is a cyclical industry that grows faster when the economy is expanding. It also grows
faster than the nominal GDP during all phases of economic activity due to its income elasticity
when incomes rise, wherein more resources get spent on leisure and entertainment and less on
necessities. Further, consumption spending itself is increasing due to rising disposable incomes
on account of sustained growth in income levels, and this also builds the case for a strong bullish
growth in the sector. The size of E&M in India is currently estimated at INR 353 billion and is
expected to grow at a compounded annual growth rate of 19 percent over the next five years. The
television industry continues to dominate the E&M industry by garnering a share of over 42
percent, which is expected to increase by a further 9 percent to reach about 51 percent. The share
of the film industry, which currently stands at 19 percent, is not expected to change materially
over the next five years. Print media, which stands at over 31 percent, is projected to lose some
of its share in favor of the emerging segments. The Indian entertainment and media industry
today has everything going for it - be it regulations that allow foreign investment, the impetus
from the economy, the digital lifestyle and spending habits of the consumers and the
Opportunities thrown open by the advancements in technology. All it has to do is to cash in on
the growth potential and the opportunities. The government, on its part, needs to play a more
active role in sorting out policy-related impediments to growth. The industry needs to fight all
roadblocks- such as piracy- in a concerted manner, while churning out high-quality, world class
end products. The entertainment and media industry has all that it takes to be a star performer of
the Indian economy.
6
2. COMPANY PROFILE
2. A. BACKGROUND AND INCEPTION OF THE COMPANY
Big cinemas, a Reliance Group of Company are one of the largest entertainment conglomerates
in India. What started as a laboratory for processing ad films over three decades ago, has today
become a key player in the entertainment and media industry. Big cinemas are by far the largest
entertainment corporation in the country. Thought leaders in every sense of the word, they have
been the defining force in every sphere of the entertainment industry - production, distribution,
processing or in cinemas - for over three decades now, be it pioneering the concept of
multiplexes, giving a corporate face to movie making, or introducing the IMAX experience, it
has always been Big cinemas first - in short, it was never a dull moment for the industry.Big
cinemas have a dominant and comprehensive presence in film services:motion picture processing
and di, film restoration, digital mastering, studios and equipment rentals Big cinemas films. June
2005, marked the milestone in Big cinemas when Reliance stepped into the company and
became majority promoter shareholders. With this move Big cinemas was catapulted to being
part of one of the leading business groups in India with a combined market capitalization
exceeding One Lakh crores. This management expertise and resources acted as a catalyst in
synergizing various interrelated businesses: animation, distribution, radio and digital cinema to
name a few. Today Big cinemas are the entertainment hub for top notch talent and cutting edge
technology. Big cinemas offerthe opportunity to be part of India’s fastest and largest growing
entertainment conglomerate. In other words, a chance to work with the best in the industry, as
part of world-class teams, that tackle new challenges every day; in a company that is as
committed to its employee’s growth as it is about its own success. Big cinemasfilms limited, a
member of the Reliance Anil DhirubhaiAmbani group, is India’s fastest growing film and
entertainment services company. Big cinemas have a dominant and comprehensive presence in
film services, motion picture processing, film restoration, digital mastering, studios and
equipment rentals. The Big cinemas films also operate India’s largest cinema chain with about
500screens spread across India, US and Malaysia. It has a significant presence in the film
distribution space with a nationwide presence across India as well as offices in London, New
York, Los angels and Malaysia.Big cinemas are committed to providing audiences across India
7
over all economic strata, access to Big cinemas world-class cinemas. This is being achieved
through a strategy of not only setting up standalone properties and cinemas in malls, but also
taking over current properties, renovating and operating them, taking advantage of
theirconsiderable existing infrastructure and Brand value. The company has also launched
India’s first 6D theatre launched at Agra and was among the first to show 3D versions of
international movies.Big cinemas' television venture, synergy Big cinemas, is among thetop
players in the television programming industry. Reliance Media WorksOver the years, Big
cinemas has created iconic destinations such as BIG-Cinema Park in Agra, a kilometer away
from the TajMahal, which has pioneered the multi-sensory cinema experience in India through a
six dimensional show. Big cinemas has also partnered with IMAX Corporation to install IMAX’s
new world class digital projection system in Big cinemas flagship IMAX theatre in Mumbai.
This new technology has marked the first digital IMAX location in India and enabled Big
cinemas to take advantage of the growing slate of Hollywood releases in IMAX and IMAX 3D.
Big cinemas are thereby the only cinema in India which screens films in both 3D and 6D
formats.
Bharat Big cinemas Mangalore is a franchise of Reliance Big cinemas taken up by Bharat groups
Mangalore.
2. B. NATURE OF BUSINESS CARRIED
The business carried on is Multiplex. Pioneering the concept of multiplexes, giving a corporate
face to movie making, or introducing the IMAX experience, it has always been Big cinemas first
in short, it was never a dull moment for the industry. The Company's principal activities are to
provide feature films, television, entertainment and other related services in India. The Company
operates in two segments. Commissioned programs include the sale of television serials to
channels and Sponsored programs which include the telecasting of television serials on channels.
The Big cinemas has not only changed the concept of theaters but also has improved the movie
viewing experience for the customers with its latest technological innovation which has made it
more fun and safer for the customers.
8
2. C. VISION, MISSION AND QUALITY POLICY
Vision
The vision of Reliance Big cinemas Entertainment is meeting young India's aspirations and
assuming a leadership position in communications, media and entertainment.
Mission
 The Mission of Reliance Big cinemas is to offer a world class viewing experience to the
consumer through a chain of Multiplexes.
 To create value for all stake holders.
 Grow through innovation.
 It is geared to create a significant presence in businesses across various vectors of content,
internet, broadcast and retail services and platforms for distribution.
 The company strives to create converged services and platforms for masses to access
innovative, cutting-edge content which include production and strategic collaboration in
areas such as gaming, movies, animation, music, broadcast, DTH and user-generated content,
amongst others.
 A delightful Movie Experience.
 A delightful Work place.
 A delightful Community.
Quality policy
 Reliance Big cinemas are committed to meeting customer requirements through continual
improvement of quality management systems.
 Reliance Big cinemas shall sustain organizational excellence through visionary leadership
and innovative efforts.
 To provide the best viewing experience for its customers through chain of multiplexes.
 Providing best and the latest movies for its customers.
 To provide the latest technological advances to its customers for the best viewing experience.
9
2. D. SERVICE PROFILE
Today Big cinemas are the market leader, processing the largest number of Hindi films every
year with a record-breaking number of prints. Long-standing business relationships and a
technologically advanced facility including a high quality lab for processing raw exposed films,
color correction, editing and making multiple prints for final distribution, and a well appointed
preview theatres have made us the most sought-after film processing laboratory in India.
Currently, Big cinemas enjoys a 70% market share in the Hindi films in the film processing and
printing business. Along with films, they continue to focus on quality negative processing for the
advertising industry. In 2005, Big cinemas received the prestigious Kodak Image care Program
Negative Processing Accreditation. With it, Big cinemas joined an elite club of processing labs
in the world recognized for the highest quality and standards in motion picture film handling and
processing, and most efficient practices. They have further consolidated their dominant position
with numerous other prestigious awards for the quality of film processing.
2E. AREA OF OPERATION
Big cinemas are India’s largest cinema chain with about 500 screens spread across India. It also
operates in U.S, Mauritius, London and Malaysia. The company is also working towards
establishing presence in Netherlands and has associated with PATHE Theatres to begin
screening Indian movies. It has a significant presence in the film distribution space with
a nationwide presence across India as well as offices in London, New York, Los Angeles and
Malaysia. Having been the first cinema chain to cross100 screens and now approaching 600
screens in India, Big cinemas are by far the largest cinema chain in India.
Big cinemas' is now considered as world-class cinemas and this is being achieved through a
strategy of not only setting up stand-alone properties and cinemas in malls, but also taking
over current properties, renovating and operating them, taking advantage of their considerable
existing infrastructure and brand value. All in all, plans are underway for a large chain of
cinemas in the top 10 cities including Delhi, Kolkata, Hyderabad and Bangalore. It is also
looking at ramping up operations in small cities and towns & also northern India and the second
phase will include expansion to developing cities and in the year to come, 35 million people are
10
expected to watch a movie on an Big cinemas screen. Bharat Big cinemas situated in Mangalore
provides an excellent multiplex experience for the people in and around Mangalore(D.K), Udupi,
Madikeri, and Utharakannada District of Karnataka. Its coverage area extends throughout the
costal belt of Karnataka.
2. F. OWNERSHIP PATTERN
The corporate structure: The Company board of Directors, important executives and other
people instrumental to the success of the company.
Mr. Anil Ambani, Chairman, Reliance Anil DhirubhaiAmbani Enterprises.
Mr. ManmohanShetty, Managing Director, Big cinemas Films Ltd, India.
Mr. BalakrishnaShetty, Manager, Big cinemas Films Ltd, Mangalore.
Table 2.f Showing ownership pattern of Big cinemas.
Ownership % of shares
Bharath groups pvt ltd 51%
Mr. Anil Ambani, Chairman,
Reliance Anil DhirubhaiAmbani Enterprises.
49%
2. G. COMPETITORS INFORMATION
INOX: INOX Leisure Limited is the diversification venture of the INOX Group into
entertainment and is a subsidiary of Gujarat Flurochemicals Ltd. INOX Leisure's mission is to be
the leader in the cinema exhibition industry, in every aspect right from the quality and choice of
cinema to the varied services offered and eventually the highest market share. With a view to
consolidate its position in the multiplex industry, the Company had acquired 17,565,288 equity
shares of Fame Cinemas in February 2010. The Company acquired further 1,075 equity shares
11
of Fame Cinemas in the Open Offer. Subsequent to the completion of the open offer formalities
on 6 January 2011, the Company holds 17,566,363 equity shares of Fame representing 50.27%
of the issued and paid-up capital of Fame Cinemas. Consequently, Fame Cinemas and its
subsidiaries viz. Fame Motion Pictures Limited and Big Pictures Hospitality Services Private
Limited have become subsidiaries of the Company with effect from 6 January 2011.INOX has
traversed its own path by bringing in a professional and service oriented approach to the cinema
exhibition sector. With strong financial backing, impeccable track record and strong corporate
ethos, INOX has established a strong presence in the cinema exhibition industry in the short span
of a little over eight years since the opening of its first multiplex. INOX currently operates 45
multiplexes and 178 screens in 29 cities making it a truly pan-Indian multiplex chain. Winner of
the 'ICICI Entertainment Retailer of the Year' Award 2005, TAAL Multiplexer 2006 and
Emerging Super brand of the year 2006 - 2007 Award, INOX Leisure Ltd. will continue its
expansion into places like Jodhpur, Ahmedabad, Bhopal, Mangalore, Coimbatore, Kanpur,
Hubli, Bhuvaneshwar, etc. Its merger with CCPL 89 Cinemas has given INOX access to an
additional 9 multiplexes in West Bengal and Assam. INOX was also chosen post a nationwide
tender to design, construct and operate the prestigious multiplex in Goa that hosts the
International Film Festival of India. All INOX cinemas have state of the art facilities in terms of
modern projection and acoustic systems, interiors of international standards, stadium styled high
back seating with cup holder arm-rests, high levels of hygiene, varied theatre food, a selection of
Hindi, English and regional movies, computerized ticketing and most importantly high service
standards upheld by a young and vibrant team.
PVR CINEMAS: PVR Ltd. was incorporated in April 1995 pursuant to a joint venture
agreement between Priya Exhibitors Private Limited and Village Road show Limited, one of the
largest exhibition companies in the world. PVR pioneered the multiplex revolution in the country
by establishing the first multiplex cinema in 1997 at Saket, New Delhi. The opening of the first
multiplex heralded a new era in the Indian cinema viewing experience and which also changed
the industry forever. From then on PVR initiated many path breaking innovations in the industry
from launching in Bangalore the largest 11 screen multiplex in the country in 2004 to
introducing Gold Class Cinema. To ramp up presence across the retail entertainment landscape,
PVR entered into a JV with Major Cineplex Group in 2008, a leading Film exhibition and retail
entertainment company based out of Thailand, to bring lifestyle entertainment concepts to Indian
12
consumers. The Joint Venture enjoined setting up of bowling alleys, karaoke centers, ice skating
rinks and gaming zones across the country to enhance the out of home entertainment experience
for Indian consumers. Currently, geographically diverse cinema circuit in India consists of 46
Cinemas with 213 screens spread over 27 different cities covering major markets across the
length and breadth of the country: Delhi, Faridabad, Gurgaon, Ludhiana, Jalandhar, Ghaziabad,
Mumbai, Kolkata, Bangalore, Hyderabad, Chennai, Lucknow, Indore, Aurangabad, Baroda,
Allahabad, Ahmedabad, Udaipur, Chandigarh, Surat, Latur, Nanded, Ujjain, Nagpur, Pune,
Raipur and Bilaspur. In FY 2011 the PVR brand has been successful in entertaining more than
19 million esteemed patrons across its properties. Today PVR Cinemas contributes 20-25% of
domestic box office collections of any leading Hollywood movie and 12-13% of any leading
Bollywood movie, highest across the Indian Film Exhibition space. In the last decade and half,
PVR Ltd has established itself as India's leading and most premium entertainment company, with
presence in the entire value chain with leadership position in Film Exhibition, Distribution and
Production. It has also successfully forayed into retail entertainment formats such as bowling
Centers with BluO- India's largest 24 lane bowling center which was set up in Gurgaon in 2008.
The company also operates a film distribution and production business through PVR Pictures, a
100% subsidiary of PVR Ltd. The company has definite plans to grow multifold over the next 3-
5 years with plans to set up 300 screens and expand to 40 cities from 20 cities at present. The
company will continue to provide cinema viewing experience equipped with superior quality
ambience, technologically updated systems and best service standards to ensure customer delight
and unmatched cinema viewing experience. The company also aims to set up more bowling
centers, ice skating rinks and expand its presence in key cities and become a dominant player in
the Retail entertainment space at pan India level.
CINEMAX: They believe in them that much that they decided to take the movie experience to
an entirely new level. Watching the movie they say is only the beginning of the magical
experience. They not only flash the best movies ever made on their screens but they ensure that
movie buffs view them in style in recliners, massage chairs and customer service fit for a king.
They love cinema and so does India. Hence, their launch plans are ambitious and nationwide.
They are one of the largest Exhibition theatre chains in India with 39 properties, 138 screens and
33,522 seats. They believe they are one of the dominant players in Mumbai operating with 14
locations which is home to the Hindi Film industry they believe that their brand 'Cinemax' is one
13
of the most recognizable film exhibition brands in the areas where they operate. They have
theaters in Ahmedabad, Panipat, Nagpur, Hyderabad, Kolkata, Kanpur, Raipur, Gandhinagar,
Mumbai, Thane, Vashi, Cochin, Baroda, Rajkot, Siliguri, Nashik, Delhi, Bangalore, Pune, Surat
and coming soon in Chennai and launching additional properties in Pune and Bangalore. They
believe in providing customer satisfaction through process enhancements and constant
innovation in their services and facilities such as high comfort recliner seating arrangements in
'The Red Lounge', massage chairs, etc. They have conducted many premieres. They can ensure
that almost one citizen from any home across the city has visited their premises at some point in
time making it the place with the highest footfall, all of them eager to experience their adored
idols on the big screen.
GOPALAN CINEMAS: Gopalan Enterprises was founded in 1984 by Mr. C.Gopalan, an
architect, with the objective of developing and constructing residential apartments in Bangalore.
The company has developed some of the finest homes in Bangalore and has the enviable record
of having completed all its projects on time. The Group is engaged in the promotion of
Residential, Commercial, Shopping Malls, Townships, Special Economic Zones, Software
Technology Parks, Biotech Parks, Organic Farms, Educational Institutions, Export of Culinary,
Medical Herbs, Star Hotels, and Hospitals etc.They offer 25 years experience building for an
astute clientele from around the world. They take pride in the superior craftsmanship and
attention to detail given to every project they construct. Their reputation nests on professional
management, exceptional product quality, overall affordability and client service through out the
building process. Their commitment, integrity, teamwork and professional excellence has
continually seen the growth and success of the business since its beginnings in 1984.Gopalan
Enterprises bears the stamp of innovative design, superlative quality construction. The Group's
commitment to quality construction, modernity in Architectural value; Space Management,
Customer satisfaction motto has set up new trend in the building industry. Group has emerged as
one of the competitors for promotion of Special Economic Zone generating exports &
employment. The group has a giant presence in the Knowledge City with a prestigious global
clientele. Gopalan Enterprises brings to a combination of strong professional experience and a
commitment to fresh, creative approaches for project planning and design.Their talents have
been applied to projects throughout Bangalore City. Gopalan is committed to providing the
highest standard of professional service. They are dedicated to the philosophy - Inspired by Life,
14
Built on Trust.Their goal is to assist by planning and designing a facility that meet unique needs.
They are supported by talented architects, interior designers, construction administration
specialists, technical, marketing, customer support and administrative personnel.
CINEPOLIS: When it comes to Cinepolis it is both National as well as Local competitor.
Cinepolis is the biggest Cineplex chain in Mexico with 205 theaters in 65 cities and they have
become the largest chain in Latin America and the fourth largest in the world with over 230
theaters, 3,000 screens and over 13,000 employees throughout Mexico, Guatemala, El
Salvador, Costa Rica, Panama, Colombia, Brazil, Peru, India and the United States.In Mangalore
it is located at City Centre mall at Store no: 4, Fourth Floor which has 5 screen including VIP
screen digital multiplex, which has a seating capacity of 1200, together with Real D, the world’s
best 3D technology, Hollywood standard 2k digital screens and 7.1 Dolby digital audio. After
Bangalore, this is the second Cinepolis multiplex in Karnataka.
CENTRAL:Central talkies is located at Hampankatta Mangalore. This is one of the oldest local
non A/CTheater which has more than 500 seats of 3 categories with Balcony, First Class, and
Second Class. The Theater draws more of local audience with the shows of Hindi, Kannada,
Tamil, Telugu and Malayalam movies.
JYOTHI: Jyothi talkies is located at the center of city near jyothi circle, Balmata Mangalore, it
is a single screen theater with more than 350 seats of 3 categories with Balcony, First Class, and
Second Class. The movies played are of Hindi, Kannada, Tamil, Telugu, Tulu and Malayalam
movies.
PRABHATH: PrabhathTheater is located at K.S Raoroad ,Kodialbail Mangalore. It is a single
screen theater with more than 300 seats of 3 categories with Balcony, First Class, and Second
Class.Various languages movies are played which includes Hindi, Kannada, Tamil, Tulu, Telugu
and Malayalam movies.
NEW CHITRA: New Chitra Theater is situated at BasavangudiStreet Mangalore. It is a single
screen theater with more than 400 seats of 3 categories with Balcony, First Class, and Second
Class.The theater draws more of local audience with the shows of English, Hindi, Kannada,
Tamil, Telugu and Malayalam movies.
15
ROOPAVANI: Roopavani Theater is situated in Bhavanthistreet Mangalore. It is a single screen
theater with more than 350 seats of 3 categories with Balcony, First Class, and Second Class.The
Theater draws audience with the shows of Kannada, Tamil, Tulu and Malayalam movies.
SUCHITHRA: Suchitra Theater is located at K.S Raoroad ,Kodialbail Mangalore. It is a single
screen theater with more than 300 seats of 3 categories with Balcony, First Class, and Second
Class.Various languages movies are played which includes Hindi, Kannada, Tamil, Tulu, Telugu
and Malayalam movies.
PLATINUM: Platinum Theater is located in Falnir Road Mangalore. It is a single screen theater
with more than 450 seats of 3 categories with Balcony, First Class, and Second Class.The theater
draws more of local audience with the shows of English, Hindi, Kannada, Tamil, Telugu and
Malayalam movies.
RAMAKANTHI: Ramakanthi Theater is situated in Bhavanthistreet Mangalore. It is a single
screen theater with more than 300 seats of 3 categories with Balcony, First Class, and Second
Class.Various languages movies are played which includes Hindi, Kannada, Tamil, Tulu, Telugu
and Malayalam movies.
2. H. INFRASTRUCTURAL FACILITIES
Big cinemas, a division of Reliance Media Works Ltd formerly known as Adlabs Films Limited
and a member of Reliance ADA Group is has a theatre chain with over 500 screens
in India, US, Malaysia, and the Netherlands. The company accounts for 10 to 15% of box office
contributions of large movies. After pioneering the IMAX experience in India, it recently
launched 3D and 6D technology and is the only cinema chain to screen films in all three formats.
Big cinemas also operates in the United States, and the circuit accounts for about 30-35% of
Hindi features box office collections and over 70% of Tamil and Telugu box office collections
from the US. In Malaysia, the company now has 66 screens that play Hollywood features as well
as Chinese and Tamil films to cater to the 1.5 million Tamil populationsThe cinema viewing
experience for Mangaloreans underwent a dramatic change in 2006 - when the first three-screen
multiplex started operating in the first mall of the city. Adlabs now Big cinemas multiplex started
with three screens and added one more screen a year later. Since then there has not been much of
a change in the multiplex scene in the city.
16
2. I. ACHIEVEMENTS /AWARDS
Big cinemas have won many awards over the years which include:
 ‘Entertainment Retailer of the Year’ honor at the India Retail Forum 2009.
 ‘International Exhibitor of the Year 2008’ by CineAsia 2008 at Macau.
 Big cinemas’ innovative concept of Cinediner which combines fine dining and movie watching
has won the award for Most Admired Innovative Concept of the Year at Images Retail Forum
2010.
 Big cinemas have also been awarded the “Multiplex of the Year” at the Franchise India’s Star
Retailer Awards, 2012 at New Delhi.
 Big cinemas have been awarded the “Retailer of the Year” honor at the Reid & Taylor Awards
for Retail Excellence for 2 consecutive years.
 South Indian Cinematographers Association Award for “Best Color Laboratory” in Chennai for
the year 2007.
 Zee Cine Award for Best Film Processing in 2008.
 Big cinemas has bagged the trade recognition of being the “Best Cinema Chain for the Year”
honor at ZEE ETC Bollywood Business Award 2012 held at Mumbai.
17
2. J. WORK FLOW MODEL



Figure 2.J: Work Flow Model
A workflow consists of a sequence of concatenated or connected steps. Emphasis is on the flow
paradigm, where each step follows the precedent without delay or gap and ends just before the
subsequent step may begin. This concept is related to non overlapping tasks of single resources.
Company
Subsidiary
Branch Branch Franchise Franchise Franchise
Satellite
Distribution
Marketing Operation Booking
Screen 1
Screen 2
Screen 3
Screen4
News paper
Internet
Mall Display
Board
Back office
operation
Front office
operation
Ticket counter
Tele booking
Internet
booking
Customer
18
It is a depiction of a sequence of operations, declared as work of a person, a group of persons.
Workflow may be seen as any abstraction of real work. For control purposes, workflow may be
a view on real work under a chosen aspect, thus serving as a virtual representation of actual
work. The flow being described may refer to a document or product that is being transferred
from one step to another. an organization of staff, or one or more simple or complex
mechanisms.
The work flow model starts with the company i.e. Reliance Big cinemas from which the various
companies obtains the franchises or even the branches is opened by Big cinemas itself. The
franchises will be operating in four areas such as satellite Distribution through which the movies
Reaches the theaters and are shown on the various screens, here in case of Bharat Big cinemas
there a 4 screens available through which it is reached to the final customers. The other
department is marketing which makes customer aware about the movies and offers through
various marketing channels such as Newspaper, Internet, and Mall display board. The operation
department is classified as Front office and Back office which enables all the operations done at
Big cinemas. It also has a booking department which operates for booking of tickets through
various mediums such as Tele booking, online booking and also through ticket counters. The
final link in the work flow model is the customer of Big cinemas.
2. K. FUTURE GROWTH AND PROSPECTS
Bharat Big cinemas have humongous scope for growth in costal region of Karnataka. The
competition is intense with many global competitors entering into the market along with
established local theaters which are operating at the same level. But Mangalore region
developing as educational hub of Karnataka will bring more youths towards Mangalore which is
a positive sign for Big cinemas. It can also target the surrounding regions of Mangalore as there
is open market without any major companies established Big cinemas can target the surrounding
developing regions like Udupi, Moodbidri, Kundapur, Puttur etc. The prospect of the growth for
Bharat Big cinemas in Mangalore appears to be positive.
19
3. MCKINSEY 7S FRAMEWORK
The McKinsey 7s framework is a management model developed by well known business
consultants Robert H. Waterman, Jr. and Tom peters in the 1980s. This was a strategic vision for
groups, to include businesses, business units, and teams. The 7s are structure, strategy, systems,
skills, style, staff and shared values.McKinsey's frame work provides a useful tool for analyzing
the strategic attributes of an organization. These seven are distinguished in so called hard S’s and
Soft S’s. The hard elements: Strategy, Structure and System are feasible and easy to identify. The
four soft S’s Skills, Staff, Style and shared values however are hardly feasible. Companies in
which these soft elements are present more successful at implementation of strategy.
Figure 3.a: McKinsey 7s framework
20
The 7-S framework of McKinsey is aValue Based Management model that describes how one can
holistically and effectively organize a company. Together these factors determine the way in which
a corporation operates. Managers need to take account of all seven of the factors to be sure of
successful implementation of a strategy - large or small. They're all interdependent, so if the
manager fail to pay proper attention to one of them, it can bring the otherscrashing down.
Objective of the model is to analyze how well an organization is positioned to achieve its intended
objective.
MCKINSEY 7S FRAMEWORK WITH SPECIAL REFERENCE TO BHARATH BIG
CINEMAS:
3.1. STRUCTURE: Basis for specialization and co-ordination influenced primarily by strategy
and by organization size and diversity.
Big cinemas, a division of Reliance Media Works Ltd has a theatre chain with over 500 screens
in India, US, Malaysia, and the Netherlands. The company accounts for 10 to 15% of box office
contributions of large movies.After pioneering the IMAX experience in India, it recently
launched 3D and 6D technology and is the only cinema chain to screen films in all three formats.
Bharat Big cinemas werethe first three-screen multiplex started operating in the first mall of the
city. Big cinemas multiplex started with three screens and added one more screen a year later. It
works with 6 efficient departments comprising of HR department, Marketing Department,
Finance Department, PR department, Booking department and finally the maintenance
department. The flow of instructions is sent from the top management and is passed to all the
other departments. The Marketing and advertisements works are managed by Marketing
department, the Recruiting and training of employees are achieved by HR department. There is
also the Public Relation Department to handle customer objections and queries.
21
v
Figure 3.b: Organization structure
Board of directors
Human Resource
department Mangalore
Marketing department
Mangalore Division
Finance department
Mangalore Division
Booking department
Mangalore Division
Maintenance and house
keeping department
Customer Query /public
Relationship department
Human Resource
department
Marketing department
Finance department
Booking department
Customer Query /public
Relationship department
Maintenance and house
keeping department
Human Resource
department
Marketing department
Finance department
Booking department
Customer Query /public
Relationship department
Maintenance and house
keeping department
22
3.2. STRATEGY: Actions a company plans in response to or anticipation of changes in its
external environment.
 The main strategy which has helped Big cinemas to grow and lead the market is by always
keeping the customer’s needs in mind and constantly innovate in the multiplex sector.
 To provide the quality service through excellent world class venue for the customers to visit
and watch the movies.
 Providing fully Air conditioned theaters with cushioned push back seats which has changed
the view of whole concept of theaters in and around the globe.
 One of the top prioritize strategy of Big cinemas is to attract more youths towards watching
movies, Through various offers and combos Big cinemas is attracting the youngsters towards
the theaters .
 Execute flawlessly and efficient delivery of services every time every day through which the
Big cinemas has raised its standards.
 Sustain and strengthen the group’s spirit of entrepreneurship taking ownership and
accountability for their actions.
 Leverage synergies to learn and build on the diverse experiences and skill sets of various
businesses and teams.
 To create a true meritocracy with a pervasive commitment to transparent systems and
processes.
 Do all this with unquestionable Integrity to ensure total compliance with the laws of the land.
 To engage itself in social activity to ensure it is involved in the welfare of the common
people.
 To attract more families by providing safer and healthier venues with world class standards.
 To shift the peak demand from weekends by introducing offers like Wednesday movies with
less/ Fixed ticket prices.
 To ease the process of booking tickets through various booking options which consists of
Online booking, Ticket counter and Tele Booking.
 To provide best viewing experience through Imax and 3D visual presentations which
includes better sound clarity and bigger screens.
23
3.3. SYSTEM: Formal and Informal procedures that support the strategy and structure. Systems
are more powerful than they are given credit which is performed through:
 Growth opportunities to expand leadership capabilities.
 True meritocracy and freedom to choose career paths.
 Opportunities to develop and enhance leadership and functional capabilities.
 An entrepreneurial environment where people can pursue their dreams.
 Competitive compensation.
 First mover advantage over competitors.
 Through a well-defined Rewards & Recognitions program that periodically identifies
exceptional individual and team achievers among the various business functions and verticals
in the Group which also includes the convention of awarding the Best Employee of the year
for the best performance of that year.
3.4. STAFF: The people/human resource management- processes used to develop managers,
socialization processes, and ways of shaping basic values of management cadre, ways of
introducing young recruits to the company, ways of helping to manage the career of
employees.There strong team of professionals is among the youngest in the country, and consists
of some of the most dynamic, motivated and qualified individuals to be found anywhere in the
world. First rate management graduates, highly trained engineers, top-notch financial analysts
and razor sharp accountants they have on their rolls some of the brightest minds in the business.
Currently there are
 There are 40 employees working in various department such as Marketing, Finance, Human
resource etc
 The staffs are well Qualified and trained in their respective departments.
 Consists motivated employees work towards the customer satisfaction for each turn up’s.
24
 Separate employees are allocated for various modes of booking to enhance better transaction
of tickets.
 Separate trainings are provided for front office and back office staffs.
 The company organizes periodic development programs to develop and improve the skill of
the staffs.
 The staffs are well dressed and are provided with Black pants and Black shirts with Red
stripes on the shoulder, they are also provided with the Black caps carrying the logo of Big
cinemas.
 The staffs appointed are both full time as well as part time for the better flexibility within the
organization.
3.5. SKILL: The Distinctive competences-what the company does best, ways of expanding or
shifting competences. Skill refers to the organizational dominant capabilities and competencies.
Skill are those which are developed over a period of time and are result of interaction of many
like the kind of people, type of management style, organization structure and the nature of the
work they do. The company is possessing self-sufficiency in technical skills with various
competitive advantages such as:
o Committed to excellence in quality of service.
o Highly trained employees specially trained in the field of customer handling and human
resource skills.
o Responsive to evolving business needs and challenges in the organization.
o Dedicated to uphold the core values of the Group.
o To continuously scan the environment review of training programs and design need based to
ensure achievement to high level of excellence in consumer satisfaction.
o It is this skill and initiative of their workforce that sets them apart from their peers in today’s
knowledge-driven economy.
25
3.6. STYLE: More a matter of what managers do than what they say: How do a company’s
managers spend their time, what are they focusing attention on, Symbolism- the creation and
maintenance or sometimes deconstruction of meaning is a fundamental responsibility of
managers.
 They always put their employees first. Pride lies in building a company around the idea that
work should be challenging and challenge should be fun. The idea being, organizing world's
information and make it both useful and universally acceptable by one and all.
 Accomplishment of this feat will be done only with people having great aspirations.
Reliance Big Entertainment offers the most inspiring work environments on the planet to
work with smart people and amazing technology.
 A platform to connect with millions of people. They invite the people to join and become a
part of their organization – one whose forte is its ethics and values which are in turn reflected
in its actions and people practices.
3.7. SHARED VALUES: Guiding concepts, fundamental ideas around which a business is
built- must be simple, usually stated at abstract level, have great meaning inside the organization
even though outsiders may not see or understand them.
 Social Responsibility: Big cinemas believes that organizations, like individuals, depend on
the support of the community for their survival and sustenance, and must repay this
generosity in the best way they can.
 People Care:Big cinemas possess no greater asset than the quality of human capital and no
greater priority than the retention, growth and well-being of their vast pool of human talent.
 Shareholder Interest: Big cinemas value the trust of shareholders, and keep their interests
paramount in every business decision they make, every choice they exercise
 Consumer Focus: It is one of the great values of Big cinemas. They rethink every business
process, product and service from the standpoint of the consumer – so as to exceed
expectations at every touch point
26
 Excellence in Execution:Big cinemas believe in excellence of execution – in large, complex
projects as much as small everyday tasks. If something is worth doing, it is worth doing well.
 Respect for Competition: Big cinemasrespect competition – because there’s more than one
way of doing things right. They can learn as much from the success of others as from their
own failures.
 Proactive Innovation: Big cinemas nurture innovation by breaking silos, encouraging cross-
fertilization of ideas & flexibility of roles and functions. They create an environment of
accountability, ownership and problem-solving based on participative work ethic and
leading-edge research.
 Leadership by Empowerment: Big cinemas believe leadership in the new economy is about
consensus building, about giving up control; about enabling and empowering people down
the line to take decisions in their areas of operation and competence.
 Team Work: The whole is greater than the sum of its parts; in rapidly-changing knowledge
economy, organizations can prosper only by mobilizing diverse competencies, skill sets and
expertise; by imbibing the spirit of “thinking together” -- integration is the rule, escalation is
an exception.
27
4. SWOT ANALYSIS
STRENGTHS
 Big cinemas, a Reliance Group of Company are one of the largest entertainment
conglomerates in India.
 Big cinemas have a dominant and comprehensive presence in film services: motion picture
processing, film restoration, digital mastering, studios and equipment rentals.
 It was first of its kind to be set up in Mangalore.
 The biggest strong point for the company is the current location at Bharath Mall, Bejai,
Mangalore which is considered as the heart of the city.
 More families are driven by the standards of Big cinemas.
 It caters to the needs of the residents of Mangalore by providing High end visual picture
which also includes 3D movies which other local theaters lack.
 The company has a strong experience in building and construction. Also, there is a brand of
'Reliance' to be considered.
 The company has a premium theatre too. The utilization of this could probably indicate the
pricing power for the company.
 The main strength of Big cinemas include the Brand name, ambience and service, strong
data base, good inter personal relation with customer, trained & qualified staffs.
WEAKNESSES
 High dependence on distributor for showing films in every theatre and for every film. This
gives a very unstable business model when one compares with Big cinemas which are in the
other end of the value chain.
 Inadequate promotional strategies when compared to its competitors.
 Concentration is mainly deliberated towards upper and upper middle income groups.
 Existing competition is with Inox, PVR cinemas and Cinepolis. Big cinemas are expected to
be the largest player with a strong backward integration. Given this level of competition,
efficiency or utilization rate is one of the key parameters for success. There is no strong
28
pricing power with any of these competitors. Given, that they can't reduce the price to a 'non
multiplex' rate, the downside pricing to increase volumes is lost too. Also, the competitors
are expanding very aggressively. Incase, they are represented in most areas, especially in
prime areas, that Big cinemas is operating, this can lead to loss of business.
.
OPPORTUNITIES
 Mangalore being a educational hub with majority of the viewers are youth, the demand for
quality viewing experience will be high and will increase in the near future.
 There is a big demand for theatres across the country given the poor quality currently in
existence across places. Also, most theatres are willing to open in Sec B and C cities and
move into small towns too.
 They are willing to work on different model for pricing tickets depending on time/day.
 Increase in the income level of the people and high discretionary income spent on luxury.
THREATS
 Success of theatres is movie specific and this can tilt towards failure with poor movie
scripts.
 Alternate sources of entertainment such as DTH, DVD can lead to lower sales.
 Alternate mediums like DTH, DVD or VCDs can become popular making the Business
unattractive.
 Arrival of global competitors like Cinepolis in Mangalore will affect the existing business.
 Various internet sites providing free unauthorized prints of latest movies.
29
5. ANALYSIS OF FINANCIAL STATEMENT
A financial statement or financial report is a formal record of the financial activities of a
business, person, or other entity. The financial statement provides a summarized view of the
financial position and operations of a firm. The analysis of the financial statement is a process of
evaluating the relationship between components parts of financial statement in order to obtain a
better understanding of the firm’s position and performance.
1. Current Ratio: This ratio is calculated to study the liquidity of a firm. Current ratio is
calculated by dividing current assets by current liabilities
Current assets
.Current Ratio=
Current liability
Table 5.1: Current Ratio
Year Current Assets (Rs in crores) Current Liabilities(Rs in
crores)
Current Ratio
2008 184.96 208.81 0.89
2009 293.61 152.94 1.92
2010 274.36 238.42 1.15
2011 364.92 260.17 1.40
2012 312.90 598.66 0.52
It indicates that the liquidity position of the company during the financial year
2. Debt-Equity Ratio: These ratios express the relationship between debt and equity. It also
indicates what proportion of equity and debt. The company is using to finance its assets. It can be
calculated by using the following formula
30
Total Debt
.Debt Equity Ratio=
Shareholders Equity
Table 5.2: Debt-Equity Ratio
Year Debt (Rs in crores) Equity(Rs in crores) Debt Equity Ratio
2008 925.59 689.61 1.34
2009 1296.10 524.2 2.47
2010 1892.44 374.78 5.05
2011 1982.41 42.78 46.34
2012 1824.40 -565.63 -3.23
In debt equity ratio, if the ratio is greater than 1, the majority of the company’s assets are
financed through debt. If the ratio is less than 1, its assets are primarily financed through equity.
Debt-equity ratio of the firm during the financial year 2012 is negative because it includes
accumulated losses hence the net worth is also obtained negative.
3. Quick Ratio: Quick Ratio is an indicator of company’s short term liquidity. It measures the
ability to use its quick assets to pay its current liability. Quick ratio formula is:
Quick Assets
.Quick Ratio= or
Current Liability
Cash+ Marketable securities + Accounts Receivables
.Quick Ratio=
Current Liability
Where, Quick asset= Current asset – inventories
Table 5.3: Quick ratio
31
Year Quick asset (Rs in crores) Liability(Rs in crores) Quick Ratio
2008 177.35 208.81 0.85
2009 286.70 152.94 1.87
2010 265.29 238.42 1.11
2011 351.67 260.17 1.35
2012 298.72 598.66 0.58
4. Net Profit Ratio: Net profit margin is a key financial indicator used to asses the profitability
of a company. Net profit margin formula is:
Net Profit/PAT
.Net Profit Ratio=
Net Sales
Table 5.4: Net profit Ratio
Year PAT (Rs in crores) Net Sales (Rs in crores) Quick Ratio
2008 48.01 309.17 0.16
2009 -54.6 662.4 -0.08
2010 -148.52 719.71 -0.21
2011 -330.83 729.07 -0.45
2012 -903.15 1234.41 -0.73
5. Asset Turnover Ratio: Asset turnover ratio is the ratio of company’s sales to its assets. It is
an efficiency ratio which tells how successfully the company is using its assets to generate
revenue. The Asset Turnover Ratio formula is:
32
Sales Revenue
.Asset Turnover Ratio=
Total Assets
Table 5.5: Asset Turnover Ratio
Year PAT (Rs in crores) Net Sales (Rs in crores) Quick Ratio
2008 48.01 309.17 0.16
2009 -54.6 662.4 -0.08
2010 -148.52 719.71 -0.21
2011 -330.83 729.07 -0.45
2012 -903.15 1234.41 -0.73
33
6. LEARNING EXPERIENCE
“Purse your goals even in the face of difficulties, and convert adversities into opportunities.”-Mr.
DhirubhaiAmbani.
It is easier to study the books written by the authors, but very difficult to experience the reality in
those books. I had a wonderful experience of the corporate world during the tenure of the project
at Bharat Big cinemas, Mangalore. Mr. BalakrishnaShetty, the manager was approachable and he
was friendly and encouraging. The positive outlook of the store manager towards the project and
its encouragement helped me to boost up my confidence level and to develop a positive attitude
towards work life. I also learnt that participative leadership style motivates each and every
employee to the great height possible. Respecting each other and encouraging the colleagues at
work place contribute towards building a harmonious relationship. I also learnt how the service
personnel are trained to handle the customers. Customers are a set of very difficult people to
tackle with. Some will be having problem with the show timings and some with the seating
arrangements, some need corner seats and some are price sensitive. But my survey related
problem was very different. Some customers are approachable and some others were reserved
and grumpy, some were busy and some others wanted their privacy. This was making me
remember Consumer Behavior subject quite a lot. I also learnt that one cannot satisfy all the
customers, because what one likes other may dislike it. So I had to change myself behaving
different with different individuals. I also learnt that the marketer needs to have a firm approach
towards the customer and opinion of all matters in marketing of goods and services. The industry
experience has made me realize that it’s not the individual but the Team effort which pays off at
the end, helping each other and cooperating with each other can make the perfidious corporate
world into a fun filled and peaceful one. I also learnt that one needs to put in cent percent efforts
to get a promotion and it is not the salary alone which matters but the acceptance by others that I
am human is very important if one needs to take up a marketing job. These 70 days of practical
study has made me understand a lot of marketing aspects along with an exposure of corporate
world and I did understand the consumer behavior practically.
34
PART-B
35
1. A. GENERAL INTRODUCTION
Customer Satisfaction is a must in business. Satisfaction is a person’s feeling of pleasure or
disappointment resulting from comparing a product’s perceived performance in relation to his or
her expectation. Satisfaction is a function of perceived performance and expectation. If
performance falls short of expectation, the customer is dissatisfied. If the performance matches
the expectations, the customer is satisfied. If the performance exceeds expectations, the customer
is highly satisfied or delighted. Many companies are aiming for high satisfaction because
customers who are just satisfied still find it easy to switch when a better offer comes along. The
producer's attempts to find out people who will pay for his product and buy them for his own
satisfaction from the products while manufactures make decision of the scope for the products,
they satisfy consumer wants and needs. Advertisers try to understand basic forces that cost
human behavior with in the market. They get such knowledge from psychology and sociology
for their desires. This is called consumer behavior, which is used to construct models by which
marketing people plan strategies, later on, these are used in advertising campaign.
The customer is the theme of all business functions. The purpose of business is to create and
retain the customers. If the customers are not satisfied, there are so many other competitors who
are waiting for this opportunity. Therefore, the customer should be put at the center of all
business activities, cutting across function and hierarchical boundaries. The marketing concept
holds that the key to achieving organizational goals consists of being more effective than
competitors in integrating marketing activities towards determining satisfying the needs and
wants of target customers. Marketing activities should be carried out under a well-thought-out
philosophy of efficient, effective, and socially responsible marketing. There are five competing
concepts under which organization can choose to conduct their marketing activities. The
Production concept, Product concept, Selling/sales concept, marketing concept, and the Social
marketing concept.
Customer expectation is the perceived value customers seek from the purchase of a good or
service. In a competitive marketplace where businesses compete for customers, customer
expectations & satisfaction is seen as a key differentiator & increasingly has become a key
element of business strategy.
36
Statement of problem
A study on Marketing Strategy and Customer Comforts with reference to Bharat Big cinemas.
Objectives of the study
 To assess the need, requirements & expectations of the customers in order to assess their
level of customer satisfaction and also to analyze the marketing strategy used for customer
satisfaction.
 To measure & prioritize areas where improvement will most affect customer satisfaction.
 To measure the effectiveness of different marketing strategies used by the Big cinemas on the
customer.
 To understand the involvement of the employees in assisting the customers.
 To analyze the customer attitude towards various pricing strategies opted by Big cinemas.
 To know the attitude, enthusiasm regarding the service provided to customers. To study &
identify how the customers are benefitted.
 To understand the customer view about the ambience and food& beverages at Big cinemas.
 To understand the standard levels of Big cinemas over its Competitors and other local
Theaters.
Scope of the study
 The study will be related to customer comforts and marketing strategy adopted Big cinemas.
 The study will help in knowing the extent of customer satisfaction towards Big cinemas.
 The study will help to know the improvements that can be brought about in the organization.
 The study will help to analyze the effect of current marketing strategies used by the
organization.
 The study will aid in analyzing the customer attitude towards the various aspects like pricing,
booking tickets, social standards, ambience etc at Big cinemas.
37
Research Methodology
Research Methodology is a systematical way to solve the research problem. In this, we study
various steps that are generally adopted by a researcher in studying his research problem along
with the logic behind them. A preliminary exploratory study was administered through the
personal interview and mail survey with customers from the city of Mangalore to understand the
parameter that could taken up for the structured questionnaire. The research design used was
Descriptive in nature. This was done once the parameter was determined and the problem had
been narrowed down. The sampling frame consists of the customer of Bharat Big cinemas,
Mangalore. The sampling units consist of students, youths, working class and also the Family
which had visited Big cinemas. The sample size was 200 respondents but only 174 usable
respondents could be analyzed. The sampling method used is non-probability, convenience
sampling method.
Primary Data: The primary data was collected with the help of Questionnaire, personal
interview and through Mail survey with the respondent. The questionnaire was structured with
suitable scaling. The most of the questions were close ended and target customers were mostly
youth. To analyze statistical tools used are graph and diagrams and excel sheet to analyze the
primary data.
Secondary Data: The data was collected from the secondary sources like journals, web articles,
and reports.
Limitations of the Study
 In spite of the success of project work certain hindrances were encountered in the course of
the study.
 The data gathered is just the representative of the universe and the mean may vary when
compared to universe.
 The period of study was limited for only 10 weeks. The information provided by the
respondents may be biased. & Difficulty in covering all the areas and locations, also posed as
a constraint.
 The period of study is very short and the change in the Marketing strategy with new tactics
offers cannot be included in the study.
38
1. B. ANALYSIS AND INTERPRETATION
Table 3.1: Showing Frequency of visit Bharat Big cinemas for watching movie
Figure 3.1: Showing Frequency of visit Bharat Big cinemas for watching movie
Interpretation:
The above table and graph depict the frequency of customer visit to Big cinemas Mangalore. Out
of 174 respondents about 15% of the respondent visit every week and about 31% of the
respondent visit once in a month and 16% visit once in 3 month and 6% of the respondent visit
once in a year and 32% of the respondent visit according to their preference of movies.
Every week.
15%
Once in a month.
31%
Once in 3
months.
16%
Once in a year.
6%
According to
your preference
of movies.
32%
Particulars Respondents Percentage
Every week. 26 15
Once in a month. 53 31
Once in 3 months. 28 16
Once in a year. 11 6
According to your preference of movies. 56 32
Total 174 100
39
Table 3.2: Showing frequency of Booking tickets at Bharat Big cinemas
Particulars Frequency Percentage
Box office (ticket counter). 121 57
Tele booking 32 15
Internet booking 49 23
Others 11 5
Total 213 100
Figure 3.2:Showing frequency of booking tickets at Bharat Big cinemas
Interpretation:
The above table and graph portray the means through which the customers book their tickets at
Big cinemas Mangalore. Out of the entire respondent 57% book their tickets through Box office
and about 15% of respondent book their tickets through Tele booking and about 23% of
respondent book their tickets through internet booking and about 5% of respondent use other
means of booking the tickets.
Box office (ticket
counter).
57%
Tele booking
15%
Internet booking
23%
Others
5%
40
Table 3.3: Showing opinion about the Location/availability of Ticket counters
Figure 3.3: Showing opinion about the Location/availability of Ticket counters
Interpretation:
The above table and graph represent the view of customers about the location tickets counters at
Big cinemas Mangalore. Out of the entire 174 respondent 19 % of respondent rate Excellent and
about 33% of the respondent rate it as very good and about 38% of respondent rate as good and
about 9% rate it as average and about 1% rate it as poor.
Excellent
19%
Very good
33%
Good
38%
Average
9%
Poor
1%
Particulars Respondent Percentage
Excellent 32 19
Very good 58 33
Good 66 38
Average 16 9
Poor 2 1
Total 174 100
Table3.4: Showing Information provided by the staff of Bharat
price, timings & seating at the ticket counter
Particulars
Excellent
Very good
Good
Average
Poor
Total
Figure 3.4: Showing Information provided by the staff of Bharat
price, timings & seating at the ticket counter
Interpretation:
The above table and graph symbolize
the price, timings & seating at the ticket counter
rate Excellent and about 28% of the respondent rate it as very
rate as good and about 17% rate it as average and about 2% of the respondent rate it as poor.
Good
38%
Average
17%
41
Showing Information provided by the staff of Bharat Big cinemas
price, timings & seating at the ticket counter
Respondent Percentage
27 15
49 28
66 38
29 17
3 2
174 100
Showing Information provided by the staff of Bharat Big cinemas
price, timings & seating at the ticket counter
The above table and graph symbolize the Information provided by the staff of
the price, timings & seating at the ticket counter. Out of the 174 respondent 15 % of respondent
rate Excellent and about 28% of the respondent rate it as very good and about 38% of respondent
rate as good and about 17% rate it as average and about 2% of the respondent rate it as poor.
Excellent
15%
Very good
28%
Poor
2%
Big cinemas about the
the Information provided by the staff of Big cinemas about
. Out of the 174 respondent 15 % of respondent
good and about 38% of respondent
rate as good and about 17% rate it as average and about 2% of the respondent rate it as poor.
Very good
28%
42
Table 3.5: Showing the Prices of tickets at Bharat Big cinemas
Particulars Respondent Percentage
Economical 16 9
Affordable 63 36
Reasonable 63 36
Expensive 27 16
Very Expensive 5 3
Total 174 100
Figure 3.5: Showing the Prices of tickets at Bharat Big cinemas
Interpretation:
The above table and graph symbolize the customer attitude towards the price of tickets at Big
cinemas Mangalore. Out of the 174 respondent 9% of respondent rate it as Economical and about
36% of the respondent rate it as affordable and about 36% of respondent rate it as Reasonable
and about 16% rate it as Expensive and about 3% of the respondent rate it as very expensive.
9%
36%. 36%
16%
3%
Economical Affordable Reasonable Expensive Very Expensive
Percentage
Particulars
43
Table 3.6: Showing the Weekend / peak time pricing at Bharat Big cinemas.
Particulars Respondent Percentage
Economical 17 10
Affordable 42 24
Reasonable 36 21
Expensive 54 31
Very Expensive 25 14
Total 174 100
Figure 3.6: Showing the Weekend / peak time pricing at Bharat Big cinemas.
Interpretation:
The above table and graph represent the customer feel about the weekend/peak time pricing of
tickets at Big cinemas Mangalore. Out of the 174 respondent 10 % of respondent rate it as
Economical and about 24% of the respondent rate it as affordable and about 21% of respondent
rate it as Reasonable and about 31% rate it as Expensive and about 14% of the respondent rate it
as very expensive.
10%
24%
21%
31%
14%
Economical Affordable Reasonable Expensive Very Expensive
Particulars
Percentage
44
Table 3.7: Representing the online booking in Bharat Big cinemas
Particulars Respondents percentage
Not convenient 21 12
Time consuming 36 21
Moderate / Neutral 68 39
Easy 40 23
Very easy 9 5
Total 174 100
Figure 3.7: Showing the online booking in Bharat Big cinemas
Interpretation:
The above table and graph denotes the customer view about the online booking of tickets at Big
cinemas Mangalore. Out of the 174 respondent 12 % of respondent feel it as not convenient and
about 21% of the respondent feel it as time consuming and about 39% of respondent rate it as
moderate and about 23% rate it as easy and about 5% of the respondent rate it as very easy.
Not convenient
12%
Time
consuming
21%
Moderate /
Neutral
39%
Easy
23%
Very easy
5%
Table 3.8:Representing Tele booking as more convenient than the o
tickets at Bharat Big cinemas
Figure 3.8: Representing Tele booking as more convenient than the other ways of booking
tickets at Bharat Big cinemas
Interpretation:
The above table and graph depict
cinemas Mangalore. Out of 174 respondents about 55% of customers feel that tele booking is
more convenient than the other ways of booking tickets a
agree with it.
Yes
55%
Percentage
Particulars
Respondent
Percentage
45
Tele booking as more convenient than the other ways of booking
Big cinemas
Tele booking as more convenient than the other ways of booking
Big cinemas
The above table and graph depict the customer view about the tele booking of tickets at
Mangalore. Out of 174 respondents about 55% of customers feel that tele booking is
more convenient than the other ways of booking tickets and about 45% of respondent does not
No
55% 45%
Particulars
Yes No Total
95 79 174
55 45 100
ther ways of booking
Tele booking as more convenient than the other ways of booking
the customer view about the tele booking of tickets at Big
Mangalore. Out of 174 respondents about 55% of customers feel that tele booking is
nd about 45% of respondent does not
46
Table 3.9: Showing Advance booking has given you the following benefits
Particulars Frequency Percentage
Cost 41 8
Time 93 19
Ease/convenience 78 16
Guaranteed tickets 104 21
Sitting together with family/friends 93 19
Early birds 30 7
Can book any number of tickets 47 10
Total 486 100
Figure 3.9: Showing Advance booking has given you the following benefits
Interpretation:
The above table and graph denotes the benefits that the customers think he gains through
advance booking of tickets at Big cinemas Mangalore. . Out of the 174 respondent 8 % of
respondent feels cost as an advantage and about19% of the respondent feels Time as an
advantage and about 21% of respondent feels Ease/Convenience as an advantage and about 19%
feels the benefits as sitting together with family/friends and about 7% of the respondent feels
early birds or 1st
viewer opportunity as the advantage and about 10% of the respondent feels that
they can book any number of tickets through advance booking.
cost
9%
Time
19%
Ease/convenience
16%
Guaranteed
tickets
21%
Sitting together
with
family/friends
19%
Early birds
6%
Can book any
number of tickets
10%
Table 3.10: Showing Free parking Fee gives an added advantage for Bharat
Figure 3.10: Showing Free parking Fee gives an added advantage for Bharat
Interpretation:
The above table and graph depict
cinemas Mangalore. Out of 174 respondents about 68% of customers feel that free parking is an
advantage and about 32% of respondent does not agree with it.
Yes
68%
percentage
Particulars
Frequency
Percentage
47
Free parking Fee gives an added advantage for Bharat
The above table and graph depict the customer view about the Free parking facility at
Mangalore. Out of 174 respondents about 68% of customers feel that free parking is an
advantage and about 32% of respondent does not agree with it.
No
32%
Particulars
Particulars Yes No Total
Frequency 119 55 174
Percentage 68 32 100
Free parking Fee gives an added advantage for Bharat Big cinemas
the customer view about the Free parking facility at Big
Mangalore. Out of 174 respondents about 68% of customers feel that free parking is an
48
Table 3.11: Showing the ambience rating of Bharat Big cinemas
Particulars Frequency Percentage
1 2 3 4 5 6 7 8 9 10 1 2 3 4 5 6 7 8 9 10
Safety and
safety checks
9 6 3 9 18 14 28 33 40 14 5 3 2 5 10 8 16 19 23 8
A/C 4 20 3 3 8 10 30 34 46 16 2 11 1 1 5 6 17 20 26 9
Hygiene 4 6 6 3 16 12 29 38 50 10 2 3 3 2 9 7 17 22 29 6
Snacks 5 10 7 7 14 15 32 31 42 11 3 6 4 4 8 9 18 18 24 6
Beverages 3 12 7 8 21 17 31 23 42 10 2 7 4 5 12 10 18 13 24 6
Odor/Smell 4 6 5 5 15 20 19 35 50 15 2 3 3 3 9 11 11 20 29 9
Waiting
longue
15 43 11 13 16 15 25 27 4 6 9 25 6 7 9 9 14 16 2 3
Figure3.11: Showing the ambience rating of Bharat Big cinemas
5% 2% 2% 3% 2% 2%
9%3% 11%
3% 6% 7% 3%
25%
2%
2%
3%
4% 4%
3%
6%
5%
2%
2%
4%
5%
3%
7%
10% 5%
9%
8%
12%
9%
9%
8%
6%
7%
9%
10%
11%
9%
16%
17%
17%
18%
18%
11%
14%
19%
20%
22%
18% 13%
20%
16%
23%
26%
29% 24% 24%
29%
2%8% 9% 6% 6% 6% 9%
3%
Safety & safety
checks
A/C Hygiene Snacks Beverages Odor/ smell Waiting lounge
Rank 1 Rank 2 Rank 3 Rank 4 Rank 5 Rank 6 Rank 7 Rank 8 Rank 9 Rank 10
49
Interpretation:
The above table and graph denotes the customer view about the exterior safety measures at Big
cinemas Mangalore. Out of the 174 respondent 5 % of respondent ranked it as 1out of 10 which
means least safety and about 3% of the respondent ranked it as 2 out of 10 and about 2% of
respondent ranked it as 3 out of 10 and about 5% of the respondent ranked it as 4 out of 10 and
about 10% of the respondent ranked it as 5 out of 10 and about 8% of the respondent ranked it as
6 out of 10 and about 16% of the respondent ranked it as 7 out of 10 and about 19% of the
respondent ranked it as 8 out of 10 and about 23% of the respondent ranked it as 9 out of 10 and
about 8% of the respondent ranked it as 10 out of 10.
The above table and graph denotes the customer view about the Air cooling at Big cinemas
Mangalore. Out of the 174 respondent 2% of respondent ranked it as 1out of 10 which means
safety and about 11% of the respondent ranked it as 2 out of 10 and about 2% of respondent
ranked it as 3 out of 10 and about 2% of the respondent ranked it as 4 out of 10 and about 5% of
the respondent ranked it as 5 out of 10 and about 6% of the respondent ranked it as 6 out of 10
and about 17% of the respondent ranked it as 7 out of 10 and about 20% of the respondent
ranked it as 8 out of 10 and about 26% of the respondent ranked it as 9 out of 10 and about 9% of
the respondent ranked it as 10 out of 10.
The above table and graph denotes the customer view about the Hygiene at Big cinemas
Mangalore. Out of the 174 respondent 2% of respondent ranked it as 1out of 10 which means
least and about 3% of the respondent ranked it as 2 out of 10 and about 3% of respondent ranked
it as 3 out of 10 and about 2% of the respondent ranked it as 4 out of 10 and about 9% of the
respondent ranked it as 5 out of 10 and about 7% of the respondent ranked it as 6 out of 10 and
about 17% of the respondent ranked it as 7 out of 10 and about 22% of the respondent ranked it
as 8 out of 10 and about 29% of the respondent ranked it as 9 out of 10 and about 6% of the
respondent ranked it as 10 out of 10.
The above table and graph denotes the customer view about the Snacks at Big cinemas
Mangalore. Out of the 174 respondent 3% of respondent ranked it as 1out of 10 which means
least and about 16% of the respondent ranked it as 2 out of 10 and about 4% of respondent
ranked it as 3 out of 10 and about 4% of the respondent ranked it as 4 out of 10 and about 8% of
50
the respondent ranked it as 5 out of 10 and about 9% of the respondent ranked it as 6 out of 10
and about 18% of the respondent ranked it as 7 out of 10 and about 18% of the respondent
ranked it as 8 out of 10 and about 24% of the respondent ranked it as 9 out of 10 and about 6% of
the respondent ranked it as 10 out of 10.
The above table and graph denotes the customer view about the Beverages at Big cinemas
Mangalore. Out of the 174 respondent 2% of respondent ranked it as 1out of 10 which means
least and about 7% of the respondent ranked it as 2 out of 10 and about 4% of respondent ranked
it as 3 out of 10 and about 5% of the respondent ranked it as 4 out of 10 and about 12% of the
respondent ranked it as 5 out of 10 and about 10% of the respondent ranked it as 6 out of 10 and
about 18% of the respondent ranked it as 7 out of 10 and about 13% of the respondent ranked it
as 8 out of 10 and about 24% of the respondent ranked it as 9 out of 10 and about 6% of the
respondent ranked it as 10 out of 10.
The above table and graph denotes the customer view about the odor at Big cinemas Mangalore.
Out of the 174 respondent 2% of respondent ranked it as 1out of 10 which means least and about
3% of the respondent ranked it as 2 out of 10 and about 3% of respondent ranked it as 3 out of 10
and about 3% of the respondent ranked it as 4 out of 10 and about 9% of the respondent ranked it
as 5 out of 10 and about 11% of the respondent ranked it as 6 out of 10 and about 11% of the
respondent ranked it as 7 out of 10 and about 20% of the respondent ranked it as 8 out of 10 and
about 29% of the respondent ranked it as 9 out of 10 and about 9% of the respondent ranked it as
10 out of 10.
The above table and graph denotes the customer view about the Waiting lounge at Big cinemas
Mangalore. Out of the 174 respondent 9% of respondent ranked it as 1out of 10 which means
least and about 25% of the respondent ranked it as 2 out of 10 and about 6% of respondent
ranked it as 3 out of 10 and about 7% of the respondent ranked it as 4 out of 10 and about 9% of
the respondent ranked it as 5 out of 10 and about 9% of the respondent ranked it as 6 out of 10
and about 14% of the respondent ranked it as 7 out of 10 and about 16% of the respondent
ranked it as 8 out of 10 and about 2% of the respondent ranked it as 9 out of 10 and about 3% of
the respondent ranked it as 10 out of 10.
Table 3.12: Showing Safety at Bharat
Particulars
Secure
Safe
Average
Unsafe
Risky
Total
Figure3.12: Showing Safety at Bharat
Interpretation:
The above table and graph denotes
Mangalore. Out of the 174 respondent 25 % of respondent feel it as secure and about 49% of the
respondent feel it as safe and about 18%
feel it as unsafe and about 3% of the respondent feel it as risky.
Secure Safe
26%
49%
percentage
51
howing Safety at Bharat Big cinemas
Particulars Respondent Percentage
44 25
85 49
32 18
8 5
5 3
174 100
Showing Safety at Bharat Big cinemas
The above table and graph denotes the customer view about the safety measures at
. Out of the 174 respondent 25 % of respondent feel it as secure and about 49% of the
respondent feel it as safe and about 18% of respondent feel it as moderate/average and about 5%
feel it as unsafe and about 3% of the respondent feel it as risky.
Safe Average Unsafe Risky
49%
18%
5%
3%
particulars
the customer view about the safety measures at Big cinemas
. Out of the 174 respondent 25 % of respondent feel it as secure and about 49% of the
of respondent feel it as moderate/average and about 5%
Table 3.13: Showing Seating comforts & Seat layout Bharat
Particulars Respondent
Excellent 26
Very good 60
Good 60
Average 22
Poor 6
Total 174
Figure 3.13: Showing Seating comforts & Seat layout Bharat
Interpretation:
The above table and graph represent the view of customers about the
layout at Big cinemas Mangalore. Out of the entire 174 respondent 15 % of respondent rate
Excellent and about 34% of the respondent rate it as very good and about 34% of respondent rate
as good and about 13% rate it as average and about 4% rate it as
Excellent Very good
15%
34%
percentage
52
Showing Seating comforts & Seat layout Bharat Big cinemas
Respondent Percentage
26 15
60 34
60 34
22 13
4
174 100
Showing Seating comforts & Seat layout Bharat Big cinemas
The above table and graph represent the view of customers about the Seating comforts &
Mangalore. Out of the entire 174 respondent 15 % of respondent rate
Excellent and about 34% of the respondent rate it as very good and about 34% of respondent rate
as good and about 13% rate it as average and about 4% rate it as poor.
Very good Good Average Poor
34% 34%
13%
particulars
Big cinemas
Big cinemas
Seating comforts & Seat
Mangalore. Out of the entire 174 respondent 15 % of respondent rate
Excellent and about 34% of the respondent rate it as very good and about 34% of respondent rate
Poor
4%
Table 3.14: Showing Interior Odor & Air conditioning
Particulars
Excellent
Very good
Good
Average
Poor
Total
Figure 3.14: Showing Interior Odor & Air conditioning
Interpretation:
The above table and graph represent the view of customers about the
conditioning at Big cinemas
Excellent and about 31% of the respondent rate it as very good and about 44% of respondent rate
as good and about 11% rate it as average and about 2% rate it as poor.
Excellent
Very good
12%
31%
percentage
53
Showing Interior Odor & Air conditioning
Respondent Percentage
22 12
54 31
76 44
19 11
3 2
174 100
Showing Interior Odor & Air conditioning
The above table and graph represent the view of customers about the interior Odor & Air
Big cinemas Mangalore. Out of the 174 respondent 12 % of respondent rate
Excellent and about 31% of the respondent rate it as very good and about 44% of respondent rate
as good and about 11% rate it as average and about 2% rate it as poor.
Very good
Good
Average
Poor
31%
44%
11%
particulars
interior Odor & Air
Mangalore. Out of the 174 respondent 12 % of respondent rate
Excellent and about 31% of the respondent rate it as very good and about 44% of respondent rate
Poor
2%
Table 3.15: Showing Quality
Particulars
Excellent
Very good
Good
Average
Poor
Total
Figure 3.15: Showing Quality and hygiene of food & beverages at Bharat
Interpretation:
The above table and graph symbolize the view of customers about the
food & beverages at Big cinemas
Excellent and about 26% of the respondent ra
as good and about 14% rate it as average and about 6% rate it as poor.
Good
38%
Average
14%
54
Showing Quality and hygiene of food & beverages at Bharat
Respondent Percentage
27 16
45 26
66 38
25 14
11 6
174 100
Showing Quality and hygiene of food & beverages at Bharat
The above table and graph symbolize the view of customers about the quality and hygiene of
Big cinemas Mangalore. Out of the 174 respondent 16 % of respondent rate
Excellent and about 26% of the respondent rate it as very good and about 38% of respondent rate
as good and about 14% rate it as average and about 6% rate it as poor.
Excellent
16%
Very good
26%
Poor
6%
and hygiene of food & beverages at Bharat Big cinemas
Showing Quality and hygiene of food & beverages at Bharat Big cinemas
quality and hygiene of
Mangalore. Out of the 174 respondent 16 % of respondent rate
te it as very good and about 38% of respondent rate
Very good
26%
Table 3.16: Showing Variety of food items &
Particulars
Numerous variety
Several variety
Fewer variety
Limited variety
No variety
Total
Figure 3.16: Showing Variety of food items &
Interpretation:
The above table and graph signify the view of
beverages available in the Cafe
respondent feels it has numerous varieties and about 34% of the respondent feels it has several
variety and about 29% of respondent feels it has fewer variety and about 24% feels it has limited
variety and about 5% of respondents feels it has No variety.
Numerous variety
Several variety
Fewer variety
Limited variety
No variety
particulars
55
Showing Variety of food items & beverages available in the Cafe
Respondent Percentage
13 8
59 34
51 29
42 24
9 5
174 100
Showing Variety of food items & beverages available in the Cafe
The above table and graph signify the view of customers about the variety of food items &
beverages available in the Cafe at Big cinemas Mangalore. Out of the 174 respondent 8 % of
respondent feels it has numerous varieties and about 34% of the respondent feels it has several
respondent feels it has fewer variety and about 24% feels it has limited
variety and about 5% of respondents feels it has No variety.
8%
24%
5%
percentage
beverages available in the Cafe
variety of food items &
Mangalore. Out of the 174 respondent 8 % of
respondent feels it has numerous varieties and about 34% of the respondent feels it has several
respondent feels it has fewer variety and about 24% feels it has limited
34%
29%
Table 3.17: Showing Prices of food & combos provided
Particulars
Economical
Affordable
Reasonable
Expensive
Very Expensive
Total
Figure 3.17:Showing Prices of food & combos provided
Interpretation:
The above table and graph represent
provided at Big cinemas Mangalore
Economical and about 21% of the respondent rate it as affordable and about 31% of respondent
rate it as Reasonable and about 29% rate it as Expensive and about 10% of the respondent
as very expensive
Economical
Affordable
8%
21%
percentage
particulars
56
Showing Prices of food & combos provided
Respondent Percentage
13 8
36 21
53 31
48 29
18 11
174 100
Showing Prices of food & combos provided
The above table and graph represent the customer feel about the prices of food & combos
Mangalore. Out of the 174 respondent 8 % of respondent rate it as
Economical and about 21% of the respondent rate it as affordable and about 31% of respondent
rate it as Reasonable and about 29% rate it as Expensive and about 10% of the respondent
Affordable
Reasonable
Expensive
Very
Expensive
21%
31%
29%
11%
particulars
the customer feel about the prices of food & combos
. Out of the 174 respondent 8 % of respondent rate it as
Economical and about 21% of the respondent rate it as affordable and about 31% of respondent
rate it as Reasonable and about 29% rate it as Expensive and about 10% of the respondent rate it
Very
Expensive
11%
Table 3.18: Showing Quantity and taste of food served
Particulars
Excellent
Very good
Good
Average
Poor
Total
Figure 3.18: Showing Quantity and taste of food served
Interpretation:
The above table and graph symbolize the view of customers about the
served at Big cinemas Mangalore. Out of the 174 respondent 10 % of respondent rate Excellent
and about 18% of the respondent rate it as very good and about 45% of respondent rate as good
and about 22% rate it as average and about 5% rate it as poor.
Excellent
Very good
Good
Average
Poor 5%
particulars
57
Showing Quantity and taste of food served
Respondent Percentage
18 10
32 18
78 45
38 22
8 5
174 100
Showing Quantity and taste of food served
The above table and graph symbolize the view of customers about the quantity and taste of food
Mangalore. Out of the 174 respondent 10 % of respondent rate Excellent
out 18% of the respondent rate it as very good and about 45% of respondent rate as good
and about 22% rate it as average and about 5% rate it as poor.
10%
18%
22%
percentage
quantity and taste of food
Mangalore. Out of the 174 respondent 10 % of respondent rate Excellent
out 18% of the respondent rate it as very good and about 45% of respondent rate as good
45%
Table 3.19: Showing Hygiene and cleanliness maintained in wash room
Figure3.19: Showing Hygiene and cleanliness maintained in wash room
Interpretation:
The above table and graph signify the view of customers about
maintained in wash room at
respondent rate Excellent and about 25% of the respondent rate it as very good and about 15% of
respondent rate as good and about 17% rate it a
Excellent
Very good
Good
Average
Poor
particulars
percentage
Particulars
Excellent
Very good
Good
Average
Poor
Total
58
Showing Hygiene and cleanliness maintained in wash room
The above table and graph signify the view of customers about the hygiene and cleanliness
maintained in wash room at Big cinemas Mangalore. Out of the 174 respondent 31 % of
respondent rate Excellent and about 25% of the respondent rate it as very good and about 15% of
respondent rate as good and about 17% rate it as average and about 12 % rate it as poor.
31%
25%
15%
17%
12%
percentage
Respondent Percentage
53 31
43 25
27 15
30 17
21 12
174 100
hygiene and cleanliness
Mangalore. Out of the 174 respondent 31 % of
respondent rate Excellent and about 25% of the respondent rate it as very good and about 15% of
s average and about 12 % rate it as poor.
Table 3.20: Showing Advertisement medium to know the movies being played of that week
Particulars
Newspaper
Internet
Family/friends
Mall display boards
Movie advertisement
Total
Figure 3.20: Showing Advertisement medium to know the movies being played of that week
Interpretation:
The above table and graph denotes
movies played at Big cinemas
Newspaper Advertisement comes to know about the movies being played of that week and about
23% of the respondent through Internet Advertisement comes to know about the movies being
played of that week and about 16% of respondent through Family/Friends comes to know about
the movies being played of that week and about 15% respondent through mall display board
Advertisement comes to know about the movies being played of that week and abou
respondent through Movie Advertisement comes to know about the movies being played of that
week.
Newspaper
Internet
Family/friends
Mall display boards
Movie advertisement
particulars
59
Showing Advertisement medium to know the movies being played of that week
Frequency Percentage
122 36
79 23
53 16
Mall display boards 51 15
Movie advertisement 34 10
339 100
Showing Advertisement medium to know the movies being played of that week
The above table and graph denotes the mode in which customers comes to know about the
cinemas Mangalore. Out of the 174 respondent 36 % of respondent through
Newspaper Advertisement comes to know about the movies being played of that week and about
23% of the respondent through Internet Advertisement comes to know about the movies being
yed of that week and about 16% of respondent through Family/Friends comes to know about
the movies being played of that week and about 15% respondent through mall display board
Advertisement comes to know about the movies being played of that week and abou
respondent through Movie Advertisement comes to know about the movies being played of that
23%
16%
15%
10%
percentage
Showing Advertisement medium to know the movies being played of that week
the mode in which customers comes to know about the
. Out of the 174 respondent 36 % of respondent through
Newspaper Advertisement comes to know about the movies being played of that week and about
23% of the respondent through Internet Advertisement comes to know about the movies being
yed of that week and about 16% of respondent through Family/Friends comes to know about
the movies being played of that week and about 15% respondent through mall display board
Advertisement comes to know about the movies being played of that week and about 10% of the
respondent through Movie Advertisement comes to know about the movies being played of that
36%
Table 3.21: Showing whether customers go to other theaters to watch the movies If you
don’t get tickets at Bharat
Particulars
Frequency
Percentage
Figure 3.21: Showing whether customers go to other theaters to Watch the movies If you
don’t get tickets at Bharat Big cinemas
Interpretation:
The above table and graph depict
tickets are not available at Big cinemas
customers visit other theaters and about 11% of respondent do not visit other
Yes
No
11%
particulars
60
Showing whether customers go to other theaters to watch the movies If you
don’t get tickets at Bharat Big cinemas
Yes No Total
154 20 174
89 11 100
Showing whether customers go to other theaters to Watch the movies If you
Big cinemas
The above table and graph depict the customer opinion about visiting to other Theaters if the
Big cinemas Mangalore. Out of 174 respondents about 89% of
customers visit other theaters and about 11% of respondent do not visit other
89%
percentage
Showing whether customers go to other theaters to watch the movies If you
Showing whether customers go to other theaters to Watch the movies If you
the customer opinion about visiting to other Theaters if the
Mangalore. Out of 174 respondents about 89% of
customers visit other theaters and about 11% of respondent do not visit other theaters.
61
Table 3.22: Representing the customer preference to opt for other movies if they don’t get
the tickets for the movies of their choice
Particulars Yes No Total
Respondent 106 68 174
Percentage 61 39 100
Figure 3.22: Representing the customer preference to opt for other movies if they don’t get
the tickets for the movies of their choice
Interpretation:
The above table and graph depict the customer opinion about watching other movies if they do
not get tickets for the movies of their choice at Big cinemas Mangalore. Out of 174 respondents
about 61% of customers watch other movies and about 39% of respondent do not watch any
other movie for that visit
Yes
61%
No
39%
62
Table 2.23: Showing the screen size of Bharat Big cinemas compared to the Local theaters
Particulars Respondent Percentage
Excellent 29 17
Very good 65 37
Good 60 34
Average 17 10
Poor 3 2
Total 174 100
Figure 2.23:Showing the screen size of Bharat Big cinemas compared to the Local theaters
Interpretation:
The above table and graph signify the view of customers about the screen size atBig cinemas
Mangalore. Out of the 174 respondent 17 % of respondent rate Excellent and about 37% of the
respondent rate it as very good and about 34% of respondent rate as good and about 10% rate it
as average and about 2 % rate it as poor.
Excellent
17%
Very good
37%
Good
34%
Average
10%
Poor
2%
63
Table 2.24: Represents Sound & Picture quality
RATINGS: 1 2 3 4 5 6 7 8 9 10
Particulars Frequency Percentage
1 2 3 4 5 6 7 8 9 10 1 2 3 4 5 6 7 8 9 10
Picture Clarity 6 7 4 4 10 17 23 52 32 20 3 4 2 2 6 10 13 30 18 11
Sound Clarity 5 7 5 4 10 16 23 44 45 15 3 4 3 2 6 9 13 25 26 9
Screen size 6 7 5 4 12 11 19 49 47 14 3 4 3 2 7 6 11 28 27 8
Brightness 4 7 5 3 12 16 22 44 44 17 2 4 3 2 7 9 13 25 25 10
Sharpness 3 7 6 4 7 18 22 49 40 18 2 4 3 2 4 10 13 28 23 10
Figure 2.24:Represents Sound & Picture quality
3% 3% 3% 2% 2%
4% 4% 4%
4% 4%
2% 3% 3% 3% 3%
2% 2% 2% 2% 2%
6% 6%
7%
7% 4%
10%
9% 6% 9% 10%
13% 13%
11%
13%
13%
30%
25%
28%
25% 28%
18%
26% 27%
25% 23%
11%
9%
8%
10% 10%
Picture clarity Sound clarity Screen size Brightness Sharpness of picture
Rank 1
Rank 2
Rank 3
Rank 4
Rank 5
Rank 6
Rank 7
Rank 8
Rank 9
Rank 10
64
Interpretation:
The above table and graph denotes the customer view about the Picture Quality at Big cinemas
Mangalore. Out of the 174 respondent 3% of respondent ranked it as 1out of 10 which means
least and about 4% of the respondent ranked it as 2 out of 10 and about 2% of respondent ranked
it as 3 out of 10 and about 2% of the respondent ranked it as 4 out of 10 and about 6% of the
respondent ranked it as 5 out of 10 and about 10% of the respondent ranked it as 6 out of 10 and
about 13% of the respondent ranked it as 7 out of 10 and about 30% of the respondent ranked it
as 8 out of 10 and about 18% of the respondent ranked it as 9 out of 10 and about 11% of the
respondent ranked it as 10 out of 10.
The above table and graph denotes the customer view about the sound clarity at Big cinemas
Mangalore. Out of the 174 respondent 3% of respondent ranked it as 1out of 10 which means
least and about 4% of the respondent ranked it as 2 out of 10 and about 3% of respondent ranked
it as 3 out of 10 and about 2% of the respondent ranked it as 4 out of 10 and about 6% of the
respondent ranked it as 5 out of 10 and about 9% of the respondent ranked it as 6 out of 10 and
about 13% of the respondent ranked it as 7 out of 10 and about 25% of the respondent ranked it
as 8 out of 10 and about 26% of the respondent ranked it as 9 out of 10 and about 9% of the
respondent ranked it as 10 out of 10.
The above table and graph denotes the customer view about the Screen size at Big cinemas
Mangalore. Out of the 174 respondent 3% of respondent ranked it as 1out of 10 which means
least and about 4% of the respondent ranked it as 2 out of 10 and about 3% of respondent ranked
it as 3 out of 10 and about 2% of the respondent ranked it as 4 out of 10 and about 7% of the
respondent ranked it as 5 out of 10 and about 6% of the respondent ranked it as 6 out of 10 and
about 11% of the respondent ranked it as 7 out of 10 and about 28% of the respondent ranked it
as 8 out of 10 and about 27% of the respondent ranked it as 9 out of 10 and about 8% of the
respondent ranked it as 10 out of 10.
The above table and graph denotes the customer view about the Brightness at Big cinemas
Mangalore. Out of the 174 respondent 2% of respondent ranked it as 1out of 10 which means
least and about 4% of the respondent ranked it as 2 out of 10 and about 3% of respondent ranked
it as 3 out of 10 and about 2% of the respondent ranked it as 4 out of 10 and about 7% of the
MBA (VTU) project - BIG Cinemas Mangalore

More Related Content

What's hot

color tv channel
color tv channelcolor tv channel
color tv channel
BHAVIN GALA
 
1691389 634967018573835000
1691389 6349670185738350001691389 634967018573835000
1691389 634967018573835000
Abhishek Tanna
 
Entertainment industry in india
Entertainment industry in indiaEntertainment industry in india
Entertainment industry in india
Dp Singh
 

What's hot (20)

color tv channel
color tv channelcolor tv channel
color tv channel
 
Indian film industry
Indian film industryIndian film industry
Indian film industry
 
Over the-top media service in india
Over the-top media service in indiaOver the-top media service in india
Over the-top media service in india
 
A Study of Sales & Distribution Mechanisms of Hindi Cinema
A Study of Sales & Distribution Mechanisms of Hindi CinemaA Study of Sales & Distribution Mechanisms of Hindi Cinema
A Study of Sales & Distribution Mechanisms of Hindi Cinema
 
The Indian Media & Entertainment Industry 2022
The Indian Media & Entertainment Industry 2022The Indian Media & Entertainment Industry 2022
The Indian Media & Entertainment Industry 2022
 
Indian Film industry
Indian Film industryIndian Film industry
Indian Film industry
 
OTT & The Future of Connected TV
OTT & The Future of Connected TVOTT & The Future of Connected TV
OTT & The Future of Connected TV
 
1691389 634967018573835000
1691389 6349670185738350001691389 634967018573835000
1691389 634967018573835000
 
Apollo Tyres India Ltd.’s Growth Strategy: Treading Global Markets
Apollo Tyres India Ltd.’s Growth Strategy:  Treading Global Markets Apollo Tyres India Ltd.’s Growth Strategy:  Treading Global Markets
Apollo Tyres India Ltd.’s Growth Strategy: Treading Global Markets
 
Entertainment industry in india
Entertainment industry in indiaEntertainment industry in india
Entertainment industry in india
 
Bollywood PPT
Bollywood PPTBollywood PPT
Bollywood PPT
 
Tivo
TivoTivo
Tivo
 
Amazon Prime Video: Delivering the Amazing Video Experience (CTD203-R1) - AWS...
Amazon Prime Video: Delivering the Amazing Video Experience (CTD203-R1) - AWS...Amazon Prime Video: Delivering the Amazing Video Experience (CTD203-R1) - AWS...
Amazon Prime Video: Delivering the Amazing Video Experience (CTD203-R1) - AWS...
 
OTT vs Theatre.pptx
OTT vs Theatre.pptxOTT vs Theatre.pptx
OTT vs Theatre.pptx
 
BUSINESS PLAN - OTT PLATFORM
BUSINESS PLAN - OTT PLATFORMBUSINESS PLAN - OTT PLATFORM
BUSINESS PLAN - OTT PLATFORM
 
Rise of an OTT Platforms in India - Explained by iStrategist Institute
Rise of an OTT Platforms in India  - Explained by iStrategist Institute Rise of an OTT Platforms in India  - Explained by iStrategist Institute
Rise of an OTT Platforms in India - Explained by iStrategist Institute
 
Dlf ltd.
Dlf ltd.Dlf ltd.
Dlf ltd.
 
Reality tv shows
Reality tv showsReality tv shows
Reality tv shows
 
The Indian Media & Entertainment Industry 2015
The Indian Media & Entertainment Industry 2015The Indian Media & Entertainment Industry 2015
The Indian Media & Entertainment Industry 2015
 
PEST & Porter’s five force analysis on two wheeler industry
PEST & Porter’s five force analysis on two wheeler industryPEST & Porter’s five force analysis on two wheeler industry
PEST & Porter’s five force analysis on two wheeler industry
 

Viewers also liked

Organisational Chart - Theatre
Organisational Chart - TheatreOrganisational Chart - Theatre
Organisational Chart - Theatre
Zahra06
 
Swot analysis of media and entertainment industry
Swot analysis of media and entertainment industrySwot analysis of media and entertainment industry
Swot analysis of media and entertainment industry
judygan
 
Combos Cinemex
Combos CinemexCombos Cinemex
Combos Cinemex
Encorto
 
Big bazaar project
Big bazaar projectBig bazaar project
Big bazaar project
sandy14333
 

Viewers also liked (12)

Organisational Chart - Theatre
Organisational Chart - TheatreOrganisational Chart - Theatre
Organisational Chart - Theatre
 
MBA PROJECT vtu
MBA PROJECT vtu MBA PROJECT vtu
MBA PROJECT vtu
 
Project plan
Project planProject plan
Project plan
 
Swot analysis of media and entertainment industry
Swot analysis of media and entertainment industrySwot analysis of media and entertainment industry
Swot analysis of media and entertainment industry
 
A study on consumer buying behaviour at shoppers stop
A study on consumer buying behaviour at shoppers stopA study on consumer buying behaviour at shoppers stop
A study on consumer buying behaviour at shoppers stop
 
A Student Analysis of the Movie Theater Industry
A Student Analysis of the Movie Theater IndustryA Student Analysis of the Movie Theater Industry
A Student Analysis of the Movie Theater Industry
 
Marketing strategies & consumers satisfaction @big bazaar
Marketing strategies & consumers satisfaction @big bazaarMarketing strategies & consumers satisfaction @big bazaar
Marketing strategies & consumers satisfaction @big bazaar
 
MARKETING STRATEGY & CUSTOMER SATISFACTION OF BIG BAZAAR
MARKETING STRATEGY & CUSTOMER SATISFACTION OF BIG BAZAARMARKETING STRATEGY & CUSTOMER SATISFACTION OF BIG BAZAAR
MARKETING STRATEGY & CUSTOMER SATISFACTION OF BIG BAZAAR
 
Cinemex
CinemexCinemex
Cinemex
 
Combos Cinemex
Combos CinemexCombos Cinemex
Combos Cinemex
 
Big bazaar project
Big bazaar projectBig bazaar project
Big bazaar project
 
6 SWOT Analysis Examples to Help You Write Your Own
6 SWOT Analysis Examples to Help You Write Your Own6 SWOT Analysis Examples to Help You Write Your Own
6 SWOT Analysis Examples to Help You Write Your Own
 

Similar to MBA (VTU) project - BIG Cinemas Mangalore

2438171 indian-entertainment-industry-focus-2010
2438171 indian-entertainment-industry-focus-20102438171 indian-entertainment-industry-focus-2010
2438171 indian-entertainment-industry-focus-2010
saras89
 
Copy of final ppt
Copy of final pptCopy of final ppt
Copy of final ppt
jaydip111
 
Indias entertainment-economy oct- 2011_
Indias entertainment-economy oct- 2011_Indias entertainment-economy oct- 2011_
Indias entertainment-economy oct- 2011_
Luckykapoor Kapoor
 
Seizing new growth opportunities in India’s entertainment economy
Seizing new growth opportunities in India’s entertainment economySeizing new growth opportunities in India’s entertainment economy
Seizing new growth opportunities in India’s entertainment economy
Raghav Mani
 
Indias entertainment-economy oct- 2011
Indias entertainment-economy oct- 2011Indias entertainment-economy oct- 2011
Indias entertainment-economy oct- 2011
Najim Shaikh
 

Similar to MBA (VTU) project - BIG Cinemas Mangalore (20)

Beacon September 2014
Beacon September 2014Beacon September 2014
Beacon September 2014
 
Indian Media Entertainment Industry Analysis
Indian Media Entertainment Industry AnalysisIndian Media Entertainment Industry Analysis
Indian Media Entertainment Industry Analysis
 
Pages for report
Pages for reportPages for report
Pages for report
 
FICCI- Deloitte report - ‘Media & Entertainment in South India - the Digital ...
FICCI- Deloitte report - ‘Media & Entertainment in South India - the Digital ...FICCI- Deloitte report - ‘Media & Entertainment in South India - the Digital ...
FICCI- Deloitte report - ‘Media & Entertainment in South India - the Digital ...
 
Synopsis & toc sectoral capsule - growing presence of media in india
Synopsis & toc   sectoral capsule - growing presence of media in indiaSynopsis & toc   sectoral capsule - growing presence of media in india
Synopsis & toc sectoral capsule - growing presence of media in india
 
Macroeconomic analysis of the indian entertainment industry
Macroeconomic analysis of the indian entertainment industryMacroeconomic analysis of the indian entertainment industry
Macroeconomic analysis of the indian entertainment industry
 
Predictive Analytics: Use Case in Entertainment Sector
Predictive Analytics: Use Case in Entertainment SectorPredictive Analytics: Use Case in Entertainment Sector
Predictive Analytics: Use Case in Entertainment Sector
 
Kpmg ficci
Kpmg ficciKpmg ficci
Kpmg ficci
 
Managing And Sustaining Profitable Growth Analysis for VIVA
Managing And Sustaining Profitable Growth Analysis for VIVAManaging And Sustaining Profitable Growth Analysis for VIVA
Managing And Sustaining Profitable Growth Analysis for VIVA
 
2438171 indian-entertainment-industry-focus-2010
2438171 indian-entertainment-industry-focus-20102438171 indian-entertainment-industry-focus-2010
2438171 indian-entertainment-industry-focus-2010
 
FICCI-KPMG_2015
FICCI-KPMG_2015FICCI-KPMG_2015
FICCI-KPMG_2015
 
Sector analysis
Sector analysisSector analysis
Sector analysis
 
Copy of final ppt
Copy of final pptCopy of final ppt
Copy of final ppt
 
World's Largest Indian Entertainment Industry : IBEF Report ($30.5 Billion)
World's Largest Indian Entertainment Industry : IBEF Report ($30.5 Billion)World's Largest Indian Entertainment Industry : IBEF Report ($30.5 Billion)
World's Largest Indian Entertainment Industry : IBEF Report ($30.5 Billion)
 
Kpmg report covid 19-the many shades of a crisis (m&e perspective)
Kpmg report covid 19-the many shades of a crisis (m&e perspective)Kpmg report covid 19-the many shades of a crisis (m&e perspective)
Kpmg report covid 19-the many shades of a crisis (m&e perspective)
 
India : Entertainment Sector Report_August 2013
India : Entertainment Sector Report_August 2013India : Entertainment Sector Report_August 2013
India : Entertainment Sector Report_August 2013
 
Indias entertainment-economy oct- 2011_
Indias entertainment-economy oct- 2011_Indias entertainment-economy oct- 2011_
Indias entertainment-economy oct- 2011_
 
Seizing new growth opportunities in India’s entertainment economy
Seizing new growth opportunities in India’s entertainment economySeizing new growth opportunities in India’s entertainment economy
Seizing new growth opportunities in India’s entertainment economy
 
Economic Study of Television Advertising Market in Bangladesh
Economic Study of Television Advertising Market in BangladeshEconomic Study of Television Advertising Market in Bangladesh
Economic Study of Television Advertising Market in Bangladesh
 
Indias entertainment-economy oct- 2011
Indias entertainment-economy oct- 2011Indias entertainment-economy oct- 2011
Indias entertainment-economy oct- 2011
 

Recently uploaded

Salient Features of India constitution especially power and functions
Salient Features of India constitution especially power and functionsSalient Features of India constitution especially power and functions
Salient Features of India constitution especially power and functions
KarakKing
 

Recently uploaded (20)

Towards a code of practice for AI in AT.pptx
Towards a code of practice for AI in AT.pptxTowards a code of practice for AI in AT.pptx
Towards a code of practice for AI in AT.pptx
 
How to Create and Manage Wizard in Odoo 17
How to Create and Manage Wizard in Odoo 17How to Create and Manage Wizard in Odoo 17
How to Create and Manage Wizard in Odoo 17
 
Application orientated numerical on hev.ppt
Application orientated numerical on hev.pptApplication orientated numerical on hev.ppt
Application orientated numerical on hev.ppt
 
On National Teacher Day, meet the 2024-25 Kenan Fellows
On National Teacher Day, meet the 2024-25 Kenan FellowsOn National Teacher Day, meet the 2024-25 Kenan Fellows
On National Teacher Day, meet the 2024-25 Kenan Fellows
 
REMIFENTANIL: An Ultra short acting opioid.pptx
REMIFENTANIL: An Ultra short acting opioid.pptxREMIFENTANIL: An Ultra short acting opioid.pptx
REMIFENTANIL: An Ultra short acting opioid.pptx
 
On_Translating_a_Tamil_Poem_by_A_K_Ramanujan.pptx
On_Translating_a_Tamil_Poem_by_A_K_Ramanujan.pptxOn_Translating_a_Tamil_Poem_by_A_K_Ramanujan.pptx
On_Translating_a_Tamil_Poem_by_A_K_Ramanujan.pptx
 
General Principles of Intellectual Property: Concepts of Intellectual Proper...
General Principles of Intellectual Property: Concepts of Intellectual  Proper...General Principles of Intellectual Property: Concepts of Intellectual  Proper...
General Principles of Intellectual Property: Concepts of Intellectual Proper...
 
UGC NET Paper 1 Mathematical Reasoning & Aptitude.pdf
UGC NET Paper 1 Mathematical Reasoning & Aptitude.pdfUGC NET Paper 1 Mathematical Reasoning & Aptitude.pdf
UGC NET Paper 1 Mathematical Reasoning & Aptitude.pdf
 
This PowerPoint helps students to consider the concept of infinity.
This PowerPoint helps students to consider the concept of infinity.This PowerPoint helps students to consider the concept of infinity.
This PowerPoint helps students to consider the concept of infinity.
 
How to Give a Domain for a Field in Odoo 17
How to Give a Domain for a Field in Odoo 17How to Give a Domain for a Field in Odoo 17
How to Give a Domain for a Field in Odoo 17
 
COMMUNICATING NEGATIVE NEWS - APPROACHES .pptx
COMMUNICATING NEGATIVE NEWS - APPROACHES .pptxCOMMUNICATING NEGATIVE NEWS - APPROACHES .pptx
COMMUNICATING NEGATIVE NEWS - APPROACHES .pptx
 
Wellbeing inclusion and digital dystopias.pptx
Wellbeing inclusion and digital dystopias.pptxWellbeing inclusion and digital dystopias.pptx
Wellbeing inclusion and digital dystopias.pptx
 
TỔNG ÔN TẬP THI VÀO LỚP 10 MÔN TIẾNG ANH NĂM HỌC 2023 - 2024 CÓ ĐÁP ÁN (NGỮ Â...
TỔNG ÔN TẬP THI VÀO LỚP 10 MÔN TIẾNG ANH NĂM HỌC 2023 - 2024 CÓ ĐÁP ÁN (NGỮ Â...TỔNG ÔN TẬP THI VÀO LỚP 10 MÔN TIẾNG ANH NĂM HỌC 2023 - 2024 CÓ ĐÁP ÁN (NGỮ Â...
TỔNG ÔN TẬP THI VÀO LỚP 10 MÔN TIẾNG ANH NĂM HỌC 2023 - 2024 CÓ ĐÁP ÁN (NGỮ Â...
 
Food safety_Challenges food safety laboratories_.pdf
Food safety_Challenges food safety laboratories_.pdfFood safety_Challenges food safety laboratories_.pdf
Food safety_Challenges food safety laboratories_.pdf
 
Mehran University Newsletter Vol-X, Issue-I, 2024
Mehran University Newsletter Vol-X, Issue-I, 2024Mehran University Newsletter Vol-X, Issue-I, 2024
Mehran University Newsletter Vol-X, Issue-I, 2024
 
Accessible Digital Futures project (20/03/2024)
Accessible Digital Futures project (20/03/2024)Accessible Digital Futures project (20/03/2024)
Accessible Digital Futures project (20/03/2024)
 
Basic Civil Engineering first year Notes- Chapter 4 Building.pptx
Basic Civil Engineering first year Notes- Chapter 4 Building.pptxBasic Civil Engineering first year Notes- Chapter 4 Building.pptx
Basic Civil Engineering first year Notes- Chapter 4 Building.pptx
 
Interdisciplinary_Insights_Data_Collection_Methods.pptx
Interdisciplinary_Insights_Data_Collection_Methods.pptxInterdisciplinary_Insights_Data_Collection_Methods.pptx
Interdisciplinary_Insights_Data_Collection_Methods.pptx
 
Graduate Outcomes Presentation Slides - English
Graduate Outcomes Presentation Slides - EnglishGraduate Outcomes Presentation Slides - English
Graduate Outcomes Presentation Slides - English
 
Salient Features of India constitution especially power and functions
Salient Features of India constitution especially power and functionsSalient Features of India constitution especially power and functions
Salient Features of India constitution especially power and functions
 

MBA (VTU) project - BIG Cinemas Mangalore

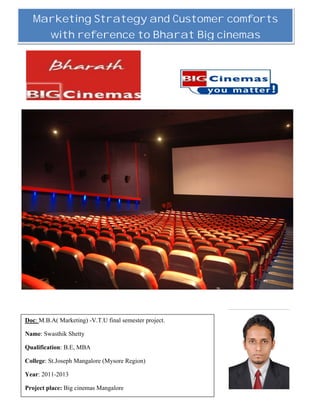
  • 1. 1 Marketing Strategy and Customer comforts with reference to Bharat Big cinemas Doc: M.B.A( Marketing) -V.T.U final semester project. Name: Swasthik Shetty Qualification: B.E, MBA College: St.Joseph Mangalore (Mysore Region) Year: 2011-2013 Project place: Big cinemas Mangalore
  • 2. 2 EXECUTIVE SUMMARY Entertainment Industry today is being redefined in terms of content, delivery mechanisms and the emerging technologies. The Film Industry is overwhelmed by the growth of multiplexes, which has changed not only the entire entertainment experience for the consumers but also impacted the movie making business. The Television Industry continues to boom new channels being launched and new content formats emerging such as reality shows, niche and kid’s channels. Here again, emerging technologies such as broadband and digitalization will cover the way for growth in this segment. The Indian entertainment and media industry has out-performed the Indian economy and is one of the fastest growing sectors in India. The entertainment and media industry generally tends to grow faster when the economy is expanding. The Indian economy has been growing at a fast clip over the last few years, and the income levels too have been experiencing a high growth rate. Above that, consumer spending is also on the rise, due to a sustained increase in disposable incomes, brought about by reduction in personal income tax over the last decade. All these factors have given an impetus to the entertainment and media industry and are likely to contribute to the growth of this industry in the future. Based on industry feedback, additional sections showcasing the emerging International Trends in each segment have been included in this year’s report. We thank Big cinemas for drawing the necessary knowledge from their global resources for this endeavor. Their effort to present the content of the report in a form that is interesting and useful, not only to the industry people but also the public at large is greatly appreciated. The crux of the problem is the Formulation of Innovative Marketing Strategies of Entertainment Services at Big cinemas, Mangalore. The research objectives include examination the services offered by Big cinemas, ascertaining the customer satisfaction level and explore the fun innovation of Big cinemas. The research investigation indicated that the Big cinemas promotional activities are very effective; services are youth-oriented and have the cutting edge technology. However constant innovation is needed to sustain its distinctive competitive advantage.
  • 3. 3 1. INDUSTRY PROFILE Today, new media of all types must be considered when considering the scope of the entertainment and media industry. Broadly measured, the entertainment and media industry spans multiple sectors, from America's 9,042 FM radio stations, to the 1.4 billion movie tickets sold each year. Meanwhile, Newspapers are finding it increasingly difficult to compete against Internet news and advertising delivery rivals. Recorded music sales on CD-ROM continue to suffer while sales of digital music files are soaring. Traditional radio broadcasting is suffering, finding it increasingly difficult to gather listeners for advertising-based radio programming due to such alternatives as satellite radio and digital MP3 players. The burning issue affecting all sectors of the entertainment and media industry is maintaining control of content and audiences while taking advantage of myriad new electronic delivery venues. Competition in the entertainment sector is fierce. Gone are the days when television and radio programmers enjoyed captive audiences who happily sat through ad after ad, or planned their schedules around a favorite show. Consumers, especially consumers in younger demographics, now demand more and more control over what they watch, read and listen to. The various Issues related to control include the factors such as Pricing for content including free-of-charge access; illegal downloads versus authorized downloads; and full ownership of a paid download versus pay-per-view. Portability including the ability for a consumer to download once, and then use a file on multiple platforms and devices including iPods and cell phones, or the ability to share a download with friends. Delayed viewing or listening such as viewing TV programming at the consumer's convenience and similar personal video recorders. The competition among entertainment delivery platforms has intensified; all sectors face daunting challenges from alternative delivery methods. For example, satellite radio delivery of subscription based music and talk programming has hit its stride multimillion subscriber counts for Sirius and its competitor XM. Another example: telecommunications companies such as AT&T are now delivering television programming to the home via telephone wires, battling cable and satellite TV firms for market share. Today Entertainment and media industry in India is seen as one of the most happening market place in the global market. Currently India is one of the best performing economies in the world. The magnitude of The Indian Entertainment and Media Industry can be made out from the fact
  • 4. 4 that it has out-performed the Indian economy and is one of the fastest growing sectors in India, riding on the back of economic growth and rising income levels that India has been experiencing in the past years with the onus of global entertainment industry expected to touch $1.8 trillion shifting towards the Asian region, India is well poised to garner a sizable share of it. India’s film industry is already the largest producer of feature films in the world. In the context of Indian Entertainment and Media industry, the Filmed Entertainment and Television segment dominate the industry followed by the Print, Radio and the Music segments. The Indian Entertainment and Media Industry offers ample opportunities for investing be it animation, films, dubbing, music etc. This report covers all the important aspects related to the industry with useful and important data thus offering a useful insight to the investor/reader looking to invest in this sector. Entry of new players in the year 2005 saw across all segments of the E&M industry. The most prominent entry was that of the Reliance Group in the filmed entertainment and radio segment. During 2005, Reliance Capital bought a majority stake in Big cinemas which enabled it to have a presence across the entire value chain of the filmed entertainment segment ranging from film production, exhibition and distribution. Through Big cinemas, Reliance also made its entry into the radio segment by bidding for over 50 FM radio stations across the country with aggregate bids of over INR 1.5 billion. The other significant entry into the entertainment and media segment was that of the Tata group, through its subsidiary Videsh Sanchar Nigam Limited .VSNL tied up with the Paris-based Thomson Group in 2005 with the objective of identifying opportunities in managing and delivering content for third parties, including broadcasters and content providers. Thomson Group has partnership with Tata Sky Limited for manufacturing set- top-boxes and providing sales service and support network for their DTH customers. Foreign investment Owing to the strong impetus for growth from the economic and demographic factors coupled with some regulatory corrections, the sector also recently witnessed increasing foreign investment inflows in most segments of the E&M industry, especially the print media. Recent examples include foreign investment in English dailies such as Hindustan Times and Business Standard by Henderson Global and Financial Times respectively. Vernacular media too saw its share of foreign investment with a strategic equity investment by Independent News & Media in DainikJagran, a leading Hindi Daily. In thebroadcasting space, most channels beaming into India such as Walt Disney, ESPN-Star Sports, Star, Discovery, BBC etc. have established foreigninvestment subsidiary companies for content development and advertisementairtime
  • 5. 5 sales. In the television distribution space arena, foreign investment isbeing drawn by the larger cable operators referred to as ‘multi-system operatorssuch as Hathway and Hindujas. In the television content space, therecent investment in Nimbus Communications by a foreign private equityplayer is seen as the start of a significant trend of foreign investment inflows.Current status of the industry with Indian economy continues to perform strongly and one of the key sectors that benefits from this fast economic growth is the E&M industry. This is because the E&M industry is a cyclical industry that grows faster when the economy is expanding. It also grows faster than the nominal GDP during all phases of economic activity due to its income elasticity when incomes rise, wherein more resources get spent on leisure and entertainment and less on necessities. Further, consumption spending itself is increasing due to rising disposable incomes on account of sustained growth in income levels, and this also builds the case for a strong bullish growth in the sector. The size of E&M in India is currently estimated at INR 353 billion and is expected to grow at a compounded annual growth rate of 19 percent over the next five years. The television industry continues to dominate the E&M industry by garnering a share of over 42 percent, which is expected to increase by a further 9 percent to reach about 51 percent. The share of the film industry, which currently stands at 19 percent, is not expected to change materially over the next five years. Print media, which stands at over 31 percent, is projected to lose some of its share in favor of the emerging segments. The Indian entertainment and media industry today has everything going for it - be it regulations that allow foreign investment, the impetus from the economy, the digital lifestyle and spending habits of the consumers and the Opportunities thrown open by the advancements in technology. All it has to do is to cash in on the growth potential and the opportunities. The government, on its part, needs to play a more active role in sorting out policy-related impediments to growth. The industry needs to fight all roadblocks- such as piracy- in a concerted manner, while churning out high-quality, world class end products. The entertainment and media industry has all that it takes to be a star performer of the Indian economy.
  • 6. 6 2. COMPANY PROFILE 2. A. BACKGROUND AND INCEPTION OF THE COMPANY Big cinemas, a Reliance Group of Company are one of the largest entertainment conglomerates in India. What started as a laboratory for processing ad films over three decades ago, has today become a key player in the entertainment and media industry. Big cinemas are by far the largest entertainment corporation in the country. Thought leaders in every sense of the word, they have been the defining force in every sphere of the entertainment industry - production, distribution, processing or in cinemas - for over three decades now, be it pioneering the concept of multiplexes, giving a corporate face to movie making, or introducing the IMAX experience, it has always been Big cinemas first - in short, it was never a dull moment for the industry.Big cinemas have a dominant and comprehensive presence in film services:motion picture processing and di, film restoration, digital mastering, studios and equipment rentals Big cinemas films. June 2005, marked the milestone in Big cinemas when Reliance stepped into the company and became majority promoter shareholders. With this move Big cinemas was catapulted to being part of one of the leading business groups in India with a combined market capitalization exceeding One Lakh crores. This management expertise and resources acted as a catalyst in synergizing various interrelated businesses: animation, distribution, radio and digital cinema to name a few. Today Big cinemas are the entertainment hub for top notch talent and cutting edge technology. Big cinemas offerthe opportunity to be part of India’s fastest and largest growing entertainment conglomerate. In other words, a chance to work with the best in the industry, as part of world-class teams, that tackle new challenges every day; in a company that is as committed to its employee’s growth as it is about its own success. Big cinemasfilms limited, a member of the Reliance Anil DhirubhaiAmbani group, is India’s fastest growing film and entertainment services company. Big cinemas have a dominant and comprehensive presence in film services, motion picture processing, film restoration, digital mastering, studios and equipment rentals. The Big cinemas films also operate India’s largest cinema chain with about 500screens spread across India, US and Malaysia. It has a significant presence in the film distribution space with a nationwide presence across India as well as offices in London, New York, Los angels and Malaysia.Big cinemas are committed to providing audiences across India
  • 7. 7 over all economic strata, access to Big cinemas world-class cinemas. This is being achieved through a strategy of not only setting up standalone properties and cinemas in malls, but also taking over current properties, renovating and operating them, taking advantage of theirconsiderable existing infrastructure and Brand value. The company has also launched India’s first 6D theatre launched at Agra and was among the first to show 3D versions of international movies.Big cinemas' television venture, synergy Big cinemas, is among thetop players in the television programming industry. Reliance Media WorksOver the years, Big cinemas has created iconic destinations such as BIG-Cinema Park in Agra, a kilometer away from the TajMahal, which has pioneered the multi-sensory cinema experience in India through a six dimensional show. Big cinemas has also partnered with IMAX Corporation to install IMAX’s new world class digital projection system in Big cinemas flagship IMAX theatre in Mumbai. This new technology has marked the first digital IMAX location in India and enabled Big cinemas to take advantage of the growing slate of Hollywood releases in IMAX and IMAX 3D. Big cinemas are thereby the only cinema in India which screens films in both 3D and 6D formats. Bharat Big cinemas Mangalore is a franchise of Reliance Big cinemas taken up by Bharat groups Mangalore. 2. B. NATURE OF BUSINESS CARRIED The business carried on is Multiplex. Pioneering the concept of multiplexes, giving a corporate face to movie making, or introducing the IMAX experience, it has always been Big cinemas first in short, it was never a dull moment for the industry. The Company's principal activities are to provide feature films, television, entertainment and other related services in India. The Company operates in two segments. Commissioned programs include the sale of television serials to channels and Sponsored programs which include the telecasting of television serials on channels. The Big cinemas has not only changed the concept of theaters but also has improved the movie viewing experience for the customers with its latest technological innovation which has made it more fun and safer for the customers.
  • 8. 8 2. C. VISION, MISSION AND QUALITY POLICY Vision The vision of Reliance Big cinemas Entertainment is meeting young India's aspirations and assuming a leadership position in communications, media and entertainment. Mission  The Mission of Reliance Big cinemas is to offer a world class viewing experience to the consumer through a chain of Multiplexes.  To create value for all stake holders.  Grow through innovation.  It is geared to create a significant presence in businesses across various vectors of content, internet, broadcast and retail services and platforms for distribution.  The company strives to create converged services and platforms for masses to access innovative, cutting-edge content which include production and strategic collaboration in areas such as gaming, movies, animation, music, broadcast, DTH and user-generated content, amongst others.  A delightful Movie Experience.  A delightful Work place.  A delightful Community. Quality policy  Reliance Big cinemas are committed to meeting customer requirements through continual improvement of quality management systems.  Reliance Big cinemas shall sustain organizational excellence through visionary leadership and innovative efforts.  To provide the best viewing experience for its customers through chain of multiplexes.  Providing best and the latest movies for its customers.  To provide the latest technological advances to its customers for the best viewing experience.
  • 9. 9 2. D. SERVICE PROFILE Today Big cinemas are the market leader, processing the largest number of Hindi films every year with a record-breaking number of prints. Long-standing business relationships and a technologically advanced facility including a high quality lab for processing raw exposed films, color correction, editing and making multiple prints for final distribution, and a well appointed preview theatres have made us the most sought-after film processing laboratory in India. Currently, Big cinemas enjoys a 70% market share in the Hindi films in the film processing and printing business. Along with films, they continue to focus on quality negative processing for the advertising industry. In 2005, Big cinemas received the prestigious Kodak Image care Program Negative Processing Accreditation. With it, Big cinemas joined an elite club of processing labs in the world recognized for the highest quality and standards in motion picture film handling and processing, and most efficient practices. They have further consolidated their dominant position with numerous other prestigious awards for the quality of film processing. 2E. AREA OF OPERATION Big cinemas are India’s largest cinema chain with about 500 screens spread across India. It also operates in U.S, Mauritius, London and Malaysia. The company is also working towards establishing presence in Netherlands and has associated with PATHE Theatres to begin screening Indian movies. It has a significant presence in the film distribution space with a nationwide presence across India as well as offices in London, New York, Los Angeles and Malaysia. Having been the first cinema chain to cross100 screens and now approaching 600 screens in India, Big cinemas are by far the largest cinema chain in India. Big cinemas' is now considered as world-class cinemas and this is being achieved through a strategy of not only setting up stand-alone properties and cinemas in malls, but also taking over current properties, renovating and operating them, taking advantage of their considerable existing infrastructure and brand value. All in all, plans are underway for a large chain of cinemas in the top 10 cities including Delhi, Kolkata, Hyderabad and Bangalore. It is also looking at ramping up operations in small cities and towns & also northern India and the second phase will include expansion to developing cities and in the year to come, 35 million people are
  • 10. 10 expected to watch a movie on an Big cinemas screen. Bharat Big cinemas situated in Mangalore provides an excellent multiplex experience for the people in and around Mangalore(D.K), Udupi, Madikeri, and Utharakannada District of Karnataka. Its coverage area extends throughout the costal belt of Karnataka. 2. F. OWNERSHIP PATTERN The corporate structure: The Company board of Directors, important executives and other people instrumental to the success of the company. Mr. Anil Ambani, Chairman, Reliance Anil DhirubhaiAmbani Enterprises. Mr. ManmohanShetty, Managing Director, Big cinemas Films Ltd, India. Mr. BalakrishnaShetty, Manager, Big cinemas Films Ltd, Mangalore. Table 2.f Showing ownership pattern of Big cinemas. Ownership % of shares Bharath groups pvt ltd 51% Mr. Anil Ambani, Chairman, Reliance Anil DhirubhaiAmbani Enterprises. 49% 2. G. COMPETITORS INFORMATION INOX: INOX Leisure Limited is the diversification venture of the INOX Group into entertainment and is a subsidiary of Gujarat Flurochemicals Ltd. INOX Leisure's mission is to be the leader in the cinema exhibition industry, in every aspect right from the quality and choice of cinema to the varied services offered and eventually the highest market share. With a view to consolidate its position in the multiplex industry, the Company had acquired 17,565,288 equity shares of Fame Cinemas in February 2010. The Company acquired further 1,075 equity shares
  • 11. 11 of Fame Cinemas in the Open Offer. Subsequent to the completion of the open offer formalities on 6 January 2011, the Company holds 17,566,363 equity shares of Fame representing 50.27% of the issued and paid-up capital of Fame Cinemas. Consequently, Fame Cinemas and its subsidiaries viz. Fame Motion Pictures Limited and Big Pictures Hospitality Services Private Limited have become subsidiaries of the Company with effect from 6 January 2011.INOX has traversed its own path by bringing in a professional and service oriented approach to the cinema exhibition sector. With strong financial backing, impeccable track record and strong corporate ethos, INOX has established a strong presence in the cinema exhibition industry in the short span of a little over eight years since the opening of its first multiplex. INOX currently operates 45 multiplexes and 178 screens in 29 cities making it a truly pan-Indian multiplex chain. Winner of the 'ICICI Entertainment Retailer of the Year' Award 2005, TAAL Multiplexer 2006 and Emerging Super brand of the year 2006 - 2007 Award, INOX Leisure Ltd. will continue its expansion into places like Jodhpur, Ahmedabad, Bhopal, Mangalore, Coimbatore, Kanpur, Hubli, Bhuvaneshwar, etc. Its merger with CCPL 89 Cinemas has given INOX access to an additional 9 multiplexes in West Bengal and Assam. INOX was also chosen post a nationwide tender to design, construct and operate the prestigious multiplex in Goa that hosts the International Film Festival of India. All INOX cinemas have state of the art facilities in terms of modern projection and acoustic systems, interiors of international standards, stadium styled high back seating with cup holder arm-rests, high levels of hygiene, varied theatre food, a selection of Hindi, English and regional movies, computerized ticketing and most importantly high service standards upheld by a young and vibrant team. PVR CINEMAS: PVR Ltd. was incorporated in April 1995 pursuant to a joint venture agreement between Priya Exhibitors Private Limited and Village Road show Limited, one of the largest exhibition companies in the world. PVR pioneered the multiplex revolution in the country by establishing the first multiplex cinema in 1997 at Saket, New Delhi. The opening of the first multiplex heralded a new era in the Indian cinema viewing experience and which also changed the industry forever. From then on PVR initiated many path breaking innovations in the industry from launching in Bangalore the largest 11 screen multiplex in the country in 2004 to introducing Gold Class Cinema. To ramp up presence across the retail entertainment landscape, PVR entered into a JV with Major Cineplex Group in 2008, a leading Film exhibition and retail entertainment company based out of Thailand, to bring lifestyle entertainment concepts to Indian
  • 12. 12 consumers. The Joint Venture enjoined setting up of bowling alleys, karaoke centers, ice skating rinks and gaming zones across the country to enhance the out of home entertainment experience for Indian consumers. Currently, geographically diverse cinema circuit in India consists of 46 Cinemas with 213 screens spread over 27 different cities covering major markets across the length and breadth of the country: Delhi, Faridabad, Gurgaon, Ludhiana, Jalandhar, Ghaziabad, Mumbai, Kolkata, Bangalore, Hyderabad, Chennai, Lucknow, Indore, Aurangabad, Baroda, Allahabad, Ahmedabad, Udaipur, Chandigarh, Surat, Latur, Nanded, Ujjain, Nagpur, Pune, Raipur and Bilaspur. In FY 2011 the PVR brand has been successful in entertaining more than 19 million esteemed patrons across its properties. Today PVR Cinemas contributes 20-25% of domestic box office collections of any leading Hollywood movie and 12-13% of any leading Bollywood movie, highest across the Indian Film Exhibition space. In the last decade and half, PVR Ltd has established itself as India's leading and most premium entertainment company, with presence in the entire value chain with leadership position in Film Exhibition, Distribution and Production. It has also successfully forayed into retail entertainment formats such as bowling Centers with BluO- India's largest 24 lane bowling center which was set up in Gurgaon in 2008. The company also operates a film distribution and production business through PVR Pictures, a 100% subsidiary of PVR Ltd. The company has definite plans to grow multifold over the next 3- 5 years with plans to set up 300 screens and expand to 40 cities from 20 cities at present. The company will continue to provide cinema viewing experience equipped with superior quality ambience, technologically updated systems and best service standards to ensure customer delight and unmatched cinema viewing experience. The company also aims to set up more bowling centers, ice skating rinks and expand its presence in key cities and become a dominant player in the Retail entertainment space at pan India level. CINEMAX: They believe in them that much that they decided to take the movie experience to an entirely new level. Watching the movie they say is only the beginning of the magical experience. They not only flash the best movies ever made on their screens but they ensure that movie buffs view them in style in recliners, massage chairs and customer service fit for a king. They love cinema and so does India. Hence, their launch plans are ambitious and nationwide. They are one of the largest Exhibition theatre chains in India with 39 properties, 138 screens and 33,522 seats. They believe they are one of the dominant players in Mumbai operating with 14 locations which is home to the Hindi Film industry they believe that their brand 'Cinemax' is one
  • 13. 13 of the most recognizable film exhibition brands in the areas where they operate. They have theaters in Ahmedabad, Panipat, Nagpur, Hyderabad, Kolkata, Kanpur, Raipur, Gandhinagar, Mumbai, Thane, Vashi, Cochin, Baroda, Rajkot, Siliguri, Nashik, Delhi, Bangalore, Pune, Surat and coming soon in Chennai and launching additional properties in Pune and Bangalore. They believe in providing customer satisfaction through process enhancements and constant innovation in their services and facilities such as high comfort recliner seating arrangements in 'The Red Lounge', massage chairs, etc. They have conducted many premieres. They can ensure that almost one citizen from any home across the city has visited their premises at some point in time making it the place with the highest footfall, all of them eager to experience their adored idols on the big screen. GOPALAN CINEMAS: Gopalan Enterprises was founded in 1984 by Mr. C.Gopalan, an architect, with the objective of developing and constructing residential apartments in Bangalore. The company has developed some of the finest homes in Bangalore and has the enviable record of having completed all its projects on time. The Group is engaged in the promotion of Residential, Commercial, Shopping Malls, Townships, Special Economic Zones, Software Technology Parks, Biotech Parks, Organic Farms, Educational Institutions, Export of Culinary, Medical Herbs, Star Hotels, and Hospitals etc.They offer 25 years experience building for an astute clientele from around the world. They take pride in the superior craftsmanship and attention to detail given to every project they construct. Their reputation nests on professional management, exceptional product quality, overall affordability and client service through out the building process. Their commitment, integrity, teamwork and professional excellence has continually seen the growth and success of the business since its beginnings in 1984.Gopalan Enterprises bears the stamp of innovative design, superlative quality construction. The Group's commitment to quality construction, modernity in Architectural value; Space Management, Customer satisfaction motto has set up new trend in the building industry. Group has emerged as one of the competitors for promotion of Special Economic Zone generating exports & employment. The group has a giant presence in the Knowledge City with a prestigious global clientele. Gopalan Enterprises brings to a combination of strong professional experience and a commitment to fresh, creative approaches for project planning and design.Their talents have been applied to projects throughout Bangalore City. Gopalan is committed to providing the highest standard of professional service. They are dedicated to the philosophy - Inspired by Life,
  • 14. 14 Built on Trust.Their goal is to assist by planning and designing a facility that meet unique needs. They are supported by talented architects, interior designers, construction administration specialists, technical, marketing, customer support and administrative personnel. CINEPOLIS: When it comes to Cinepolis it is both National as well as Local competitor. Cinepolis is the biggest Cineplex chain in Mexico with 205 theaters in 65 cities and they have become the largest chain in Latin America and the fourth largest in the world with over 230 theaters, 3,000 screens and over 13,000 employees throughout Mexico, Guatemala, El Salvador, Costa Rica, Panama, Colombia, Brazil, Peru, India and the United States.In Mangalore it is located at City Centre mall at Store no: 4, Fourth Floor which has 5 screen including VIP screen digital multiplex, which has a seating capacity of 1200, together with Real D, the world’s best 3D technology, Hollywood standard 2k digital screens and 7.1 Dolby digital audio. After Bangalore, this is the second Cinepolis multiplex in Karnataka. CENTRAL:Central talkies is located at Hampankatta Mangalore. This is one of the oldest local non A/CTheater which has more than 500 seats of 3 categories with Balcony, First Class, and Second Class. The Theater draws more of local audience with the shows of Hindi, Kannada, Tamil, Telugu and Malayalam movies. JYOTHI: Jyothi talkies is located at the center of city near jyothi circle, Balmata Mangalore, it is a single screen theater with more than 350 seats of 3 categories with Balcony, First Class, and Second Class. The movies played are of Hindi, Kannada, Tamil, Telugu, Tulu and Malayalam movies. PRABHATH: PrabhathTheater is located at K.S Raoroad ,Kodialbail Mangalore. It is a single screen theater with more than 300 seats of 3 categories with Balcony, First Class, and Second Class.Various languages movies are played which includes Hindi, Kannada, Tamil, Tulu, Telugu and Malayalam movies. NEW CHITRA: New Chitra Theater is situated at BasavangudiStreet Mangalore. It is a single screen theater with more than 400 seats of 3 categories with Balcony, First Class, and Second Class.The theater draws more of local audience with the shows of English, Hindi, Kannada, Tamil, Telugu and Malayalam movies.
  • 15. 15 ROOPAVANI: Roopavani Theater is situated in Bhavanthistreet Mangalore. It is a single screen theater with more than 350 seats of 3 categories with Balcony, First Class, and Second Class.The Theater draws audience with the shows of Kannada, Tamil, Tulu and Malayalam movies. SUCHITHRA: Suchitra Theater is located at K.S Raoroad ,Kodialbail Mangalore. It is a single screen theater with more than 300 seats of 3 categories with Balcony, First Class, and Second Class.Various languages movies are played which includes Hindi, Kannada, Tamil, Tulu, Telugu and Malayalam movies. PLATINUM: Platinum Theater is located in Falnir Road Mangalore. It is a single screen theater with more than 450 seats of 3 categories with Balcony, First Class, and Second Class.The theater draws more of local audience with the shows of English, Hindi, Kannada, Tamil, Telugu and Malayalam movies. RAMAKANTHI: Ramakanthi Theater is situated in Bhavanthistreet Mangalore. It is a single screen theater with more than 300 seats of 3 categories with Balcony, First Class, and Second Class.Various languages movies are played which includes Hindi, Kannada, Tamil, Tulu, Telugu and Malayalam movies. 2. H. INFRASTRUCTURAL FACILITIES Big cinemas, a division of Reliance Media Works Ltd formerly known as Adlabs Films Limited and a member of Reliance ADA Group is has a theatre chain with over 500 screens in India, US, Malaysia, and the Netherlands. The company accounts for 10 to 15% of box office contributions of large movies. After pioneering the IMAX experience in India, it recently launched 3D and 6D technology and is the only cinema chain to screen films in all three formats. Big cinemas also operates in the United States, and the circuit accounts for about 30-35% of Hindi features box office collections and over 70% of Tamil and Telugu box office collections from the US. In Malaysia, the company now has 66 screens that play Hollywood features as well as Chinese and Tamil films to cater to the 1.5 million Tamil populationsThe cinema viewing experience for Mangaloreans underwent a dramatic change in 2006 - when the first three-screen multiplex started operating in the first mall of the city. Adlabs now Big cinemas multiplex started with three screens and added one more screen a year later. Since then there has not been much of a change in the multiplex scene in the city.
  • 16. 16 2. I. ACHIEVEMENTS /AWARDS Big cinemas have won many awards over the years which include:  ‘Entertainment Retailer of the Year’ honor at the India Retail Forum 2009.  ‘International Exhibitor of the Year 2008’ by CineAsia 2008 at Macau.  Big cinemas’ innovative concept of Cinediner which combines fine dining and movie watching has won the award for Most Admired Innovative Concept of the Year at Images Retail Forum 2010.  Big cinemas have also been awarded the “Multiplex of the Year” at the Franchise India’s Star Retailer Awards, 2012 at New Delhi.  Big cinemas have been awarded the “Retailer of the Year” honor at the Reid & Taylor Awards for Retail Excellence for 2 consecutive years.  South Indian Cinematographers Association Award for “Best Color Laboratory” in Chennai for the year 2007.  Zee Cine Award for Best Film Processing in 2008.  Big cinemas has bagged the trade recognition of being the “Best Cinema Chain for the Year” honor at ZEE ETC Bollywood Business Award 2012 held at Mumbai.
  • 17. 17 2. J. WORK FLOW MODEL    Figure 2.J: Work Flow Model A workflow consists of a sequence of concatenated or connected steps. Emphasis is on the flow paradigm, where each step follows the precedent without delay or gap and ends just before the subsequent step may begin. This concept is related to non overlapping tasks of single resources. Company Subsidiary Branch Branch Franchise Franchise Franchise Satellite Distribution Marketing Operation Booking Screen 1 Screen 2 Screen 3 Screen4 News paper Internet Mall Display Board Back office operation Front office operation Ticket counter Tele booking Internet booking Customer
  • 18. 18 It is a depiction of a sequence of operations, declared as work of a person, a group of persons. Workflow may be seen as any abstraction of real work. For control purposes, workflow may be a view on real work under a chosen aspect, thus serving as a virtual representation of actual work. The flow being described may refer to a document or product that is being transferred from one step to another. an organization of staff, or one or more simple or complex mechanisms. The work flow model starts with the company i.e. Reliance Big cinemas from which the various companies obtains the franchises or even the branches is opened by Big cinemas itself. The franchises will be operating in four areas such as satellite Distribution through which the movies Reaches the theaters and are shown on the various screens, here in case of Bharat Big cinemas there a 4 screens available through which it is reached to the final customers. The other department is marketing which makes customer aware about the movies and offers through various marketing channels such as Newspaper, Internet, and Mall display board. The operation department is classified as Front office and Back office which enables all the operations done at Big cinemas. It also has a booking department which operates for booking of tickets through various mediums such as Tele booking, online booking and also through ticket counters. The final link in the work flow model is the customer of Big cinemas. 2. K. FUTURE GROWTH AND PROSPECTS Bharat Big cinemas have humongous scope for growth in costal region of Karnataka. The competition is intense with many global competitors entering into the market along with established local theaters which are operating at the same level. But Mangalore region developing as educational hub of Karnataka will bring more youths towards Mangalore which is a positive sign for Big cinemas. It can also target the surrounding regions of Mangalore as there is open market without any major companies established Big cinemas can target the surrounding developing regions like Udupi, Moodbidri, Kundapur, Puttur etc. The prospect of the growth for Bharat Big cinemas in Mangalore appears to be positive.
  • 19. 19 3. MCKINSEY 7S FRAMEWORK The McKinsey 7s framework is a management model developed by well known business consultants Robert H. Waterman, Jr. and Tom peters in the 1980s. This was a strategic vision for groups, to include businesses, business units, and teams. The 7s are structure, strategy, systems, skills, style, staff and shared values.McKinsey's frame work provides a useful tool for analyzing the strategic attributes of an organization. These seven are distinguished in so called hard S’s and Soft S’s. The hard elements: Strategy, Structure and System are feasible and easy to identify. The four soft S’s Skills, Staff, Style and shared values however are hardly feasible. Companies in which these soft elements are present more successful at implementation of strategy. Figure 3.a: McKinsey 7s framework
  • 20. 20 The 7-S framework of McKinsey is aValue Based Management model that describes how one can holistically and effectively organize a company. Together these factors determine the way in which a corporation operates. Managers need to take account of all seven of the factors to be sure of successful implementation of a strategy - large or small. They're all interdependent, so if the manager fail to pay proper attention to one of them, it can bring the otherscrashing down. Objective of the model is to analyze how well an organization is positioned to achieve its intended objective. MCKINSEY 7S FRAMEWORK WITH SPECIAL REFERENCE TO BHARATH BIG CINEMAS: 3.1. STRUCTURE: Basis for specialization and co-ordination influenced primarily by strategy and by organization size and diversity. Big cinemas, a division of Reliance Media Works Ltd has a theatre chain with over 500 screens in India, US, Malaysia, and the Netherlands. The company accounts for 10 to 15% of box office contributions of large movies.After pioneering the IMAX experience in India, it recently launched 3D and 6D technology and is the only cinema chain to screen films in all three formats. Bharat Big cinemas werethe first three-screen multiplex started operating in the first mall of the city. Big cinemas multiplex started with three screens and added one more screen a year later. It works with 6 efficient departments comprising of HR department, Marketing Department, Finance Department, PR department, Booking department and finally the maintenance department. The flow of instructions is sent from the top management and is passed to all the other departments. The Marketing and advertisements works are managed by Marketing department, the Recruiting and training of employees are achieved by HR department. There is also the Public Relation Department to handle customer objections and queries.
  • 21. 21 v Figure 3.b: Organization structure Board of directors Human Resource department Mangalore Marketing department Mangalore Division Finance department Mangalore Division Booking department Mangalore Division Maintenance and house keeping department Customer Query /public Relationship department Human Resource department Marketing department Finance department Booking department Customer Query /public Relationship department Maintenance and house keeping department Human Resource department Marketing department Finance department Booking department Customer Query /public Relationship department Maintenance and house keeping department
  • 22. 22 3.2. STRATEGY: Actions a company plans in response to or anticipation of changes in its external environment.  The main strategy which has helped Big cinemas to grow and lead the market is by always keeping the customer’s needs in mind and constantly innovate in the multiplex sector.  To provide the quality service through excellent world class venue for the customers to visit and watch the movies.  Providing fully Air conditioned theaters with cushioned push back seats which has changed the view of whole concept of theaters in and around the globe.  One of the top prioritize strategy of Big cinemas is to attract more youths towards watching movies, Through various offers and combos Big cinemas is attracting the youngsters towards the theaters .  Execute flawlessly and efficient delivery of services every time every day through which the Big cinemas has raised its standards.  Sustain and strengthen the group’s spirit of entrepreneurship taking ownership and accountability for their actions.  Leverage synergies to learn and build on the diverse experiences and skill sets of various businesses and teams.  To create a true meritocracy with a pervasive commitment to transparent systems and processes.  Do all this with unquestionable Integrity to ensure total compliance with the laws of the land.  To engage itself in social activity to ensure it is involved in the welfare of the common people.  To attract more families by providing safer and healthier venues with world class standards.  To shift the peak demand from weekends by introducing offers like Wednesday movies with less/ Fixed ticket prices.  To ease the process of booking tickets through various booking options which consists of Online booking, Ticket counter and Tele Booking.  To provide best viewing experience through Imax and 3D visual presentations which includes better sound clarity and bigger screens.
  • 23. 23 3.3. SYSTEM: Formal and Informal procedures that support the strategy and structure. Systems are more powerful than they are given credit which is performed through:  Growth opportunities to expand leadership capabilities.  True meritocracy and freedom to choose career paths.  Opportunities to develop and enhance leadership and functional capabilities.  An entrepreneurial environment where people can pursue their dreams.  Competitive compensation.  First mover advantage over competitors.  Through a well-defined Rewards & Recognitions program that periodically identifies exceptional individual and team achievers among the various business functions and verticals in the Group which also includes the convention of awarding the Best Employee of the year for the best performance of that year. 3.4. STAFF: The people/human resource management- processes used to develop managers, socialization processes, and ways of shaping basic values of management cadre, ways of introducing young recruits to the company, ways of helping to manage the career of employees.There strong team of professionals is among the youngest in the country, and consists of some of the most dynamic, motivated and qualified individuals to be found anywhere in the world. First rate management graduates, highly trained engineers, top-notch financial analysts and razor sharp accountants they have on their rolls some of the brightest minds in the business. Currently there are  There are 40 employees working in various department such as Marketing, Finance, Human resource etc  The staffs are well Qualified and trained in their respective departments.  Consists motivated employees work towards the customer satisfaction for each turn up’s.
  • 24. 24  Separate employees are allocated for various modes of booking to enhance better transaction of tickets.  Separate trainings are provided for front office and back office staffs.  The company organizes periodic development programs to develop and improve the skill of the staffs.  The staffs are well dressed and are provided with Black pants and Black shirts with Red stripes on the shoulder, they are also provided with the Black caps carrying the logo of Big cinemas.  The staffs appointed are both full time as well as part time for the better flexibility within the organization. 3.5. SKILL: The Distinctive competences-what the company does best, ways of expanding or shifting competences. Skill refers to the organizational dominant capabilities and competencies. Skill are those which are developed over a period of time and are result of interaction of many like the kind of people, type of management style, organization structure and the nature of the work they do. The company is possessing self-sufficiency in technical skills with various competitive advantages such as: o Committed to excellence in quality of service. o Highly trained employees specially trained in the field of customer handling and human resource skills. o Responsive to evolving business needs and challenges in the organization. o Dedicated to uphold the core values of the Group. o To continuously scan the environment review of training programs and design need based to ensure achievement to high level of excellence in consumer satisfaction. o It is this skill and initiative of their workforce that sets them apart from their peers in today’s knowledge-driven economy.
  • 25. 25 3.6. STYLE: More a matter of what managers do than what they say: How do a company’s managers spend their time, what are they focusing attention on, Symbolism- the creation and maintenance or sometimes deconstruction of meaning is a fundamental responsibility of managers.  They always put their employees first. Pride lies in building a company around the idea that work should be challenging and challenge should be fun. The idea being, organizing world's information and make it both useful and universally acceptable by one and all.  Accomplishment of this feat will be done only with people having great aspirations. Reliance Big Entertainment offers the most inspiring work environments on the planet to work with smart people and amazing technology.  A platform to connect with millions of people. They invite the people to join and become a part of their organization – one whose forte is its ethics and values which are in turn reflected in its actions and people practices. 3.7. SHARED VALUES: Guiding concepts, fundamental ideas around which a business is built- must be simple, usually stated at abstract level, have great meaning inside the organization even though outsiders may not see or understand them.  Social Responsibility: Big cinemas believes that organizations, like individuals, depend on the support of the community for their survival and sustenance, and must repay this generosity in the best way they can.  People Care:Big cinemas possess no greater asset than the quality of human capital and no greater priority than the retention, growth and well-being of their vast pool of human talent.  Shareholder Interest: Big cinemas value the trust of shareholders, and keep their interests paramount in every business decision they make, every choice they exercise  Consumer Focus: It is one of the great values of Big cinemas. They rethink every business process, product and service from the standpoint of the consumer – so as to exceed expectations at every touch point
  • 26. 26  Excellence in Execution:Big cinemas believe in excellence of execution – in large, complex projects as much as small everyday tasks. If something is worth doing, it is worth doing well.  Respect for Competition: Big cinemasrespect competition – because there’s more than one way of doing things right. They can learn as much from the success of others as from their own failures.  Proactive Innovation: Big cinemas nurture innovation by breaking silos, encouraging cross- fertilization of ideas & flexibility of roles and functions. They create an environment of accountability, ownership and problem-solving based on participative work ethic and leading-edge research.  Leadership by Empowerment: Big cinemas believe leadership in the new economy is about consensus building, about giving up control; about enabling and empowering people down the line to take decisions in their areas of operation and competence.  Team Work: The whole is greater than the sum of its parts; in rapidly-changing knowledge economy, organizations can prosper only by mobilizing diverse competencies, skill sets and expertise; by imbibing the spirit of “thinking together” -- integration is the rule, escalation is an exception.
  • 27. 27 4. SWOT ANALYSIS STRENGTHS  Big cinemas, a Reliance Group of Company are one of the largest entertainment conglomerates in India.  Big cinemas have a dominant and comprehensive presence in film services: motion picture processing, film restoration, digital mastering, studios and equipment rentals.  It was first of its kind to be set up in Mangalore.  The biggest strong point for the company is the current location at Bharath Mall, Bejai, Mangalore which is considered as the heart of the city.  More families are driven by the standards of Big cinemas.  It caters to the needs of the residents of Mangalore by providing High end visual picture which also includes 3D movies which other local theaters lack.  The company has a strong experience in building and construction. Also, there is a brand of 'Reliance' to be considered.  The company has a premium theatre too. The utilization of this could probably indicate the pricing power for the company.  The main strength of Big cinemas include the Brand name, ambience and service, strong data base, good inter personal relation with customer, trained & qualified staffs. WEAKNESSES  High dependence on distributor for showing films in every theatre and for every film. This gives a very unstable business model when one compares with Big cinemas which are in the other end of the value chain.  Inadequate promotional strategies when compared to its competitors.  Concentration is mainly deliberated towards upper and upper middle income groups.  Existing competition is with Inox, PVR cinemas and Cinepolis. Big cinemas are expected to be the largest player with a strong backward integration. Given this level of competition, efficiency or utilization rate is one of the key parameters for success. There is no strong
  • 28. 28 pricing power with any of these competitors. Given, that they can't reduce the price to a 'non multiplex' rate, the downside pricing to increase volumes is lost too. Also, the competitors are expanding very aggressively. Incase, they are represented in most areas, especially in prime areas, that Big cinemas is operating, this can lead to loss of business. . OPPORTUNITIES  Mangalore being a educational hub with majority of the viewers are youth, the demand for quality viewing experience will be high and will increase in the near future.  There is a big demand for theatres across the country given the poor quality currently in existence across places. Also, most theatres are willing to open in Sec B and C cities and move into small towns too.  They are willing to work on different model for pricing tickets depending on time/day.  Increase in the income level of the people and high discretionary income spent on luxury. THREATS  Success of theatres is movie specific and this can tilt towards failure with poor movie scripts.  Alternate sources of entertainment such as DTH, DVD can lead to lower sales.  Alternate mediums like DTH, DVD or VCDs can become popular making the Business unattractive.  Arrival of global competitors like Cinepolis in Mangalore will affect the existing business.  Various internet sites providing free unauthorized prints of latest movies.
  • 29. 29 5. ANALYSIS OF FINANCIAL STATEMENT A financial statement or financial report is a formal record of the financial activities of a business, person, or other entity. The financial statement provides a summarized view of the financial position and operations of a firm. The analysis of the financial statement is a process of evaluating the relationship between components parts of financial statement in order to obtain a better understanding of the firm’s position and performance. 1. Current Ratio: This ratio is calculated to study the liquidity of a firm. Current ratio is calculated by dividing current assets by current liabilities Current assets .Current Ratio= Current liability Table 5.1: Current Ratio Year Current Assets (Rs in crores) Current Liabilities(Rs in crores) Current Ratio 2008 184.96 208.81 0.89 2009 293.61 152.94 1.92 2010 274.36 238.42 1.15 2011 364.92 260.17 1.40 2012 312.90 598.66 0.52 It indicates that the liquidity position of the company during the financial year 2. Debt-Equity Ratio: These ratios express the relationship between debt and equity. It also indicates what proportion of equity and debt. The company is using to finance its assets. It can be calculated by using the following formula
  • 30. 30 Total Debt .Debt Equity Ratio= Shareholders Equity Table 5.2: Debt-Equity Ratio Year Debt (Rs in crores) Equity(Rs in crores) Debt Equity Ratio 2008 925.59 689.61 1.34 2009 1296.10 524.2 2.47 2010 1892.44 374.78 5.05 2011 1982.41 42.78 46.34 2012 1824.40 -565.63 -3.23 In debt equity ratio, if the ratio is greater than 1, the majority of the company’s assets are financed through debt. If the ratio is less than 1, its assets are primarily financed through equity. Debt-equity ratio of the firm during the financial year 2012 is negative because it includes accumulated losses hence the net worth is also obtained negative. 3. Quick Ratio: Quick Ratio is an indicator of company’s short term liquidity. It measures the ability to use its quick assets to pay its current liability. Quick ratio formula is: Quick Assets .Quick Ratio= or Current Liability Cash+ Marketable securities + Accounts Receivables .Quick Ratio= Current Liability Where, Quick asset= Current asset – inventories Table 5.3: Quick ratio
  • 31. 31 Year Quick asset (Rs in crores) Liability(Rs in crores) Quick Ratio 2008 177.35 208.81 0.85 2009 286.70 152.94 1.87 2010 265.29 238.42 1.11 2011 351.67 260.17 1.35 2012 298.72 598.66 0.58 4. Net Profit Ratio: Net profit margin is a key financial indicator used to asses the profitability of a company. Net profit margin formula is: Net Profit/PAT .Net Profit Ratio= Net Sales Table 5.4: Net profit Ratio Year PAT (Rs in crores) Net Sales (Rs in crores) Quick Ratio 2008 48.01 309.17 0.16 2009 -54.6 662.4 -0.08 2010 -148.52 719.71 -0.21 2011 -330.83 729.07 -0.45 2012 -903.15 1234.41 -0.73 5. Asset Turnover Ratio: Asset turnover ratio is the ratio of company’s sales to its assets. It is an efficiency ratio which tells how successfully the company is using its assets to generate revenue. The Asset Turnover Ratio formula is:
  • 32. 32 Sales Revenue .Asset Turnover Ratio= Total Assets Table 5.5: Asset Turnover Ratio Year PAT (Rs in crores) Net Sales (Rs in crores) Quick Ratio 2008 48.01 309.17 0.16 2009 -54.6 662.4 -0.08 2010 -148.52 719.71 -0.21 2011 -330.83 729.07 -0.45 2012 -903.15 1234.41 -0.73
  • 33. 33 6. LEARNING EXPERIENCE “Purse your goals even in the face of difficulties, and convert adversities into opportunities.”-Mr. DhirubhaiAmbani. It is easier to study the books written by the authors, but very difficult to experience the reality in those books. I had a wonderful experience of the corporate world during the tenure of the project at Bharat Big cinemas, Mangalore. Mr. BalakrishnaShetty, the manager was approachable and he was friendly and encouraging. The positive outlook of the store manager towards the project and its encouragement helped me to boost up my confidence level and to develop a positive attitude towards work life. I also learnt that participative leadership style motivates each and every employee to the great height possible. Respecting each other and encouraging the colleagues at work place contribute towards building a harmonious relationship. I also learnt how the service personnel are trained to handle the customers. Customers are a set of very difficult people to tackle with. Some will be having problem with the show timings and some with the seating arrangements, some need corner seats and some are price sensitive. But my survey related problem was very different. Some customers are approachable and some others were reserved and grumpy, some were busy and some others wanted their privacy. This was making me remember Consumer Behavior subject quite a lot. I also learnt that one cannot satisfy all the customers, because what one likes other may dislike it. So I had to change myself behaving different with different individuals. I also learnt that the marketer needs to have a firm approach towards the customer and opinion of all matters in marketing of goods and services. The industry experience has made me realize that it’s not the individual but the Team effort which pays off at the end, helping each other and cooperating with each other can make the perfidious corporate world into a fun filled and peaceful one. I also learnt that one needs to put in cent percent efforts to get a promotion and it is not the salary alone which matters but the acceptance by others that I am human is very important if one needs to take up a marketing job. These 70 days of practical study has made me understand a lot of marketing aspects along with an exposure of corporate world and I did understand the consumer behavior practically.
  • 35. 35 1. A. GENERAL INTRODUCTION Customer Satisfaction is a must in business. Satisfaction is a person’s feeling of pleasure or disappointment resulting from comparing a product’s perceived performance in relation to his or her expectation. Satisfaction is a function of perceived performance and expectation. If performance falls short of expectation, the customer is dissatisfied. If the performance matches the expectations, the customer is satisfied. If the performance exceeds expectations, the customer is highly satisfied or delighted. Many companies are aiming for high satisfaction because customers who are just satisfied still find it easy to switch when a better offer comes along. The producer's attempts to find out people who will pay for his product and buy them for his own satisfaction from the products while manufactures make decision of the scope for the products, they satisfy consumer wants and needs. Advertisers try to understand basic forces that cost human behavior with in the market. They get such knowledge from psychology and sociology for their desires. This is called consumer behavior, which is used to construct models by which marketing people plan strategies, later on, these are used in advertising campaign. The customer is the theme of all business functions. The purpose of business is to create and retain the customers. If the customers are not satisfied, there are so many other competitors who are waiting for this opportunity. Therefore, the customer should be put at the center of all business activities, cutting across function and hierarchical boundaries. The marketing concept holds that the key to achieving organizational goals consists of being more effective than competitors in integrating marketing activities towards determining satisfying the needs and wants of target customers. Marketing activities should be carried out under a well-thought-out philosophy of efficient, effective, and socially responsible marketing. There are five competing concepts under which organization can choose to conduct their marketing activities. The Production concept, Product concept, Selling/sales concept, marketing concept, and the Social marketing concept. Customer expectation is the perceived value customers seek from the purchase of a good or service. In a competitive marketplace where businesses compete for customers, customer expectations & satisfaction is seen as a key differentiator & increasingly has become a key element of business strategy.
  • 36. 36 Statement of problem A study on Marketing Strategy and Customer Comforts with reference to Bharat Big cinemas. Objectives of the study  To assess the need, requirements & expectations of the customers in order to assess their level of customer satisfaction and also to analyze the marketing strategy used for customer satisfaction.  To measure & prioritize areas where improvement will most affect customer satisfaction.  To measure the effectiveness of different marketing strategies used by the Big cinemas on the customer.  To understand the involvement of the employees in assisting the customers.  To analyze the customer attitude towards various pricing strategies opted by Big cinemas.  To know the attitude, enthusiasm regarding the service provided to customers. To study & identify how the customers are benefitted.  To understand the customer view about the ambience and food& beverages at Big cinemas.  To understand the standard levels of Big cinemas over its Competitors and other local Theaters. Scope of the study  The study will be related to customer comforts and marketing strategy adopted Big cinemas.  The study will help in knowing the extent of customer satisfaction towards Big cinemas.  The study will help to know the improvements that can be brought about in the organization.  The study will help to analyze the effect of current marketing strategies used by the organization.  The study will aid in analyzing the customer attitude towards the various aspects like pricing, booking tickets, social standards, ambience etc at Big cinemas.
  • 37. 37 Research Methodology Research Methodology is a systematical way to solve the research problem. In this, we study various steps that are generally adopted by a researcher in studying his research problem along with the logic behind them. A preliminary exploratory study was administered through the personal interview and mail survey with customers from the city of Mangalore to understand the parameter that could taken up for the structured questionnaire. The research design used was Descriptive in nature. This was done once the parameter was determined and the problem had been narrowed down. The sampling frame consists of the customer of Bharat Big cinemas, Mangalore. The sampling units consist of students, youths, working class and also the Family which had visited Big cinemas. The sample size was 200 respondents but only 174 usable respondents could be analyzed. The sampling method used is non-probability, convenience sampling method. Primary Data: The primary data was collected with the help of Questionnaire, personal interview and through Mail survey with the respondent. The questionnaire was structured with suitable scaling. The most of the questions were close ended and target customers were mostly youth. To analyze statistical tools used are graph and diagrams and excel sheet to analyze the primary data. Secondary Data: The data was collected from the secondary sources like journals, web articles, and reports. Limitations of the Study  In spite of the success of project work certain hindrances were encountered in the course of the study.  The data gathered is just the representative of the universe and the mean may vary when compared to universe.  The period of study was limited for only 10 weeks. The information provided by the respondents may be biased. & Difficulty in covering all the areas and locations, also posed as a constraint.  The period of study is very short and the change in the Marketing strategy with new tactics offers cannot be included in the study.
  • 38. 38 1. B. ANALYSIS AND INTERPRETATION Table 3.1: Showing Frequency of visit Bharat Big cinemas for watching movie Figure 3.1: Showing Frequency of visit Bharat Big cinemas for watching movie Interpretation: The above table and graph depict the frequency of customer visit to Big cinemas Mangalore. Out of 174 respondents about 15% of the respondent visit every week and about 31% of the respondent visit once in a month and 16% visit once in 3 month and 6% of the respondent visit once in a year and 32% of the respondent visit according to their preference of movies. Every week. 15% Once in a month. 31% Once in 3 months. 16% Once in a year. 6% According to your preference of movies. 32% Particulars Respondents Percentage Every week. 26 15 Once in a month. 53 31 Once in 3 months. 28 16 Once in a year. 11 6 According to your preference of movies. 56 32 Total 174 100
  • 39. 39 Table 3.2: Showing frequency of Booking tickets at Bharat Big cinemas Particulars Frequency Percentage Box office (ticket counter). 121 57 Tele booking 32 15 Internet booking 49 23 Others 11 5 Total 213 100 Figure 3.2:Showing frequency of booking tickets at Bharat Big cinemas Interpretation: The above table and graph portray the means through which the customers book their tickets at Big cinemas Mangalore. Out of the entire respondent 57% book their tickets through Box office and about 15% of respondent book their tickets through Tele booking and about 23% of respondent book their tickets through internet booking and about 5% of respondent use other means of booking the tickets. Box office (ticket counter). 57% Tele booking 15% Internet booking 23% Others 5%
  • 40. 40 Table 3.3: Showing opinion about the Location/availability of Ticket counters Figure 3.3: Showing opinion about the Location/availability of Ticket counters Interpretation: The above table and graph represent the view of customers about the location tickets counters at Big cinemas Mangalore. Out of the entire 174 respondent 19 % of respondent rate Excellent and about 33% of the respondent rate it as very good and about 38% of respondent rate as good and about 9% rate it as average and about 1% rate it as poor. Excellent 19% Very good 33% Good 38% Average 9% Poor 1% Particulars Respondent Percentage Excellent 32 19 Very good 58 33 Good 66 38 Average 16 9 Poor 2 1 Total 174 100
  • 41. Table3.4: Showing Information provided by the staff of Bharat price, timings & seating at the ticket counter Particulars Excellent Very good Good Average Poor Total Figure 3.4: Showing Information provided by the staff of Bharat price, timings & seating at the ticket counter Interpretation: The above table and graph symbolize the price, timings & seating at the ticket counter rate Excellent and about 28% of the respondent rate it as very rate as good and about 17% rate it as average and about 2% of the respondent rate it as poor. Good 38% Average 17% 41 Showing Information provided by the staff of Bharat Big cinemas price, timings & seating at the ticket counter Respondent Percentage 27 15 49 28 66 38 29 17 3 2 174 100 Showing Information provided by the staff of Bharat Big cinemas price, timings & seating at the ticket counter The above table and graph symbolize the Information provided by the staff of the price, timings & seating at the ticket counter. Out of the 174 respondent 15 % of respondent rate Excellent and about 28% of the respondent rate it as very good and about 38% of respondent rate as good and about 17% rate it as average and about 2% of the respondent rate it as poor. Excellent 15% Very good 28% Poor 2% Big cinemas about the Big cinemas about the the Information provided by the staff of Big cinemas about . Out of the 174 respondent 15 % of respondent good and about 38% of respondent rate as good and about 17% rate it as average and about 2% of the respondent rate it as poor. Very good 28%
  • 42. 42 Table 3.5: Showing the Prices of tickets at Bharat Big cinemas Particulars Respondent Percentage Economical 16 9 Affordable 63 36 Reasonable 63 36 Expensive 27 16 Very Expensive 5 3 Total 174 100 Figure 3.5: Showing the Prices of tickets at Bharat Big cinemas Interpretation: The above table and graph symbolize the customer attitude towards the price of tickets at Big cinemas Mangalore. Out of the 174 respondent 9% of respondent rate it as Economical and about 36% of the respondent rate it as affordable and about 36% of respondent rate it as Reasonable and about 16% rate it as Expensive and about 3% of the respondent rate it as very expensive. 9% 36%. 36% 16% 3% Economical Affordable Reasonable Expensive Very Expensive Percentage Particulars
  • 43. 43 Table 3.6: Showing the Weekend / peak time pricing at Bharat Big cinemas. Particulars Respondent Percentage Economical 17 10 Affordable 42 24 Reasonable 36 21 Expensive 54 31 Very Expensive 25 14 Total 174 100 Figure 3.6: Showing the Weekend / peak time pricing at Bharat Big cinemas. Interpretation: The above table and graph represent the customer feel about the weekend/peak time pricing of tickets at Big cinemas Mangalore. Out of the 174 respondent 10 % of respondent rate it as Economical and about 24% of the respondent rate it as affordable and about 21% of respondent rate it as Reasonable and about 31% rate it as Expensive and about 14% of the respondent rate it as very expensive. 10% 24% 21% 31% 14% Economical Affordable Reasonable Expensive Very Expensive Particulars Percentage
  • 44. 44 Table 3.7: Representing the online booking in Bharat Big cinemas Particulars Respondents percentage Not convenient 21 12 Time consuming 36 21 Moderate / Neutral 68 39 Easy 40 23 Very easy 9 5 Total 174 100 Figure 3.7: Showing the online booking in Bharat Big cinemas Interpretation: The above table and graph denotes the customer view about the online booking of tickets at Big cinemas Mangalore. Out of the 174 respondent 12 % of respondent feel it as not convenient and about 21% of the respondent feel it as time consuming and about 39% of respondent rate it as moderate and about 23% rate it as easy and about 5% of the respondent rate it as very easy. Not convenient 12% Time consuming 21% Moderate / Neutral 39% Easy 23% Very easy 5%
  • 45. Table 3.8:Representing Tele booking as more convenient than the o tickets at Bharat Big cinemas Figure 3.8: Representing Tele booking as more convenient than the other ways of booking tickets at Bharat Big cinemas Interpretation: The above table and graph depict cinemas Mangalore. Out of 174 respondents about 55% of customers feel that tele booking is more convenient than the other ways of booking tickets a agree with it. Yes 55% Percentage Particulars Respondent Percentage 45 Tele booking as more convenient than the other ways of booking Big cinemas Tele booking as more convenient than the other ways of booking Big cinemas The above table and graph depict the customer view about the tele booking of tickets at Mangalore. Out of 174 respondents about 55% of customers feel that tele booking is more convenient than the other ways of booking tickets and about 45% of respondent does not No 55% 45% Particulars Yes No Total 95 79 174 55 45 100 ther ways of booking Tele booking as more convenient than the other ways of booking the customer view about the tele booking of tickets at Big Mangalore. Out of 174 respondents about 55% of customers feel that tele booking is nd about 45% of respondent does not
  • 46. 46 Table 3.9: Showing Advance booking has given you the following benefits Particulars Frequency Percentage Cost 41 8 Time 93 19 Ease/convenience 78 16 Guaranteed tickets 104 21 Sitting together with family/friends 93 19 Early birds 30 7 Can book any number of tickets 47 10 Total 486 100 Figure 3.9: Showing Advance booking has given you the following benefits Interpretation: The above table and graph denotes the benefits that the customers think he gains through advance booking of tickets at Big cinemas Mangalore. . Out of the 174 respondent 8 % of respondent feels cost as an advantage and about19% of the respondent feels Time as an advantage and about 21% of respondent feels Ease/Convenience as an advantage and about 19% feels the benefits as sitting together with family/friends and about 7% of the respondent feels early birds or 1st viewer opportunity as the advantage and about 10% of the respondent feels that they can book any number of tickets through advance booking. cost 9% Time 19% Ease/convenience 16% Guaranteed tickets 21% Sitting together with family/friends 19% Early birds 6% Can book any number of tickets 10%
  • 47. Table 3.10: Showing Free parking Fee gives an added advantage for Bharat Figure 3.10: Showing Free parking Fee gives an added advantage for Bharat Interpretation: The above table and graph depict cinemas Mangalore. Out of 174 respondents about 68% of customers feel that free parking is an advantage and about 32% of respondent does not agree with it. Yes 68% percentage Particulars Frequency Percentage 47 Free parking Fee gives an added advantage for Bharat Free parking Fee gives an added advantage for Bharat The above table and graph depict the customer view about the Free parking facility at Mangalore. Out of 174 respondents about 68% of customers feel that free parking is an advantage and about 32% of respondent does not agree with it. No 32% Particulars Particulars Yes No Total Frequency 119 55 174 Percentage 68 32 100 Free parking Fee gives an added advantage for Bharat Big cinemas Free parking Fee gives an added advantage for Bharat Big cinemas the customer view about the Free parking facility at Big Mangalore. Out of 174 respondents about 68% of customers feel that free parking is an
  • 48. 48 Table 3.11: Showing the ambience rating of Bharat Big cinemas Particulars Frequency Percentage 1 2 3 4 5 6 7 8 9 10 1 2 3 4 5 6 7 8 9 10 Safety and safety checks 9 6 3 9 18 14 28 33 40 14 5 3 2 5 10 8 16 19 23 8 A/C 4 20 3 3 8 10 30 34 46 16 2 11 1 1 5 6 17 20 26 9 Hygiene 4 6 6 3 16 12 29 38 50 10 2 3 3 2 9 7 17 22 29 6 Snacks 5 10 7 7 14 15 32 31 42 11 3 6 4 4 8 9 18 18 24 6 Beverages 3 12 7 8 21 17 31 23 42 10 2 7 4 5 12 10 18 13 24 6 Odor/Smell 4 6 5 5 15 20 19 35 50 15 2 3 3 3 9 11 11 20 29 9 Waiting longue 15 43 11 13 16 15 25 27 4 6 9 25 6 7 9 9 14 16 2 3 Figure3.11: Showing the ambience rating of Bharat Big cinemas 5% 2% 2% 3% 2% 2% 9%3% 11% 3% 6% 7% 3% 25% 2% 2% 3% 4% 4% 3% 6% 5% 2% 2% 4% 5% 3% 7% 10% 5% 9% 8% 12% 9% 9% 8% 6% 7% 9% 10% 11% 9% 16% 17% 17% 18% 18% 11% 14% 19% 20% 22% 18% 13% 20% 16% 23% 26% 29% 24% 24% 29% 2%8% 9% 6% 6% 6% 9% 3% Safety & safety checks A/C Hygiene Snacks Beverages Odor/ smell Waiting lounge Rank 1 Rank 2 Rank 3 Rank 4 Rank 5 Rank 6 Rank 7 Rank 8 Rank 9 Rank 10
  • 49. 49 Interpretation: The above table and graph denotes the customer view about the exterior safety measures at Big cinemas Mangalore. Out of the 174 respondent 5 % of respondent ranked it as 1out of 10 which means least safety and about 3% of the respondent ranked it as 2 out of 10 and about 2% of respondent ranked it as 3 out of 10 and about 5% of the respondent ranked it as 4 out of 10 and about 10% of the respondent ranked it as 5 out of 10 and about 8% of the respondent ranked it as 6 out of 10 and about 16% of the respondent ranked it as 7 out of 10 and about 19% of the respondent ranked it as 8 out of 10 and about 23% of the respondent ranked it as 9 out of 10 and about 8% of the respondent ranked it as 10 out of 10. The above table and graph denotes the customer view about the Air cooling at Big cinemas Mangalore. Out of the 174 respondent 2% of respondent ranked it as 1out of 10 which means safety and about 11% of the respondent ranked it as 2 out of 10 and about 2% of respondent ranked it as 3 out of 10 and about 2% of the respondent ranked it as 4 out of 10 and about 5% of the respondent ranked it as 5 out of 10 and about 6% of the respondent ranked it as 6 out of 10 and about 17% of the respondent ranked it as 7 out of 10 and about 20% of the respondent ranked it as 8 out of 10 and about 26% of the respondent ranked it as 9 out of 10 and about 9% of the respondent ranked it as 10 out of 10. The above table and graph denotes the customer view about the Hygiene at Big cinemas Mangalore. Out of the 174 respondent 2% of respondent ranked it as 1out of 10 which means least and about 3% of the respondent ranked it as 2 out of 10 and about 3% of respondent ranked it as 3 out of 10 and about 2% of the respondent ranked it as 4 out of 10 and about 9% of the respondent ranked it as 5 out of 10 and about 7% of the respondent ranked it as 6 out of 10 and about 17% of the respondent ranked it as 7 out of 10 and about 22% of the respondent ranked it as 8 out of 10 and about 29% of the respondent ranked it as 9 out of 10 and about 6% of the respondent ranked it as 10 out of 10. The above table and graph denotes the customer view about the Snacks at Big cinemas Mangalore. Out of the 174 respondent 3% of respondent ranked it as 1out of 10 which means least and about 16% of the respondent ranked it as 2 out of 10 and about 4% of respondent ranked it as 3 out of 10 and about 4% of the respondent ranked it as 4 out of 10 and about 8% of
  • 50. 50 the respondent ranked it as 5 out of 10 and about 9% of the respondent ranked it as 6 out of 10 and about 18% of the respondent ranked it as 7 out of 10 and about 18% of the respondent ranked it as 8 out of 10 and about 24% of the respondent ranked it as 9 out of 10 and about 6% of the respondent ranked it as 10 out of 10. The above table and graph denotes the customer view about the Beverages at Big cinemas Mangalore. Out of the 174 respondent 2% of respondent ranked it as 1out of 10 which means least and about 7% of the respondent ranked it as 2 out of 10 and about 4% of respondent ranked it as 3 out of 10 and about 5% of the respondent ranked it as 4 out of 10 and about 12% of the respondent ranked it as 5 out of 10 and about 10% of the respondent ranked it as 6 out of 10 and about 18% of the respondent ranked it as 7 out of 10 and about 13% of the respondent ranked it as 8 out of 10 and about 24% of the respondent ranked it as 9 out of 10 and about 6% of the respondent ranked it as 10 out of 10. The above table and graph denotes the customer view about the odor at Big cinemas Mangalore. Out of the 174 respondent 2% of respondent ranked it as 1out of 10 which means least and about 3% of the respondent ranked it as 2 out of 10 and about 3% of respondent ranked it as 3 out of 10 and about 3% of the respondent ranked it as 4 out of 10 and about 9% of the respondent ranked it as 5 out of 10 and about 11% of the respondent ranked it as 6 out of 10 and about 11% of the respondent ranked it as 7 out of 10 and about 20% of the respondent ranked it as 8 out of 10 and about 29% of the respondent ranked it as 9 out of 10 and about 9% of the respondent ranked it as 10 out of 10. The above table and graph denotes the customer view about the Waiting lounge at Big cinemas Mangalore. Out of the 174 respondent 9% of respondent ranked it as 1out of 10 which means least and about 25% of the respondent ranked it as 2 out of 10 and about 6% of respondent ranked it as 3 out of 10 and about 7% of the respondent ranked it as 4 out of 10 and about 9% of the respondent ranked it as 5 out of 10 and about 9% of the respondent ranked it as 6 out of 10 and about 14% of the respondent ranked it as 7 out of 10 and about 16% of the respondent ranked it as 8 out of 10 and about 2% of the respondent ranked it as 9 out of 10 and about 3% of the respondent ranked it as 10 out of 10.
  • 51. Table 3.12: Showing Safety at Bharat Particulars Secure Safe Average Unsafe Risky Total Figure3.12: Showing Safety at Bharat Interpretation: The above table and graph denotes Mangalore. Out of the 174 respondent 25 % of respondent feel it as secure and about 49% of the respondent feel it as safe and about 18% feel it as unsafe and about 3% of the respondent feel it as risky. Secure Safe 26% 49% percentage 51 howing Safety at Bharat Big cinemas Particulars Respondent Percentage 44 25 85 49 32 18 8 5 5 3 174 100 Showing Safety at Bharat Big cinemas The above table and graph denotes the customer view about the safety measures at . Out of the 174 respondent 25 % of respondent feel it as secure and about 49% of the respondent feel it as safe and about 18% of respondent feel it as moderate/average and about 5% feel it as unsafe and about 3% of the respondent feel it as risky. Safe Average Unsafe Risky 49% 18% 5% 3% particulars the customer view about the safety measures at Big cinemas . Out of the 174 respondent 25 % of respondent feel it as secure and about 49% of the of respondent feel it as moderate/average and about 5%
  • 52. Table 3.13: Showing Seating comforts & Seat layout Bharat Particulars Respondent Excellent 26 Very good 60 Good 60 Average 22 Poor 6 Total 174 Figure 3.13: Showing Seating comforts & Seat layout Bharat Interpretation: The above table and graph represent the view of customers about the layout at Big cinemas Mangalore. Out of the entire 174 respondent 15 % of respondent rate Excellent and about 34% of the respondent rate it as very good and about 34% of respondent rate as good and about 13% rate it as average and about 4% rate it as Excellent Very good 15% 34% percentage 52 Showing Seating comforts & Seat layout Bharat Big cinemas Respondent Percentage 26 15 60 34 60 34 22 13 4 174 100 Showing Seating comforts & Seat layout Bharat Big cinemas The above table and graph represent the view of customers about the Seating comforts & Mangalore. Out of the entire 174 respondent 15 % of respondent rate Excellent and about 34% of the respondent rate it as very good and about 34% of respondent rate as good and about 13% rate it as average and about 4% rate it as poor. Very good Good Average Poor 34% 34% 13% particulars Big cinemas Big cinemas Seating comforts & Seat Mangalore. Out of the entire 174 respondent 15 % of respondent rate Excellent and about 34% of the respondent rate it as very good and about 34% of respondent rate Poor 4%
  • 53. Table 3.14: Showing Interior Odor & Air conditioning Particulars Excellent Very good Good Average Poor Total Figure 3.14: Showing Interior Odor & Air conditioning Interpretation: The above table and graph represent the view of customers about the conditioning at Big cinemas Excellent and about 31% of the respondent rate it as very good and about 44% of respondent rate as good and about 11% rate it as average and about 2% rate it as poor. Excellent Very good 12% 31% percentage 53 Showing Interior Odor & Air conditioning Respondent Percentage 22 12 54 31 76 44 19 11 3 2 174 100 Showing Interior Odor & Air conditioning The above table and graph represent the view of customers about the interior Odor & Air Big cinemas Mangalore. Out of the 174 respondent 12 % of respondent rate Excellent and about 31% of the respondent rate it as very good and about 44% of respondent rate as good and about 11% rate it as average and about 2% rate it as poor. Very good Good Average Poor 31% 44% 11% particulars interior Odor & Air Mangalore. Out of the 174 respondent 12 % of respondent rate Excellent and about 31% of the respondent rate it as very good and about 44% of respondent rate Poor 2%
  • 54. Table 3.15: Showing Quality Particulars Excellent Very good Good Average Poor Total Figure 3.15: Showing Quality and hygiene of food & beverages at Bharat Interpretation: The above table and graph symbolize the view of customers about the food & beverages at Big cinemas Excellent and about 26% of the respondent ra as good and about 14% rate it as average and about 6% rate it as poor. Good 38% Average 14% 54 Showing Quality and hygiene of food & beverages at Bharat Respondent Percentage 27 16 45 26 66 38 25 14 11 6 174 100 Showing Quality and hygiene of food & beverages at Bharat The above table and graph symbolize the view of customers about the quality and hygiene of Big cinemas Mangalore. Out of the 174 respondent 16 % of respondent rate Excellent and about 26% of the respondent rate it as very good and about 38% of respondent rate as good and about 14% rate it as average and about 6% rate it as poor. Excellent 16% Very good 26% Poor 6% and hygiene of food & beverages at Bharat Big cinemas Showing Quality and hygiene of food & beverages at Bharat Big cinemas quality and hygiene of Mangalore. Out of the 174 respondent 16 % of respondent rate te it as very good and about 38% of respondent rate Very good 26%
  • 55. Table 3.16: Showing Variety of food items & Particulars Numerous variety Several variety Fewer variety Limited variety No variety Total Figure 3.16: Showing Variety of food items & Interpretation: The above table and graph signify the view of beverages available in the Cafe respondent feels it has numerous varieties and about 34% of the respondent feels it has several variety and about 29% of respondent feels it has fewer variety and about 24% feels it has limited variety and about 5% of respondents feels it has No variety. Numerous variety Several variety Fewer variety Limited variety No variety particulars 55 Showing Variety of food items & beverages available in the Cafe Respondent Percentage 13 8 59 34 51 29 42 24 9 5 174 100 Showing Variety of food items & beverages available in the Cafe The above table and graph signify the view of customers about the variety of food items & beverages available in the Cafe at Big cinemas Mangalore. Out of the 174 respondent 8 % of respondent feels it has numerous varieties and about 34% of the respondent feels it has several respondent feels it has fewer variety and about 24% feels it has limited variety and about 5% of respondents feels it has No variety. 8% 24% 5% percentage beverages available in the Cafe beverages available in the Cafe variety of food items & Mangalore. Out of the 174 respondent 8 % of respondent feels it has numerous varieties and about 34% of the respondent feels it has several respondent feels it has fewer variety and about 24% feels it has limited 34% 29%
  • 56. Table 3.17: Showing Prices of food & combos provided Particulars Economical Affordable Reasonable Expensive Very Expensive Total Figure 3.17:Showing Prices of food & combos provided Interpretation: The above table and graph represent provided at Big cinemas Mangalore Economical and about 21% of the respondent rate it as affordable and about 31% of respondent rate it as Reasonable and about 29% rate it as Expensive and about 10% of the respondent as very expensive Economical Affordable 8% 21% percentage particulars 56 Showing Prices of food & combos provided Respondent Percentage 13 8 36 21 53 31 48 29 18 11 174 100 Showing Prices of food & combos provided The above table and graph represent the customer feel about the prices of food & combos Mangalore. Out of the 174 respondent 8 % of respondent rate it as Economical and about 21% of the respondent rate it as affordable and about 31% of respondent rate it as Reasonable and about 29% rate it as Expensive and about 10% of the respondent Affordable Reasonable Expensive Very Expensive 21% 31% 29% 11% particulars the customer feel about the prices of food & combos . Out of the 174 respondent 8 % of respondent rate it as Economical and about 21% of the respondent rate it as affordable and about 31% of respondent rate it as Reasonable and about 29% rate it as Expensive and about 10% of the respondent rate it Very Expensive 11%
  • 57. Table 3.18: Showing Quantity and taste of food served Particulars Excellent Very good Good Average Poor Total Figure 3.18: Showing Quantity and taste of food served Interpretation: The above table and graph symbolize the view of customers about the served at Big cinemas Mangalore. Out of the 174 respondent 10 % of respondent rate Excellent and about 18% of the respondent rate it as very good and about 45% of respondent rate as good and about 22% rate it as average and about 5% rate it as poor. Excellent Very good Good Average Poor 5% particulars 57 Showing Quantity and taste of food served Respondent Percentage 18 10 32 18 78 45 38 22 8 5 174 100 Showing Quantity and taste of food served The above table and graph symbolize the view of customers about the quantity and taste of food Mangalore. Out of the 174 respondent 10 % of respondent rate Excellent out 18% of the respondent rate it as very good and about 45% of respondent rate as good and about 22% rate it as average and about 5% rate it as poor. 10% 18% 22% percentage quantity and taste of food Mangalore. Out of the 174 respondent 10 % of respondent rate Excellent out 18% of the respondent rate it as very good and about 45% of respondent rate as good 45%
  • 58. Table 3.19: Showing Hygiene and cleanliness maintained in wash room Figure3.19: Showing Hygiene and cleanliness maintained in wash room Interpretation: The above table and graph signify the view of customers about maintained in wash room at respondent rate Excellent and about 25% of the respondent rate it as very good and about 15% of respondent rate as good and about 17% rate it a Excellent Very good Good Average Poor particulars percentage Particulars Excellent Very good Good Average Poor Total 58 Showing Hygiene and cleanliness maintained in wash room Showing Hygiene and cleanliness maintained in wash room The above table and graph signify the view of customers about the hygiene and cleanliness maintained in wash room at Big cinemas Mangalore. Out of the 174 respondent 31 % of respondent rate Excellent and about 25% of the respondent rate it as very good and about 15% of respondent rate as good and about 17% rate it as average and about 12 % rate it as poor. 31% 25% 15% 17% 12% percentage Respondent Percentage 53 31 43 25 27 15 30 17 21 12 174 100 hygiene and cleanliness Mangalore. Out of the 174 respondent 31 % of respondent rate Excellent and about 25% of the respondent rate it as very good and about 15% of s average and about 12 % rate it as poor.
  • 59. Table 3.20: Showing Advertisement medium to know the movies being played of that week Particulars Newspaper Internet Family/friends Mall display boards Movie advertisement Total Figure 3.20: Showing Advertisement medium to know the movies being played of that week Interpretation: The above table and graph denotes movies played at Big cinemas Newspaper Advertisement comes to know about the movies being played of that week and about 23% of the respondent through Internet Advertisement comes to know about the movies being played of that week and about 16% of respondent through Family/Friends comes to know about the movies being played of that week and about 15% respondent through mall display board Advertisement comes to know about the movies being played of that week and abou respondent through Movie Advertisement comes to know about the movies being played of that week. Newspaper Internet Family/friends Mall display boards Movie advertisement particulars 59 Showing Advertisement medium to know the movies being played of that week Frequency Percentage 122 36 79 23 53 16 Mall display boards 51 15 Movie advertisement 34 10 339 100 Showing Advertisement medium to know the movies being played of that week The above table and graph denotes the mode in which customers comes to know about the cinemas Mangalore. Out of the 174 respondent 36 % of respondent through Newspaper Advertisement comes to know about the movies being played of that week and about 23% of the respondent through Internet Advertisement comes to know about the movies being yed of that week and about 16% of respondent through Family/Friends comes to know about the movies being played of that week and about 15% respondent through mall display board Advertisement comes to know about the movies being played of that week and abou respondent through Movie Advertisement comes to know about the movies being played of that 23% 16% 15% 10% percentage Showing Advertisement medium to know the movies being played of that week Showing Advertisement medium to know the movies being played of that week the mode in which customers comes to know about the . Out of the 174 respondent 36 % of respondent through Newspaper Advertisement comes to know about the movies being played of that week and about 23% of the respondent through Internet Advertisement comes to know about the movies being yed of that week and about 16% of respondent through Family/Friends comes to know about the movies being played of that week and about 15% respondent through mall display board Advertisement comes to know about the movies being played of that week and about 10% of the respondent through Movie Advertisement comes to know about the movies being played of that 36%
  • 60. Table 3.21: Showing whether customers go to other theaters to watch the movies If you don’t get tickets at Bharat Particulars Frequency Percentage Figure 3.21: Showing whether customers go to other theaters to Watch the movies If you don’t get tickets at Bharat Big cinemas Interpretation: The above table and graph depict tickets are not available at Big cinemas customers visit other theaters and about 11% of respondent do not visit other Yes No 11% particulars 60 Showing whether customers go to other theaters to watch the movies If you don’t get tickets at Bharat Big cinemas Yes No Total 154 20 174 89 11 100 Showing whether customers go to other theaters to Watch the movies If you Big cinemas The above table and graph depict the customer opinion about visiting to other Theaters if the Big cinemas Mangalore. Out of 174 respondents about 89% of customers visit other theaters and about 11% of respondent do not visit other 89% percentage Showing whether customers go to other theaters to watch the movies If you Showing whether customers go to other theaters to Watch the movies If you the customer opinion about visiting to other Theaters if the Mangalore. Out of 174 respondents about 89% of customers visit other theaters and about 11% of respondent do not visit other theaters.
  • 61. 61 Table 3.22: Representing the customer preference to opt for other movies if they don’t get the tickets for the movies of their choice Particulars Yes No Total Respondent 106 68 174 Percentage 61 39 100 Figure 3.22: Representing the customer preference to opt for other movies if they don’t get the tickets for the movies of their choice Interpretation: The above table and graph depict the customer opinion about watching other movies if they do not get tickets for the movies of their choice at Big cinemas Mangalore. Out of 174 respondents about 61% of customers watch other movies and about 39% of respondent do not watch any other movie for that visit Yes 61% No 39%
  • 62. 62 Table 2.23: Showing the screen size of Bharat Big cinemas compared to the Local theaters Particulars Respondent Percentage Excellent 29 17 Very good 65 37 Good 60 34 Average 17 10 Poor 3 2 Total 174 100 Figure 2.23:Showing the screen size of Bharat Big cinemas compared to the Local theaters Interpretation: The above table and graph signify the view of customers about the screen size atBig cinemas Mangalore. Out of the 174 respondent 17 % of respondent rate Excellent and about 37% of the respondent rate it as very good and about 34% of respondent rate as good and about 10% rate it as average and about 2 % rate it as poor. Excellent 17% Very good 37% Good 34% Average 10% Poor 2%
  • 63. 63 Table 2.24: Represents Sound & Picture quality RATINGS: 1 2 3 4 5 6 7 8 9 10 Particulars Frequency Percentage 1 2 3 4 5 6 7 8 9 10 1 2 3 4 5 6 7 8 9 10 Picture Clarity 6 7 4 4 10 17 23 52 32 20 3 4 2 2 6 10 13 30 18 11 Sound Clarity 5 7 5 4 10 16 23 44 45 15 3 4 3 2 6 9 13 25 26 9 Screen size 6 7 5 4 12 11 19 49 47 14 3 4 3 2 7 6 11 28 27 8 Brightness 4 7 5 3 12 16 22 44 44 17 2 4 3 2 7 9 13 25 25 10 Sharpness 3 7 6 4 7 18 22 49 40 18 2 4 3 2 4 10 13 28 23 10 Figure 2.24:Represents Sound & Picture quality 3% 3% 3% 2% 2% 4% 4% 4% 4% 4% 2% 3% 3% 3% 3% 2% 2% 2% 2% 2% 6% 6% 7% 7% 4% 10% 9% 6% 9% 10% 13% 13% 11% 13% 13% 30% 25% 28% 25% 28% 18% 26% 27% 25% 23% 11% 9% 8% 10% 10% Picture clarity Sound clarity Screen size Brightness Sharpness of picture Rank 1 Rank 2 Rank 3 Rank 4 Rank 5 Rank 6 Rank 7 Rank 8 Rank 9 Rank 10
  • 64. 64 Interpretation: The above table and graph denotes the customer view about the Picture Quality at Big cinemas Mangalore. Out of the 174 respondent 3% of respondent ranked it as 1out of 10 which means least and about 4% of the respondent ranked it as 2 out of 10 and about 2% of respondent ranked it as 3 out of 10 and about 2% of the respondent ranked it as 4 out of 10 and about 6% of the respondent ranked it as 5 out of 10 and about 10% of the respondent ranked it as 6 out of 10 and about 13% of the respondent ranked it as 7 out of 10 and about 30% of the respondent ranked it as 8 out of 10 and about 18% of the respondent ranked it as 9 out of 10 and about 11% of the respondent ranked it as 10 out of 10. The above table and graph denotes the customer view about the sound clarity at Big cinemas Mangalore. Out of the 174 respondent 3% of respondent ranked it as 1out of 10 which means least and about 4% of the respondent ranked it as 2 out of 10 and about 3% of respondent ranked it as 3 out of 10 and about 2% of the respondent ranked it as 4 out of 10 and about 6% of the respondent ranked it as 5 out of 10 and about 9% of the respondent ranked it as 6 out of 10 and about 13% of the respondent ranked it as 7 out of 10 and about 25% of the respondent ranked it as 8 out of 10 and about 26% of the respondent ranked it as 9 out of 10 and about 9% of the respondent ranked it as 10 out of 10. The above table and graph denotes the customer view about the Screen size at Big cinemas Mangalore. Out of the 174 respondent 3% of respondent ranked it as 1out of 10 which means least and about 4% of the respondent ranked it as 2 out of 10 and about 3% of respondent ranked it as 3 out of 10 and about 2% of the respondent ranked it as 4 out of 10 and about 7% of the respondent ranked it as 5 out of 10 and about 6% of the respondent ranked it as 6 out of 10 and about 11% of the respondent ranked it as 7 out of 10 and about 28% of the respondent ranked it as 8 out of 10 and about 27% of the respondent ranked it as 9 out of 10 and about 8% of the respondent ranked it as 10 out of 10. The above table and graph denotes the customer view about the Brightness at Big cinemas Mangalore. Out of the 174 respondent 2% of respondent ranked it as 1out of 10 which means least and about 4% of the respondent ranked it as 2 out of 10 and about 3% of respondent ranked it as 3 out of 10 and about 2% of the respondent ranked it as 4 out of 10 and about 7% of the