Download as PDF, PPTX


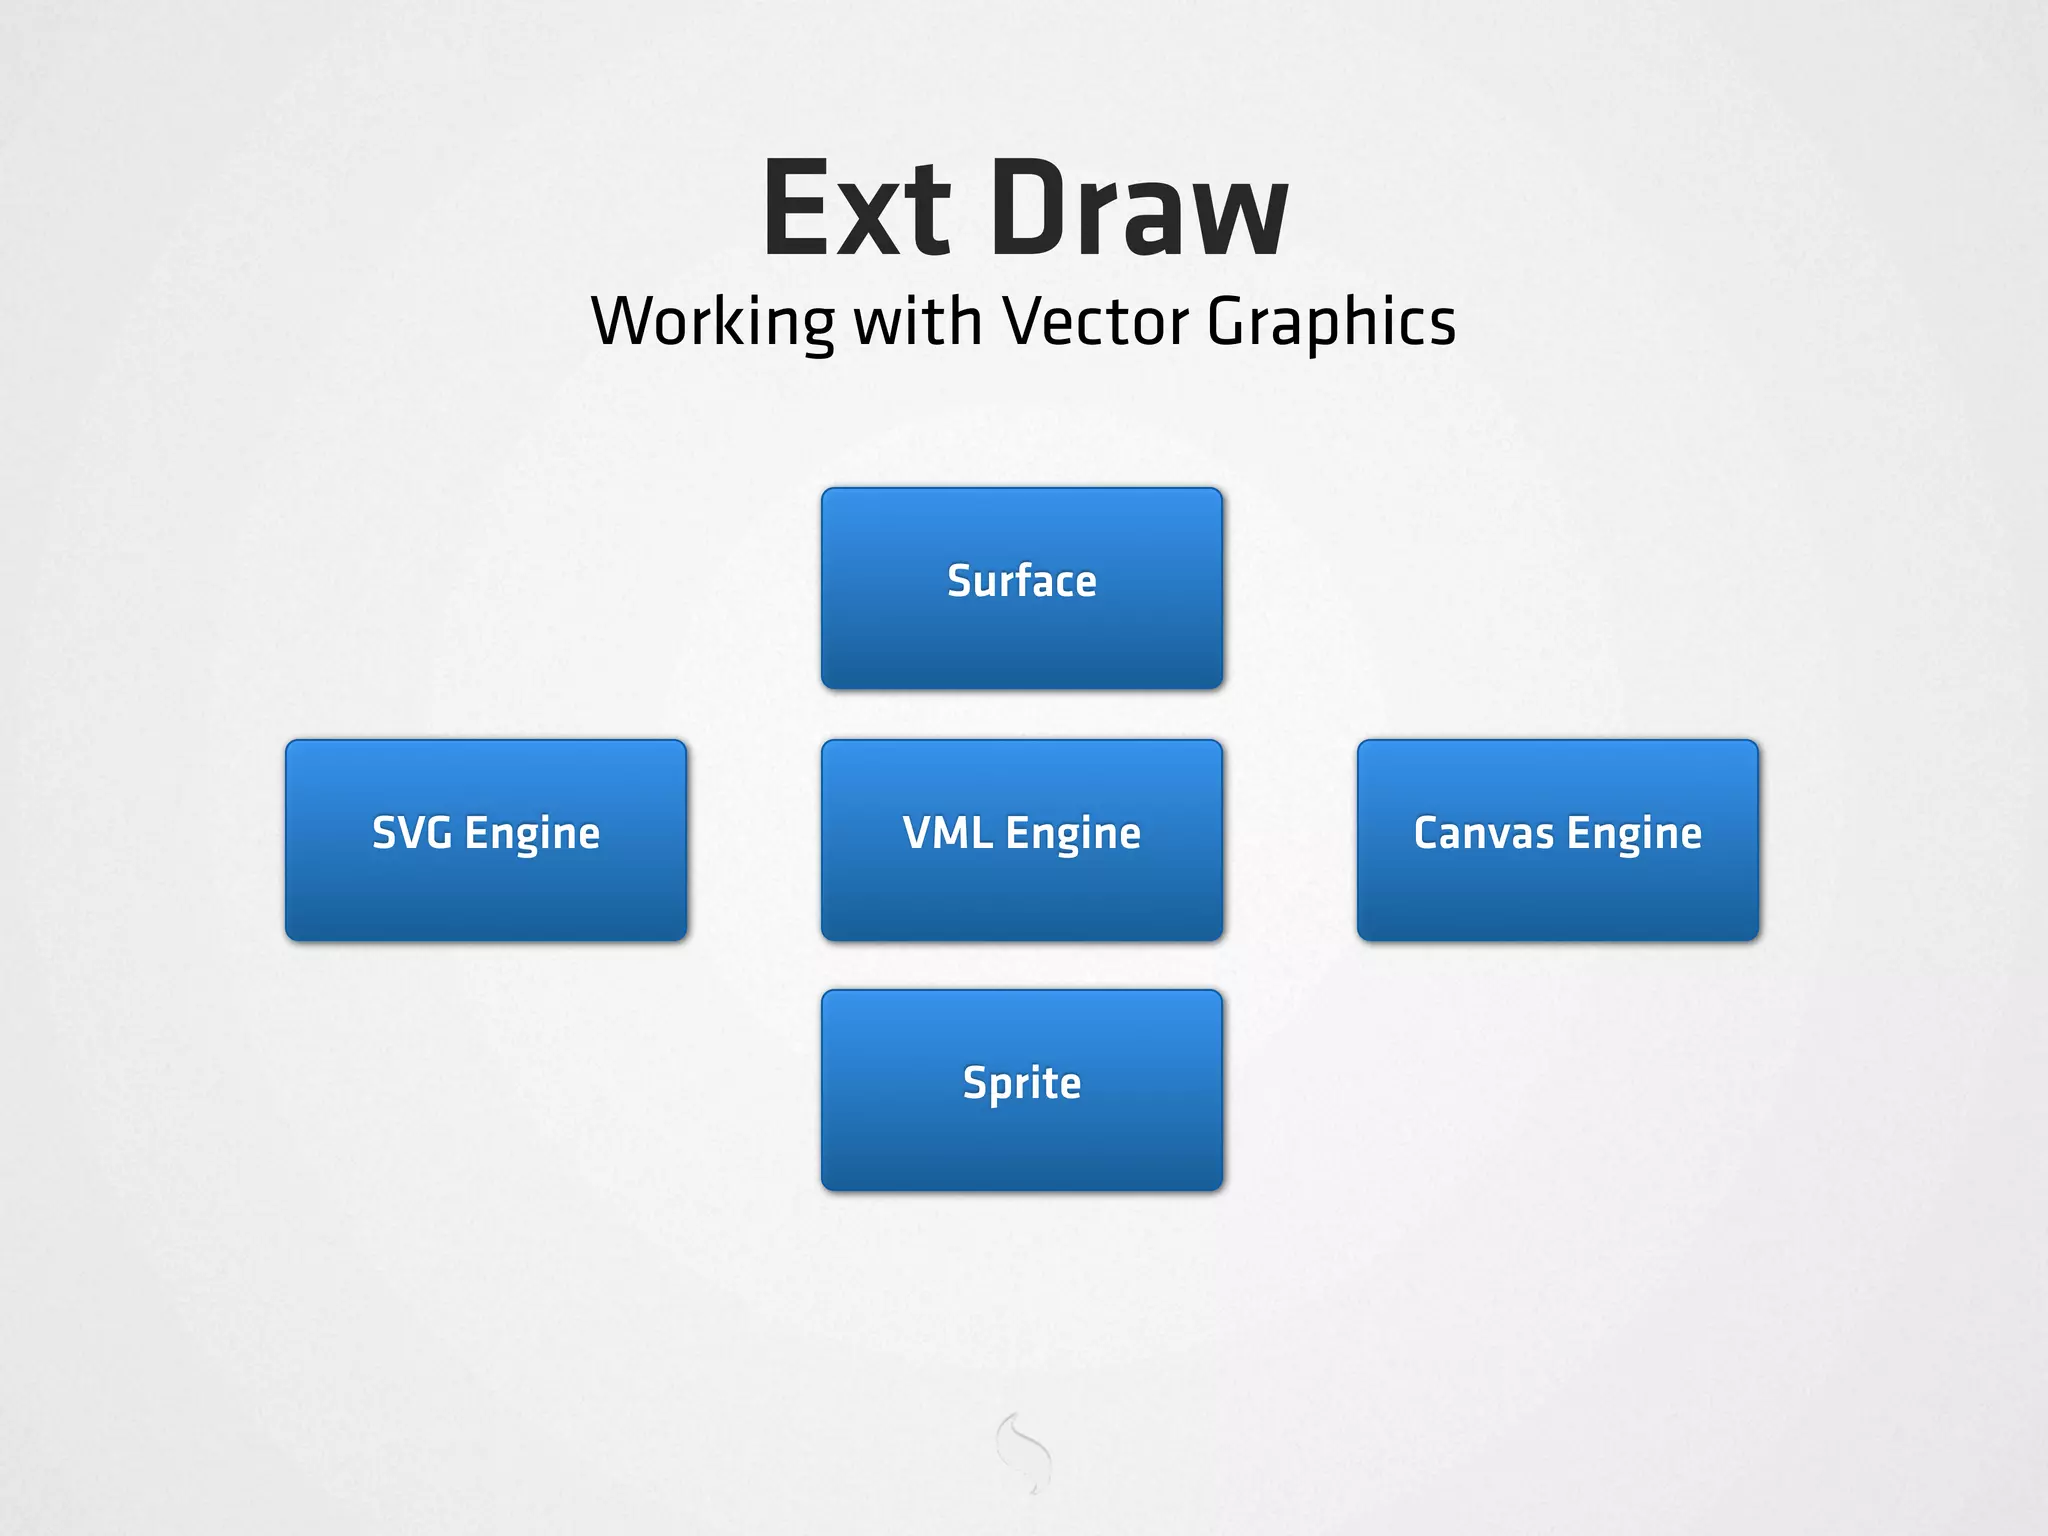
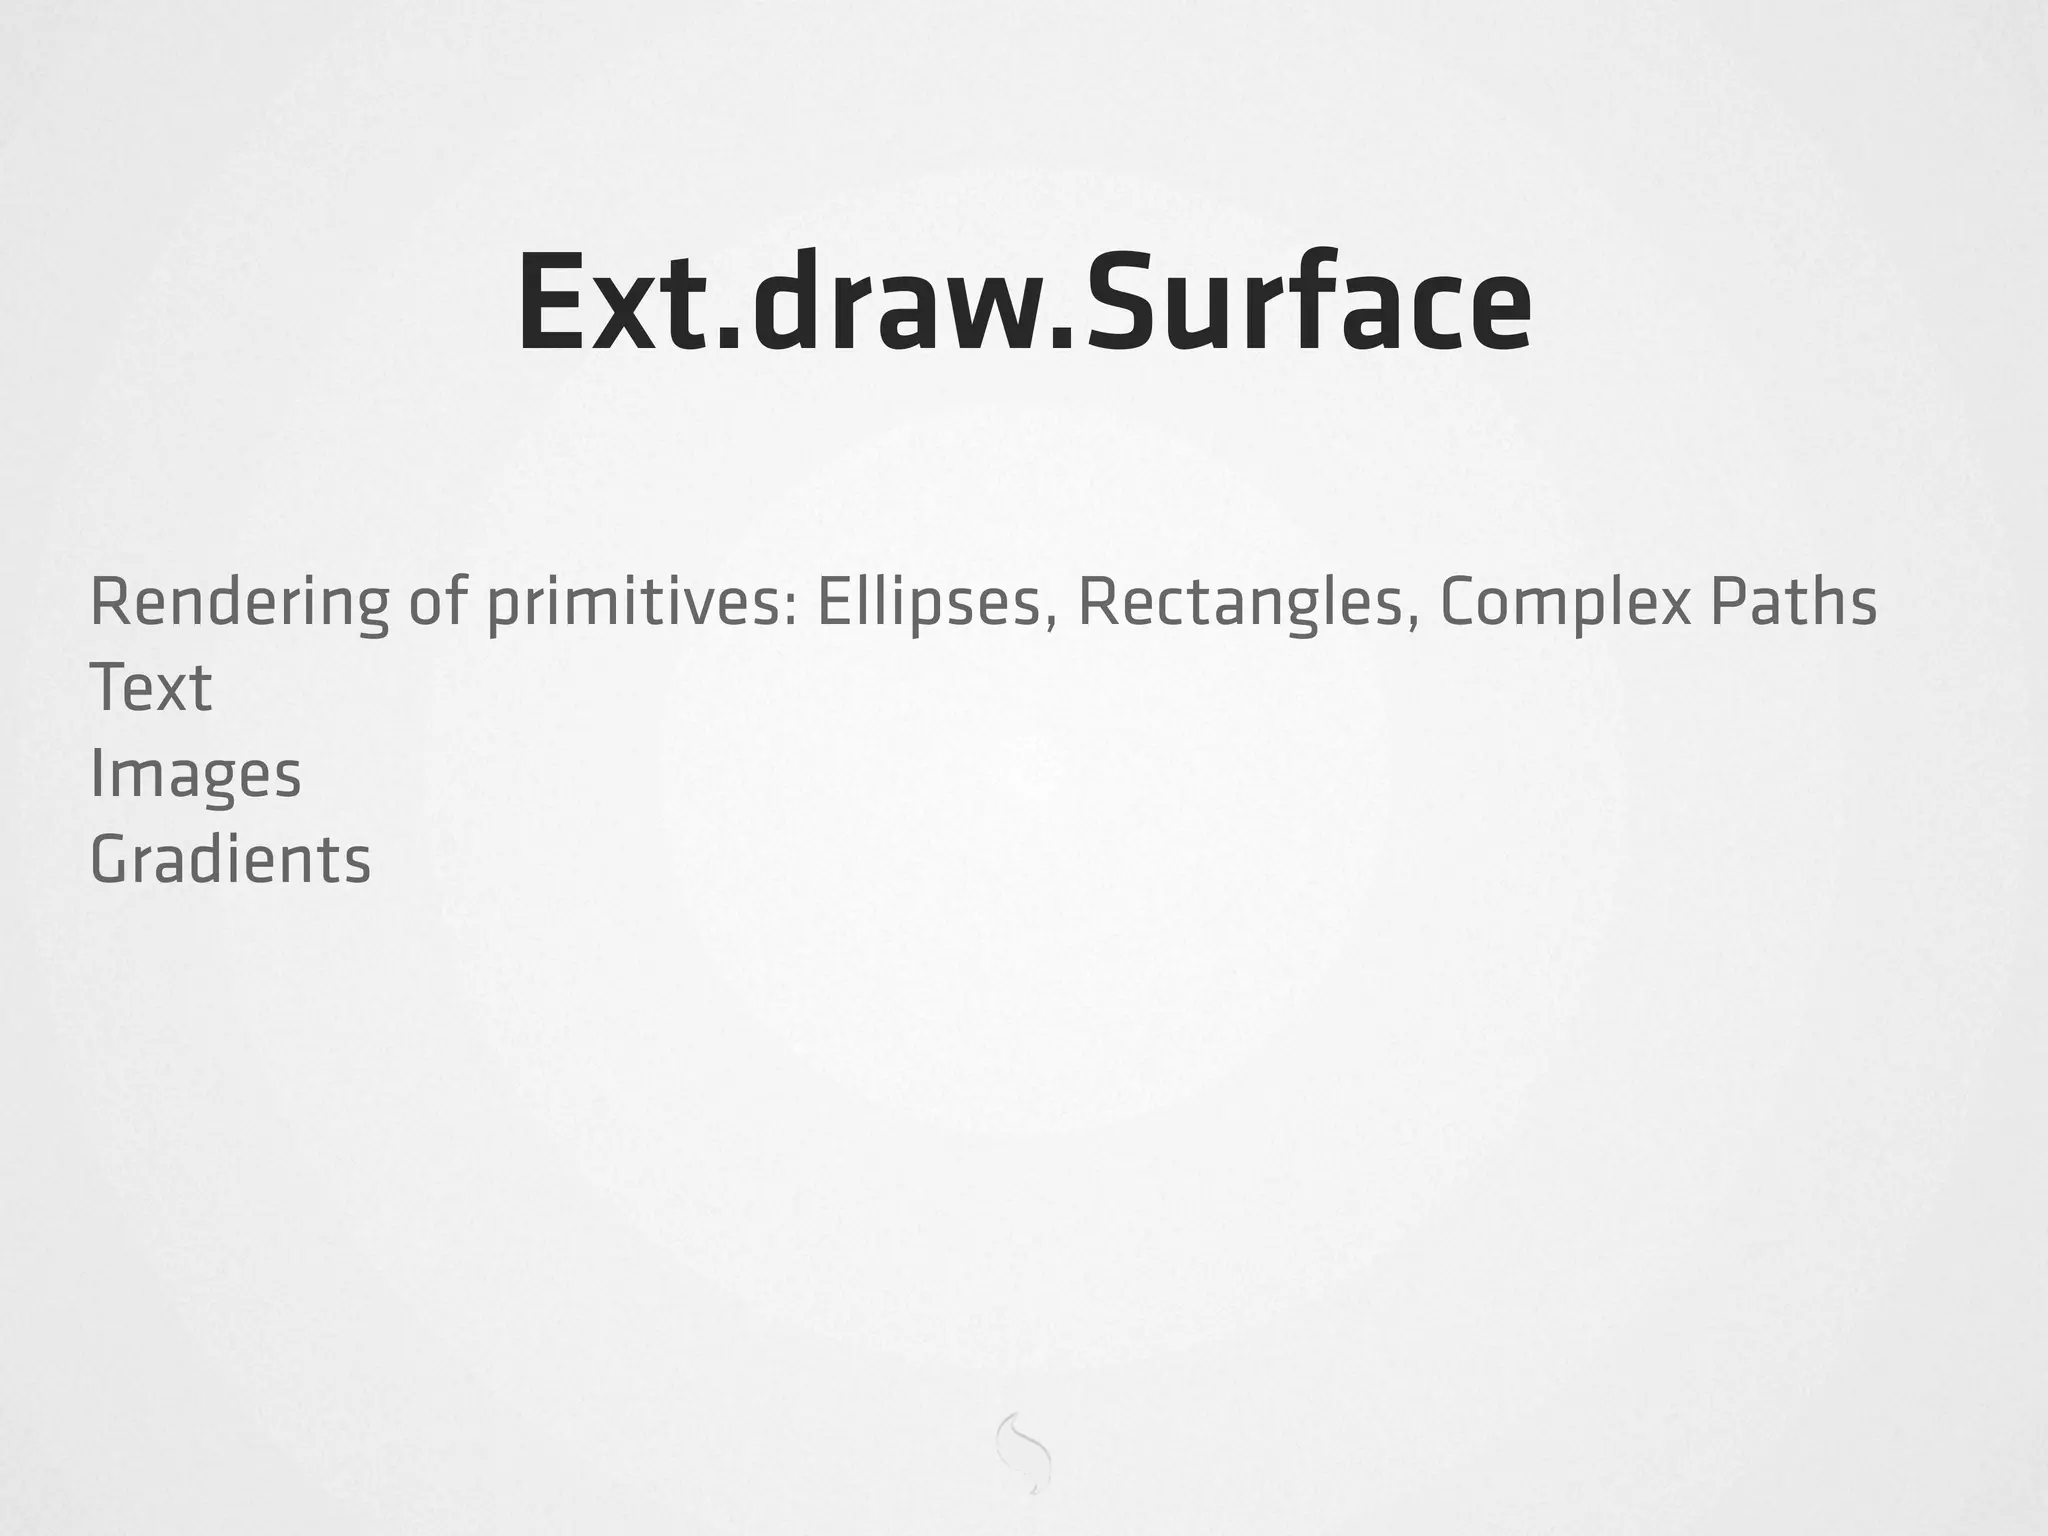
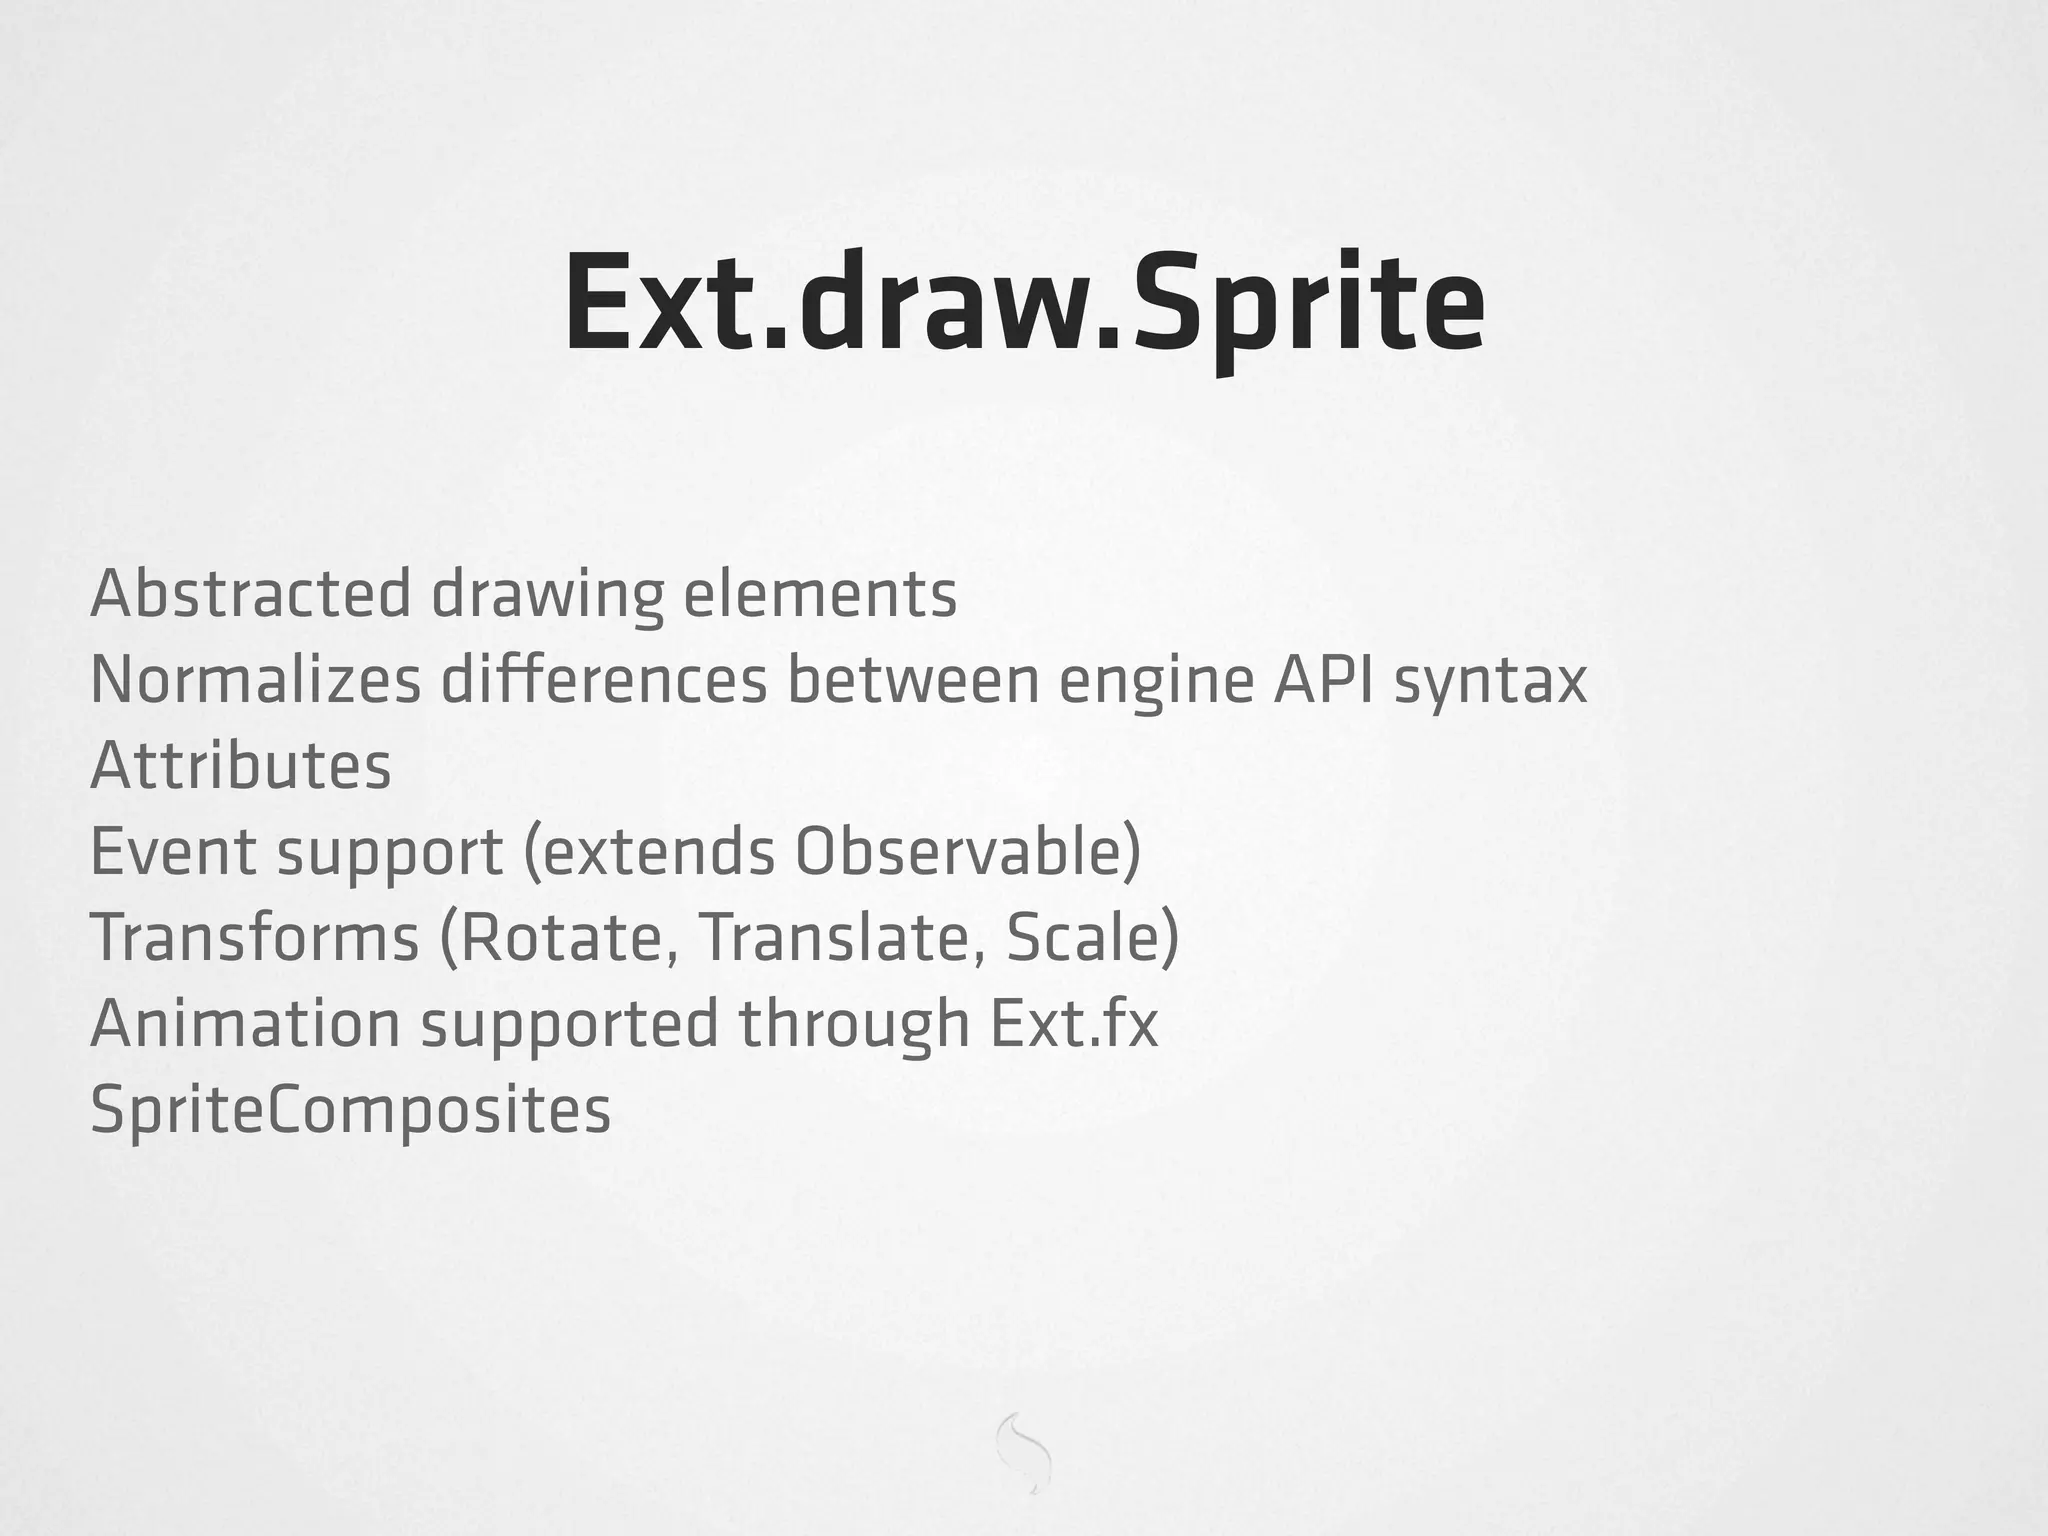
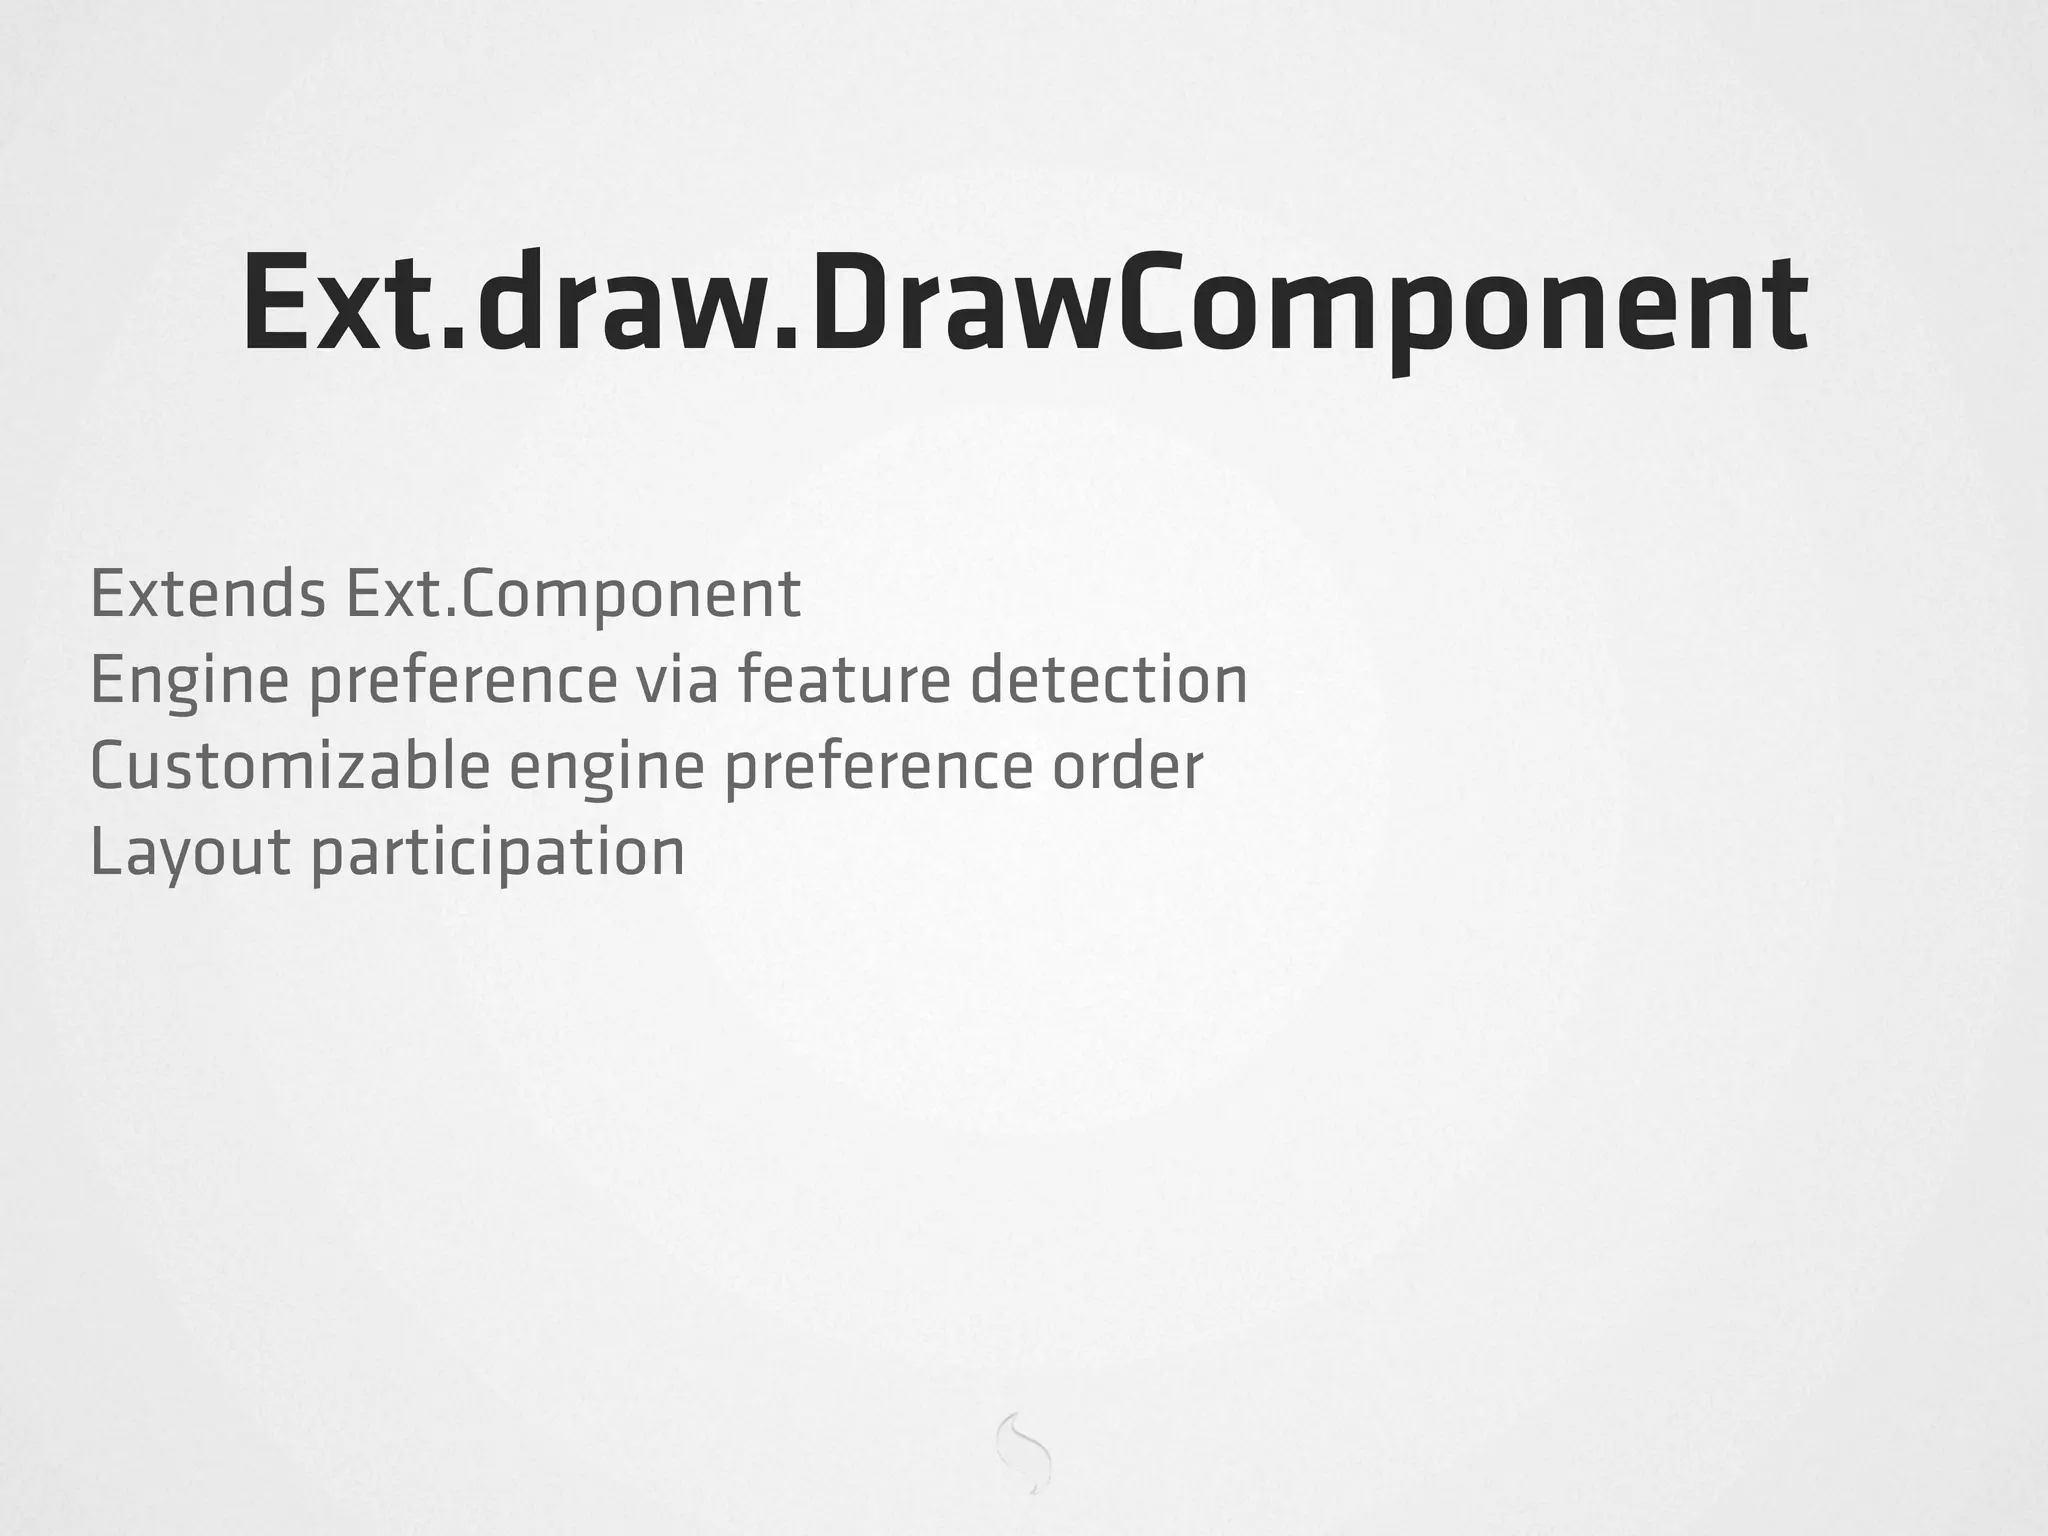
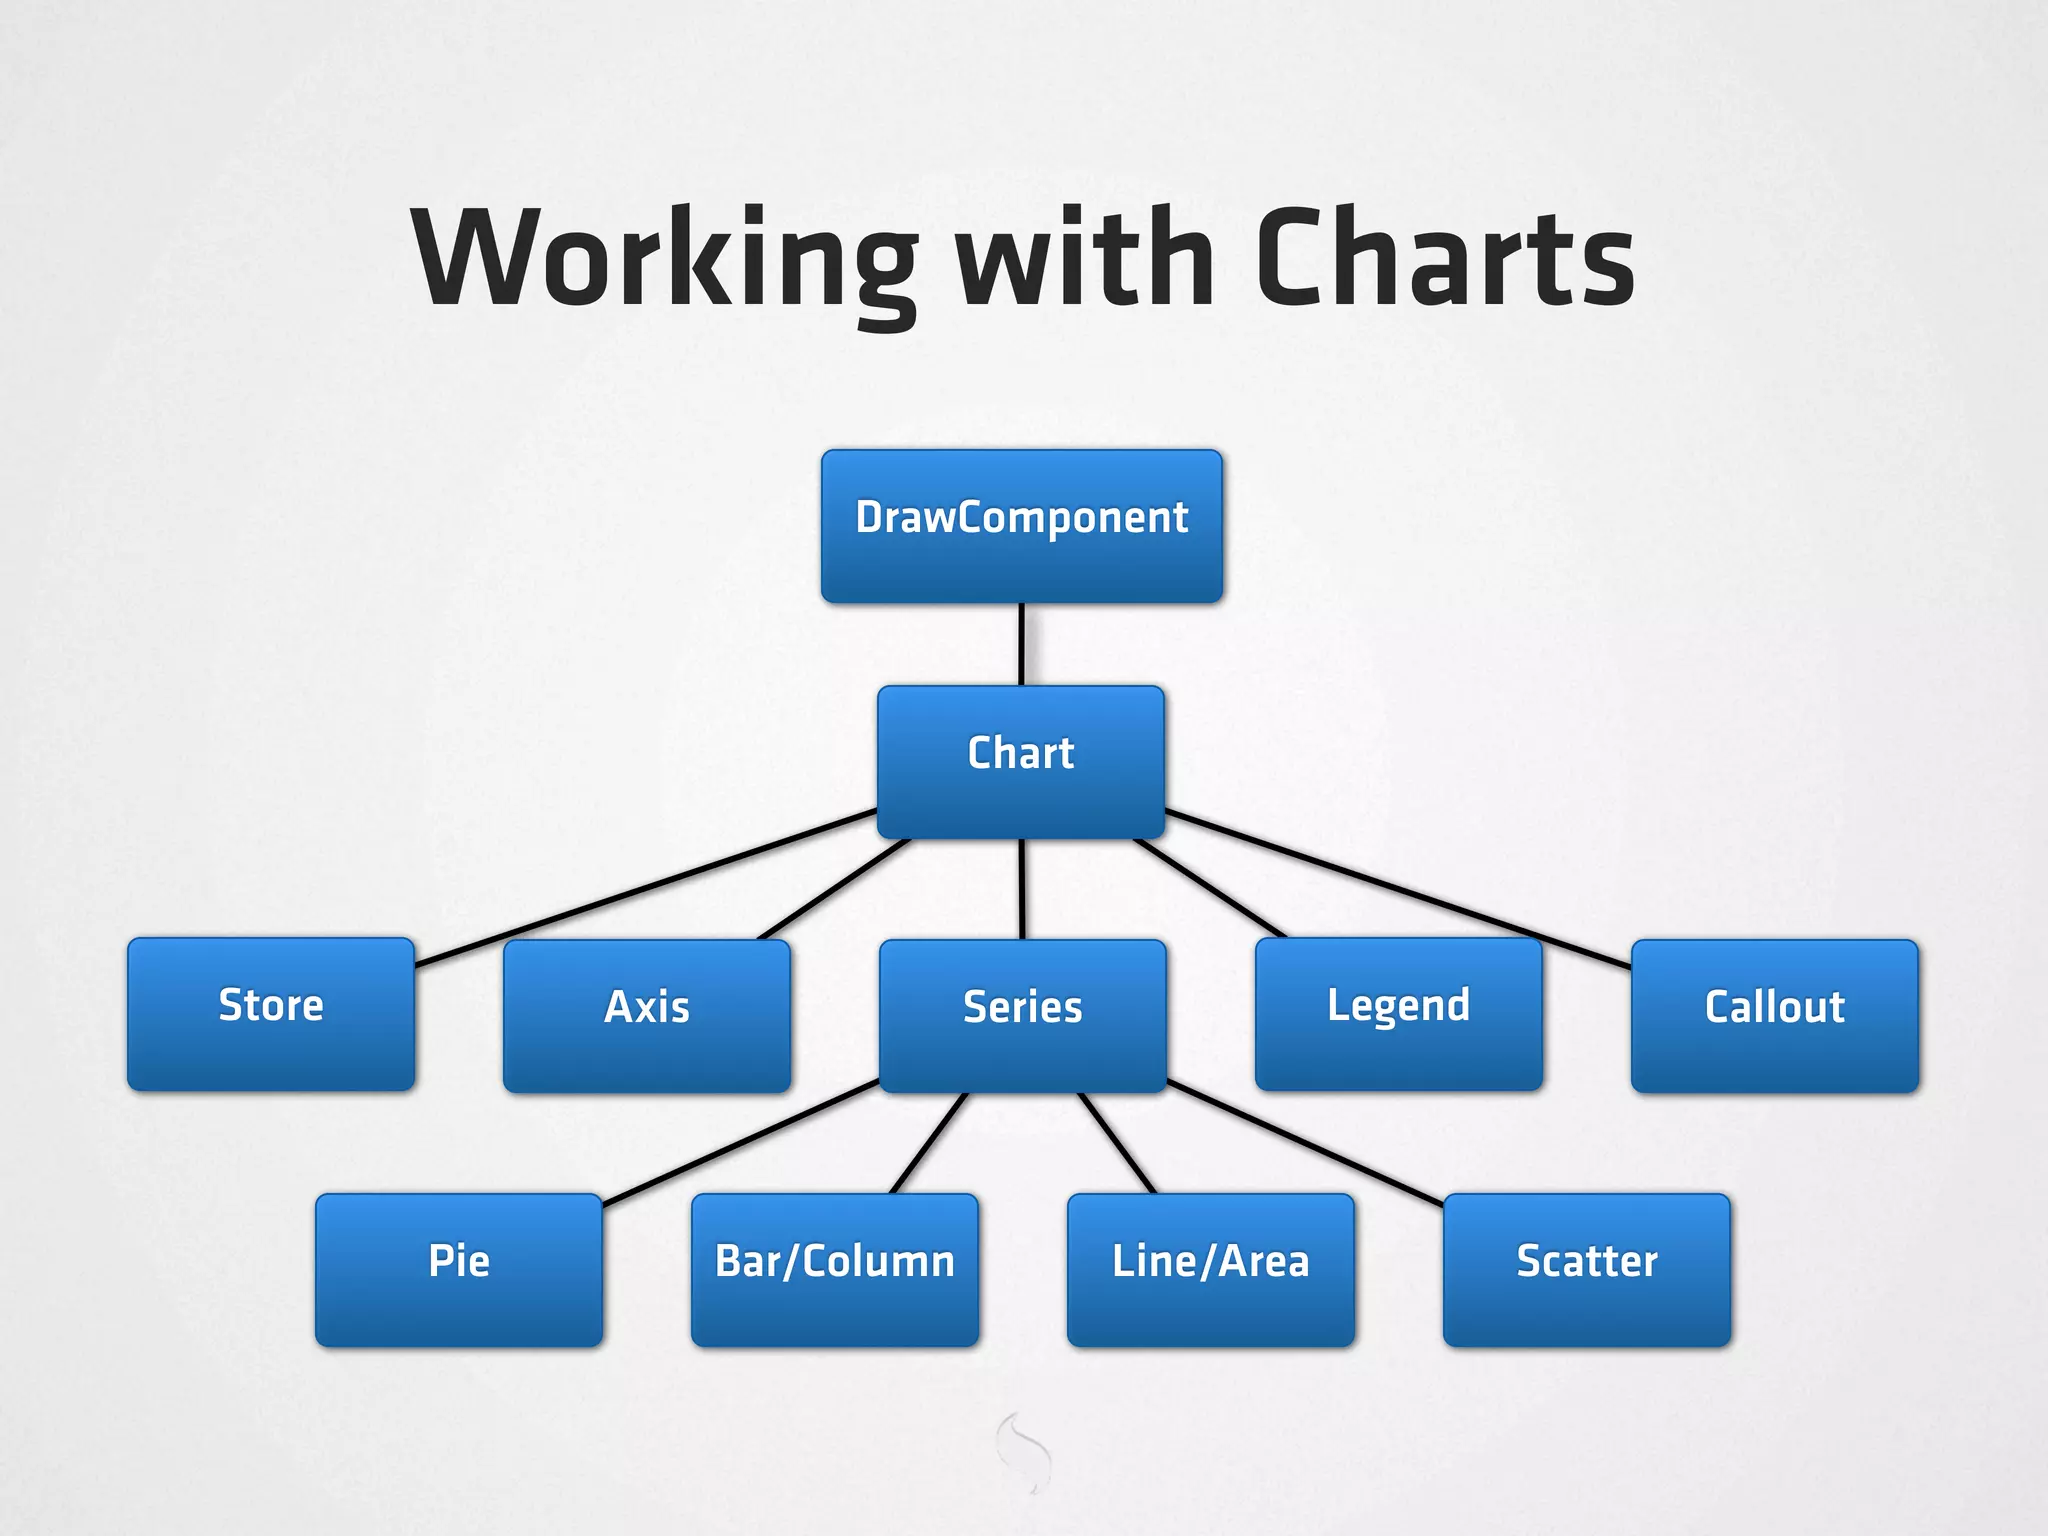
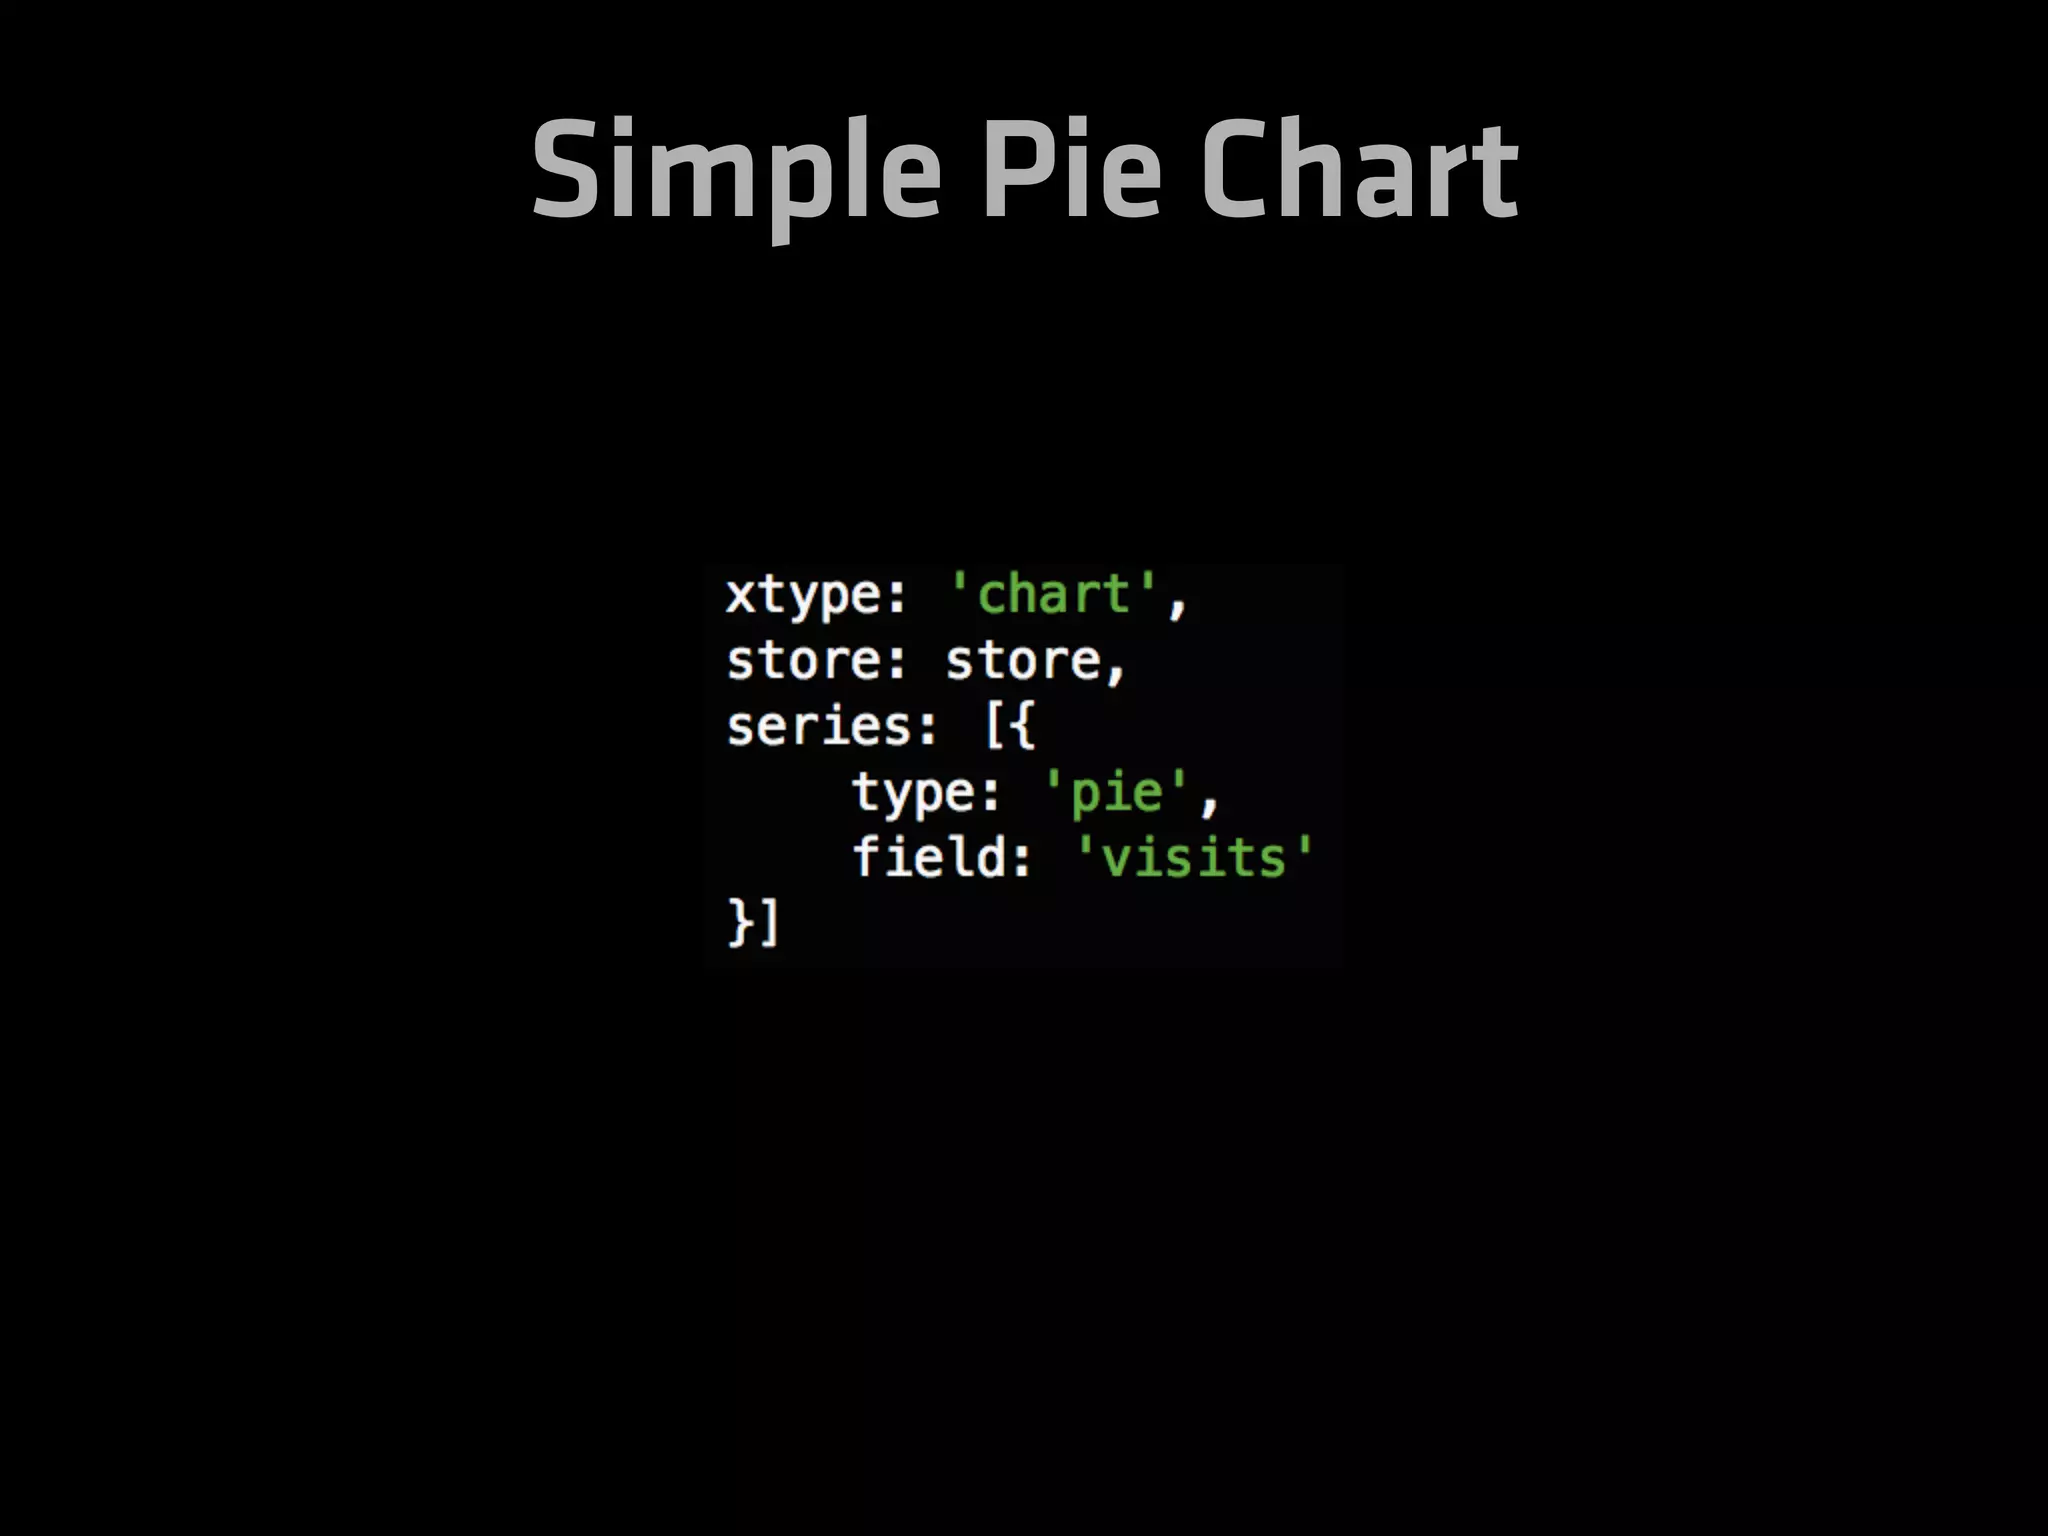
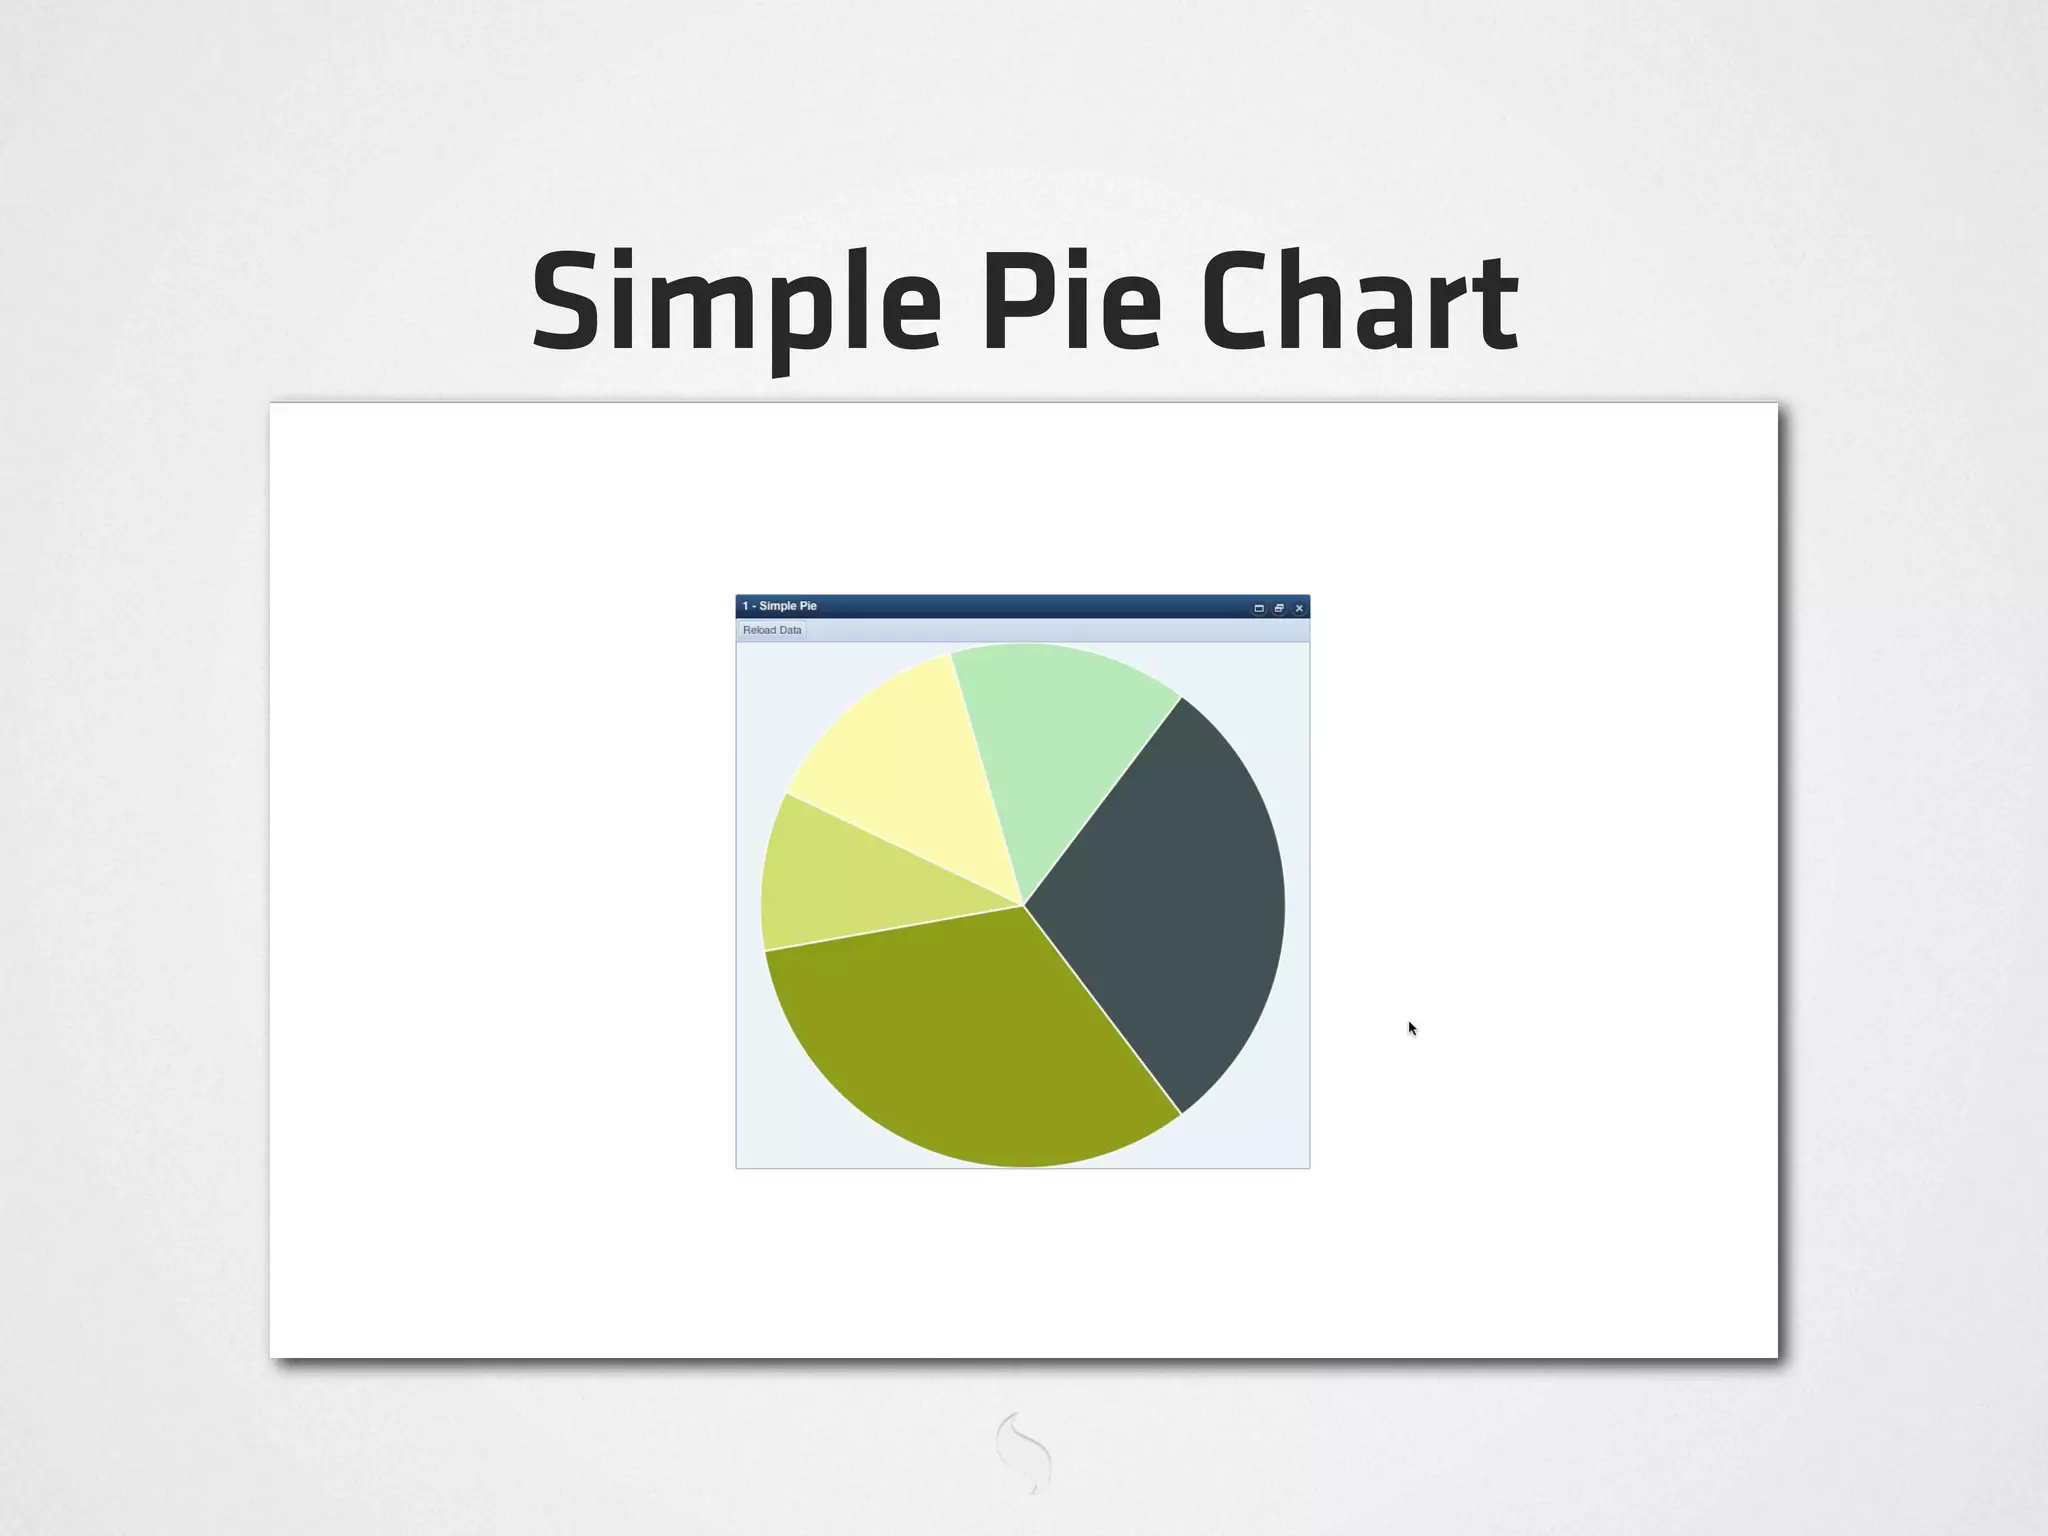
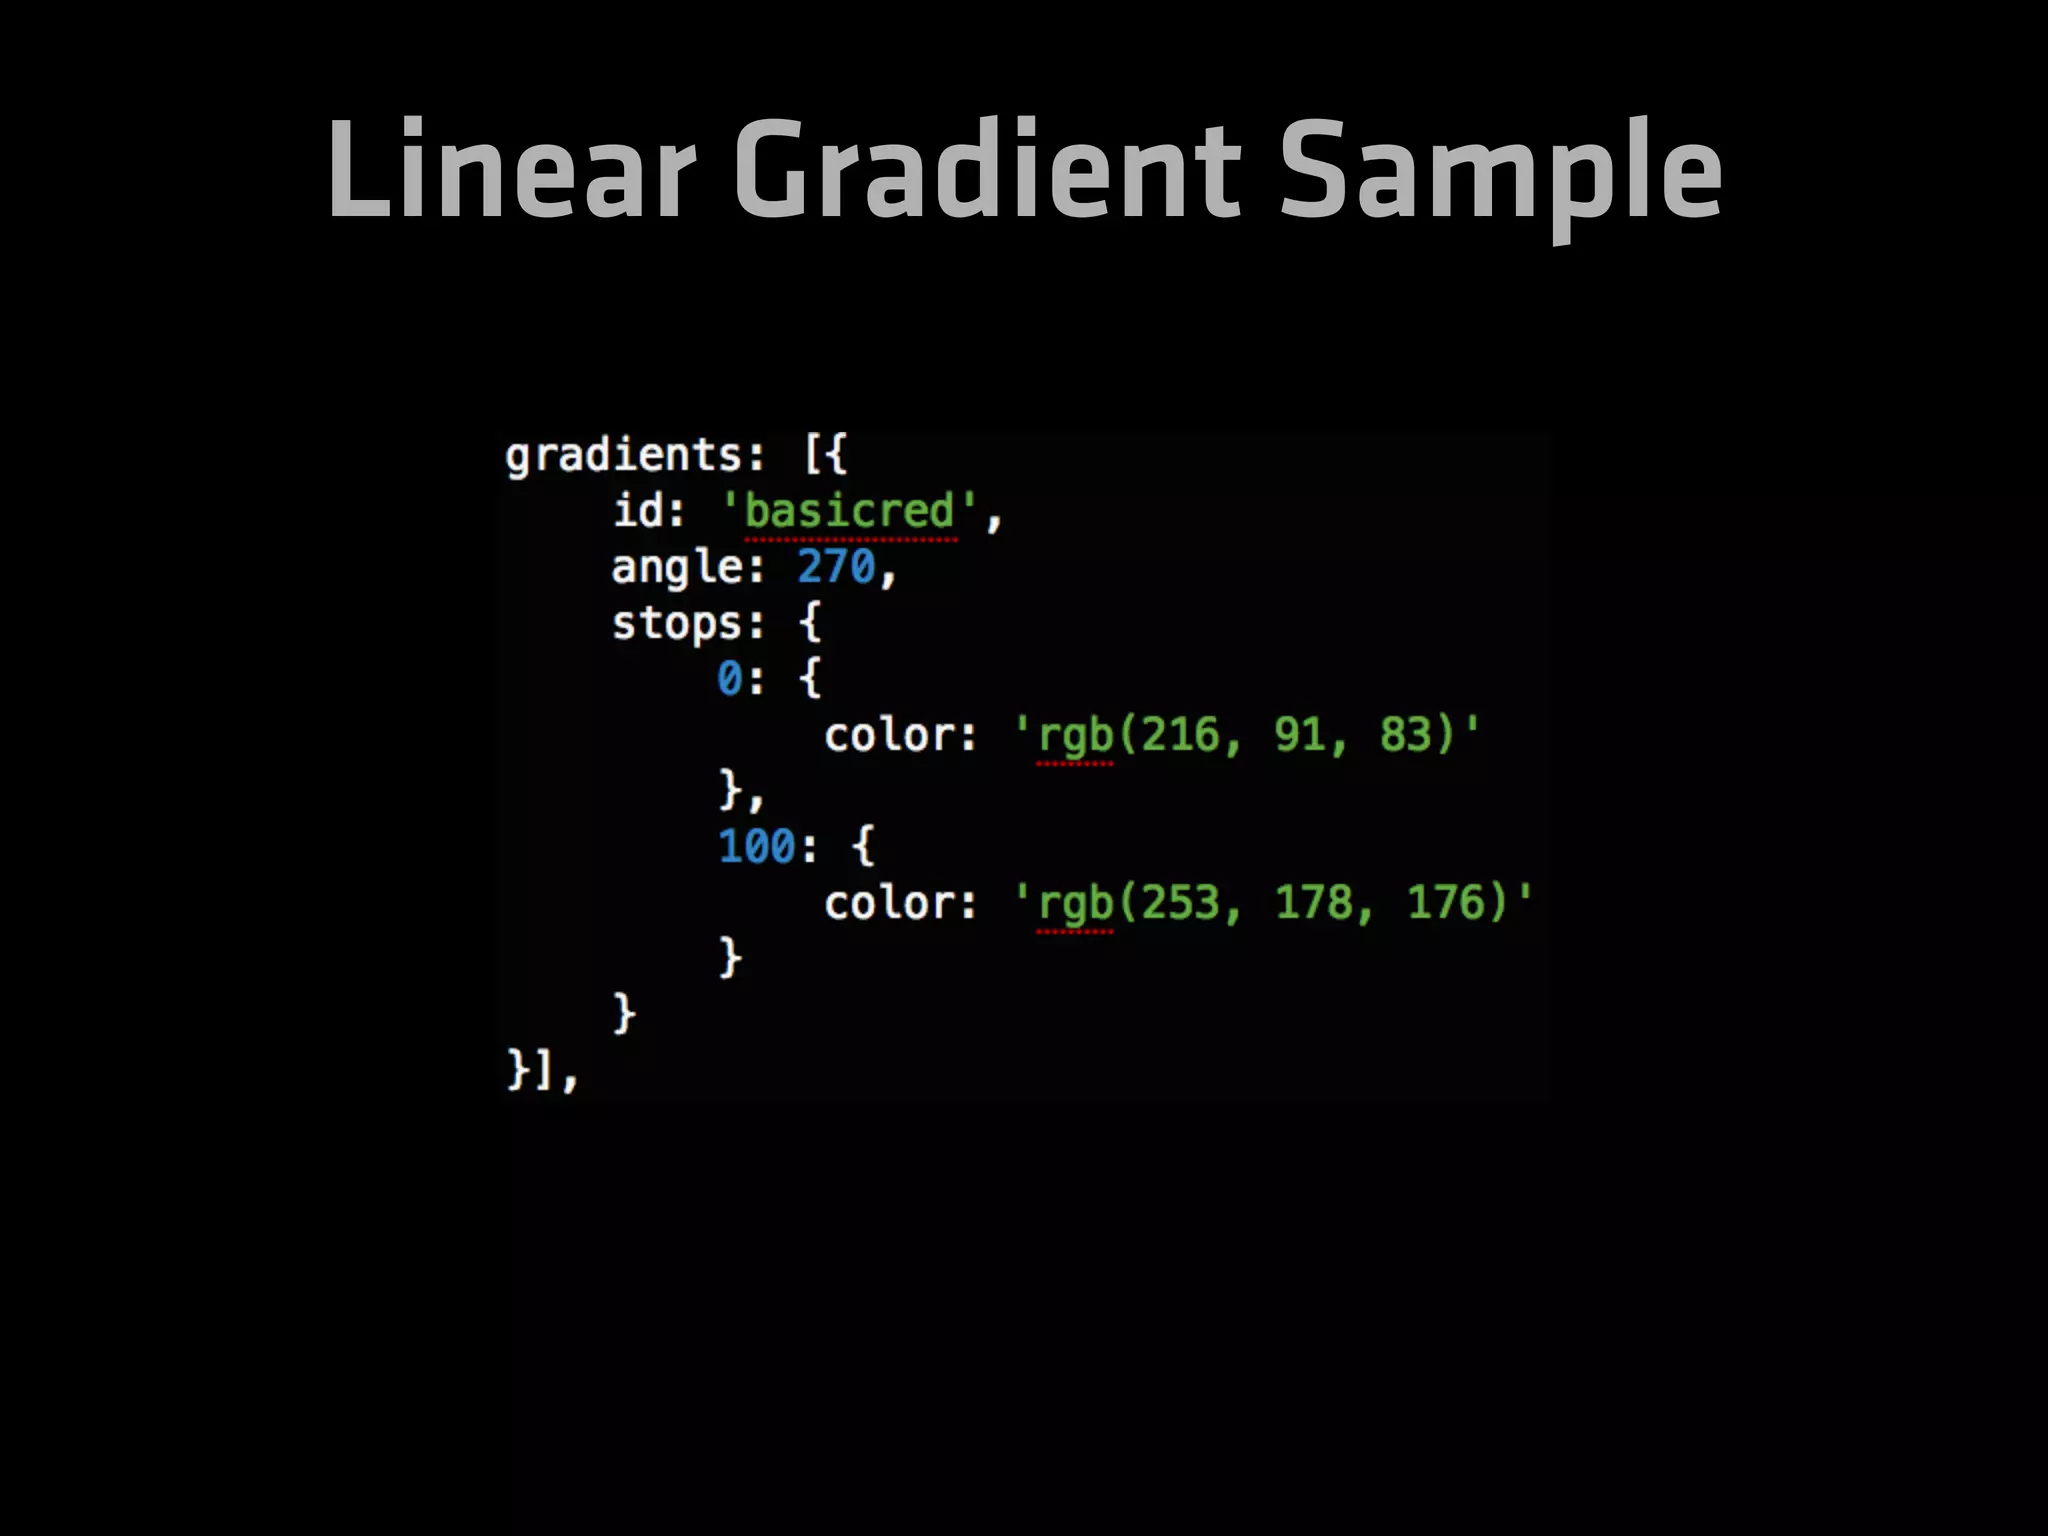
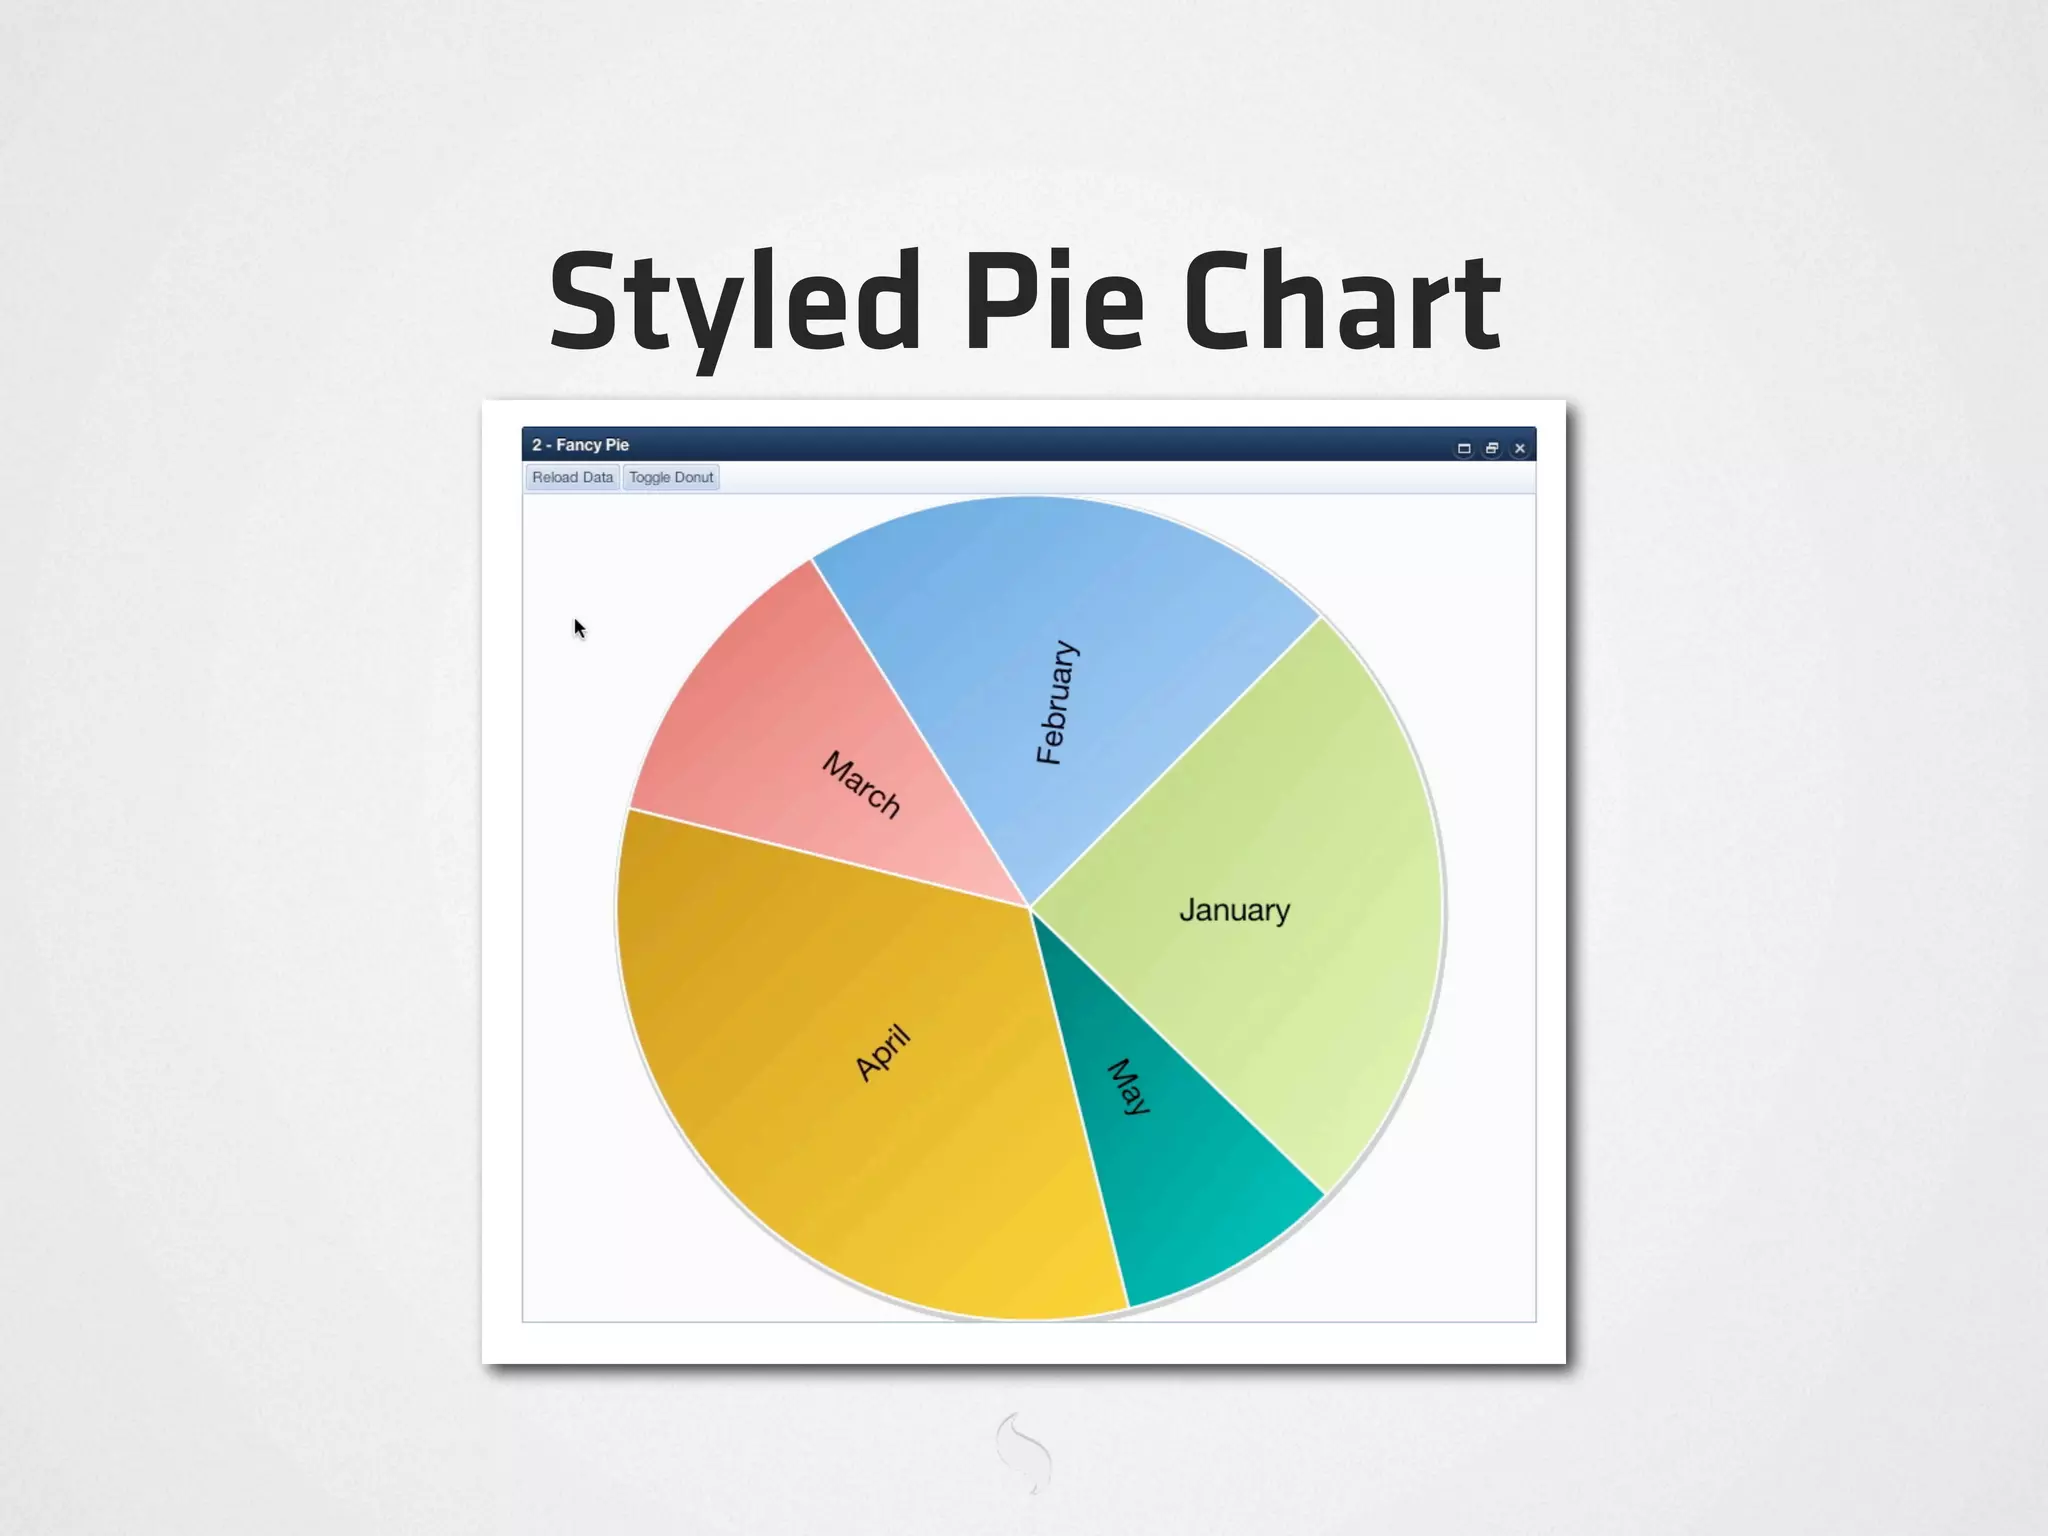
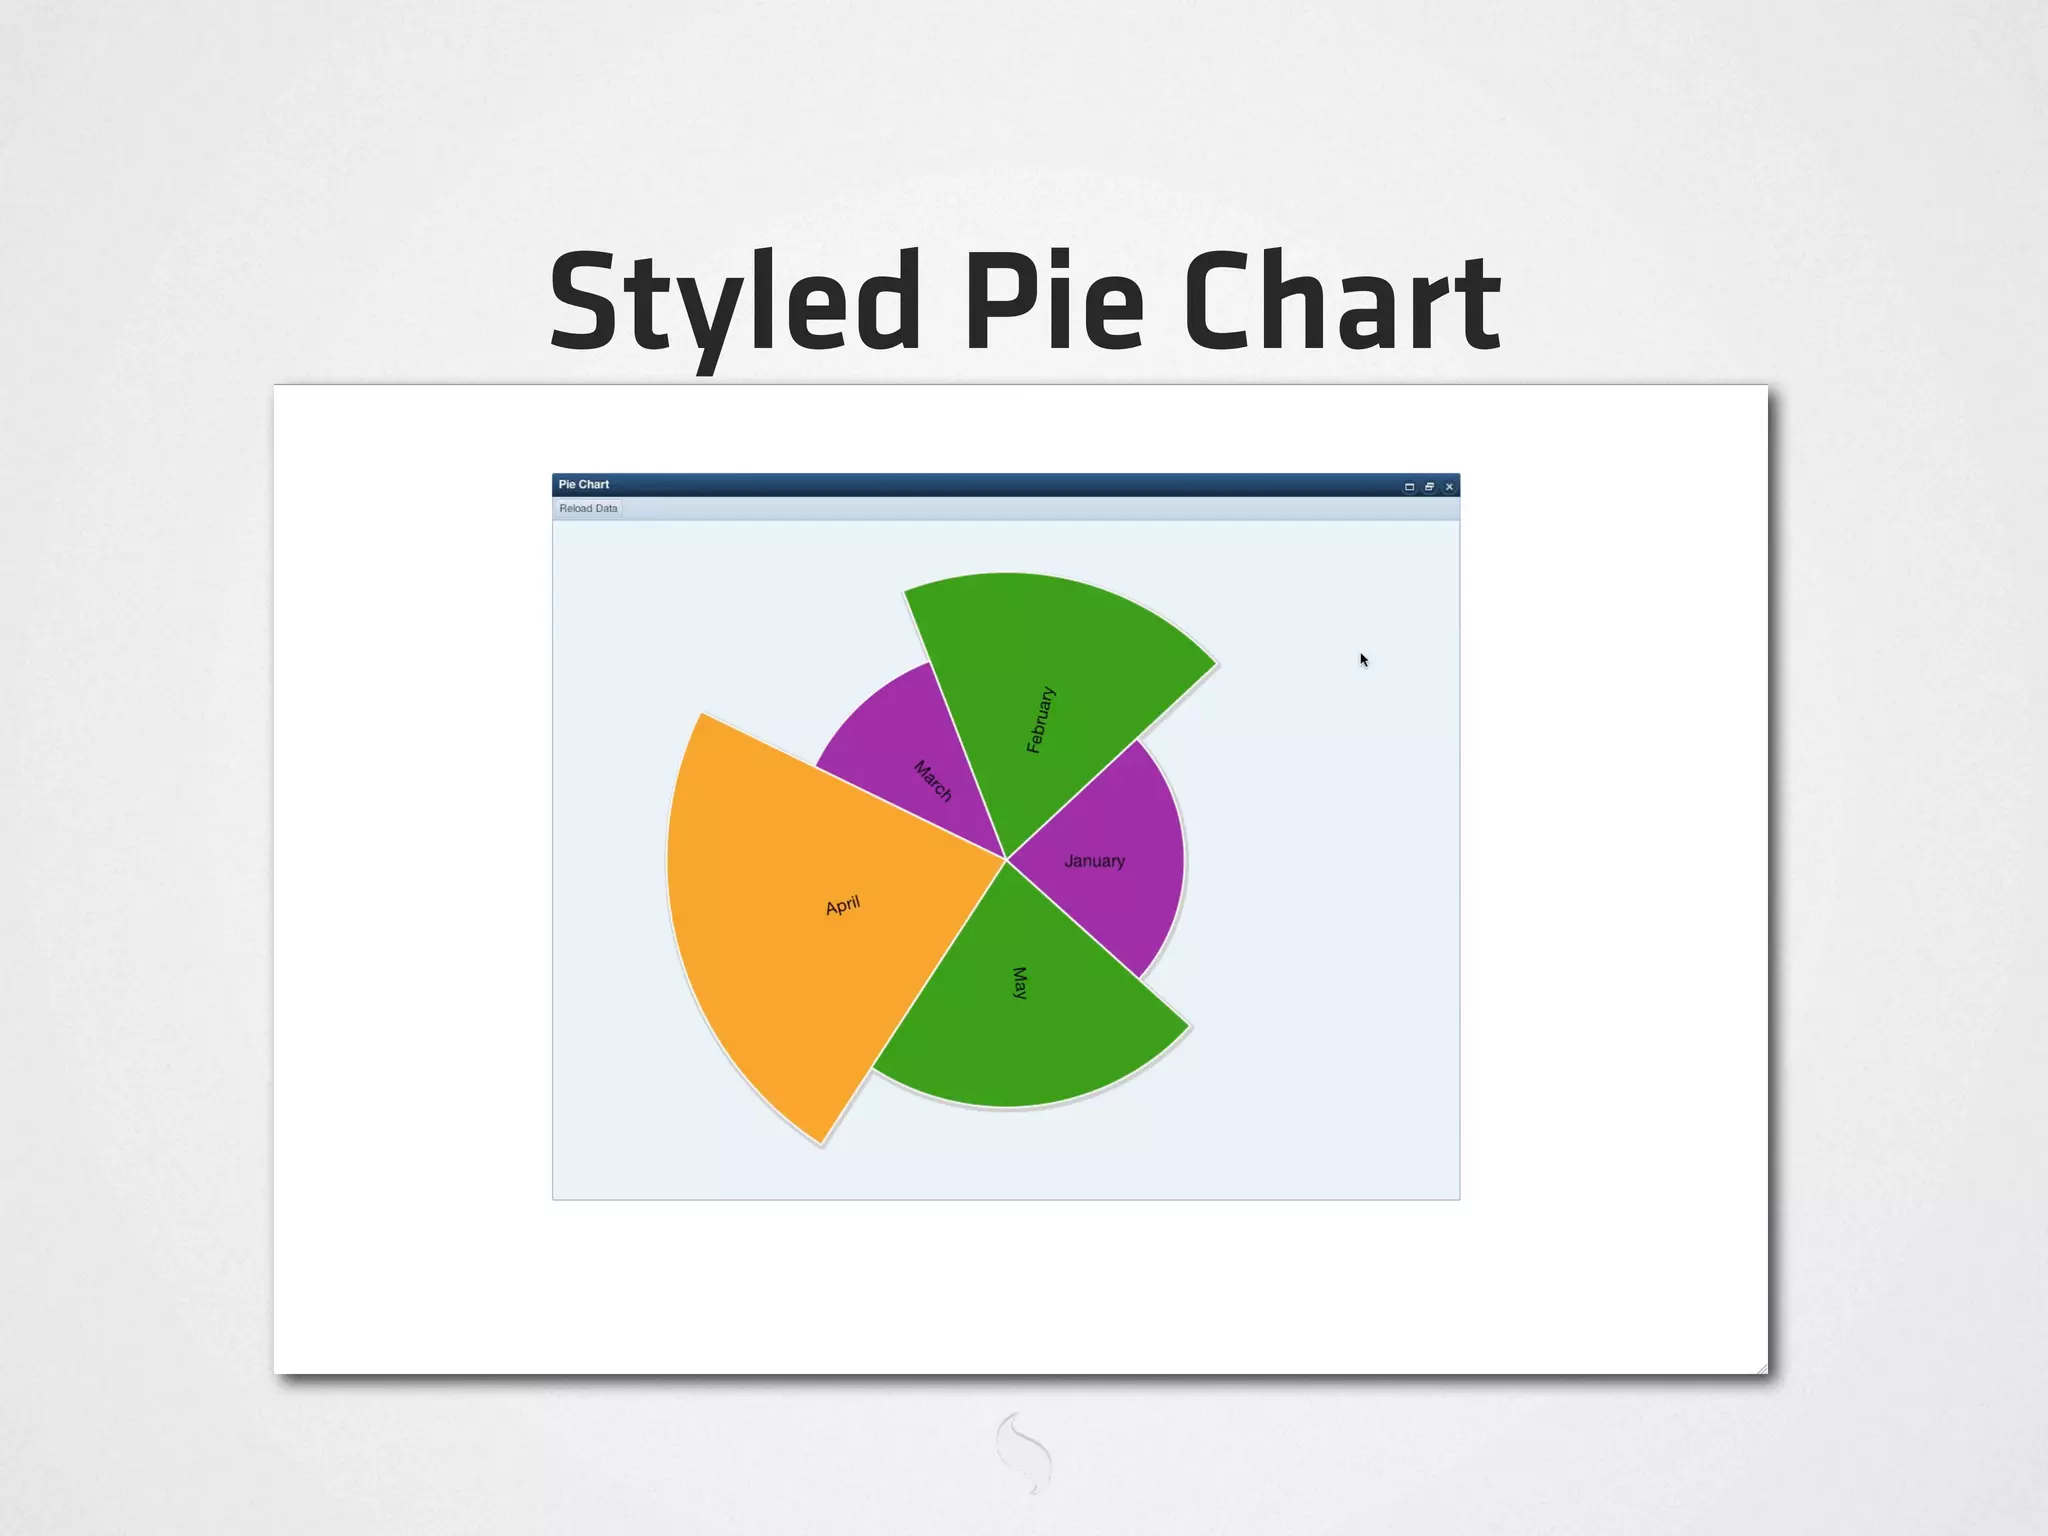
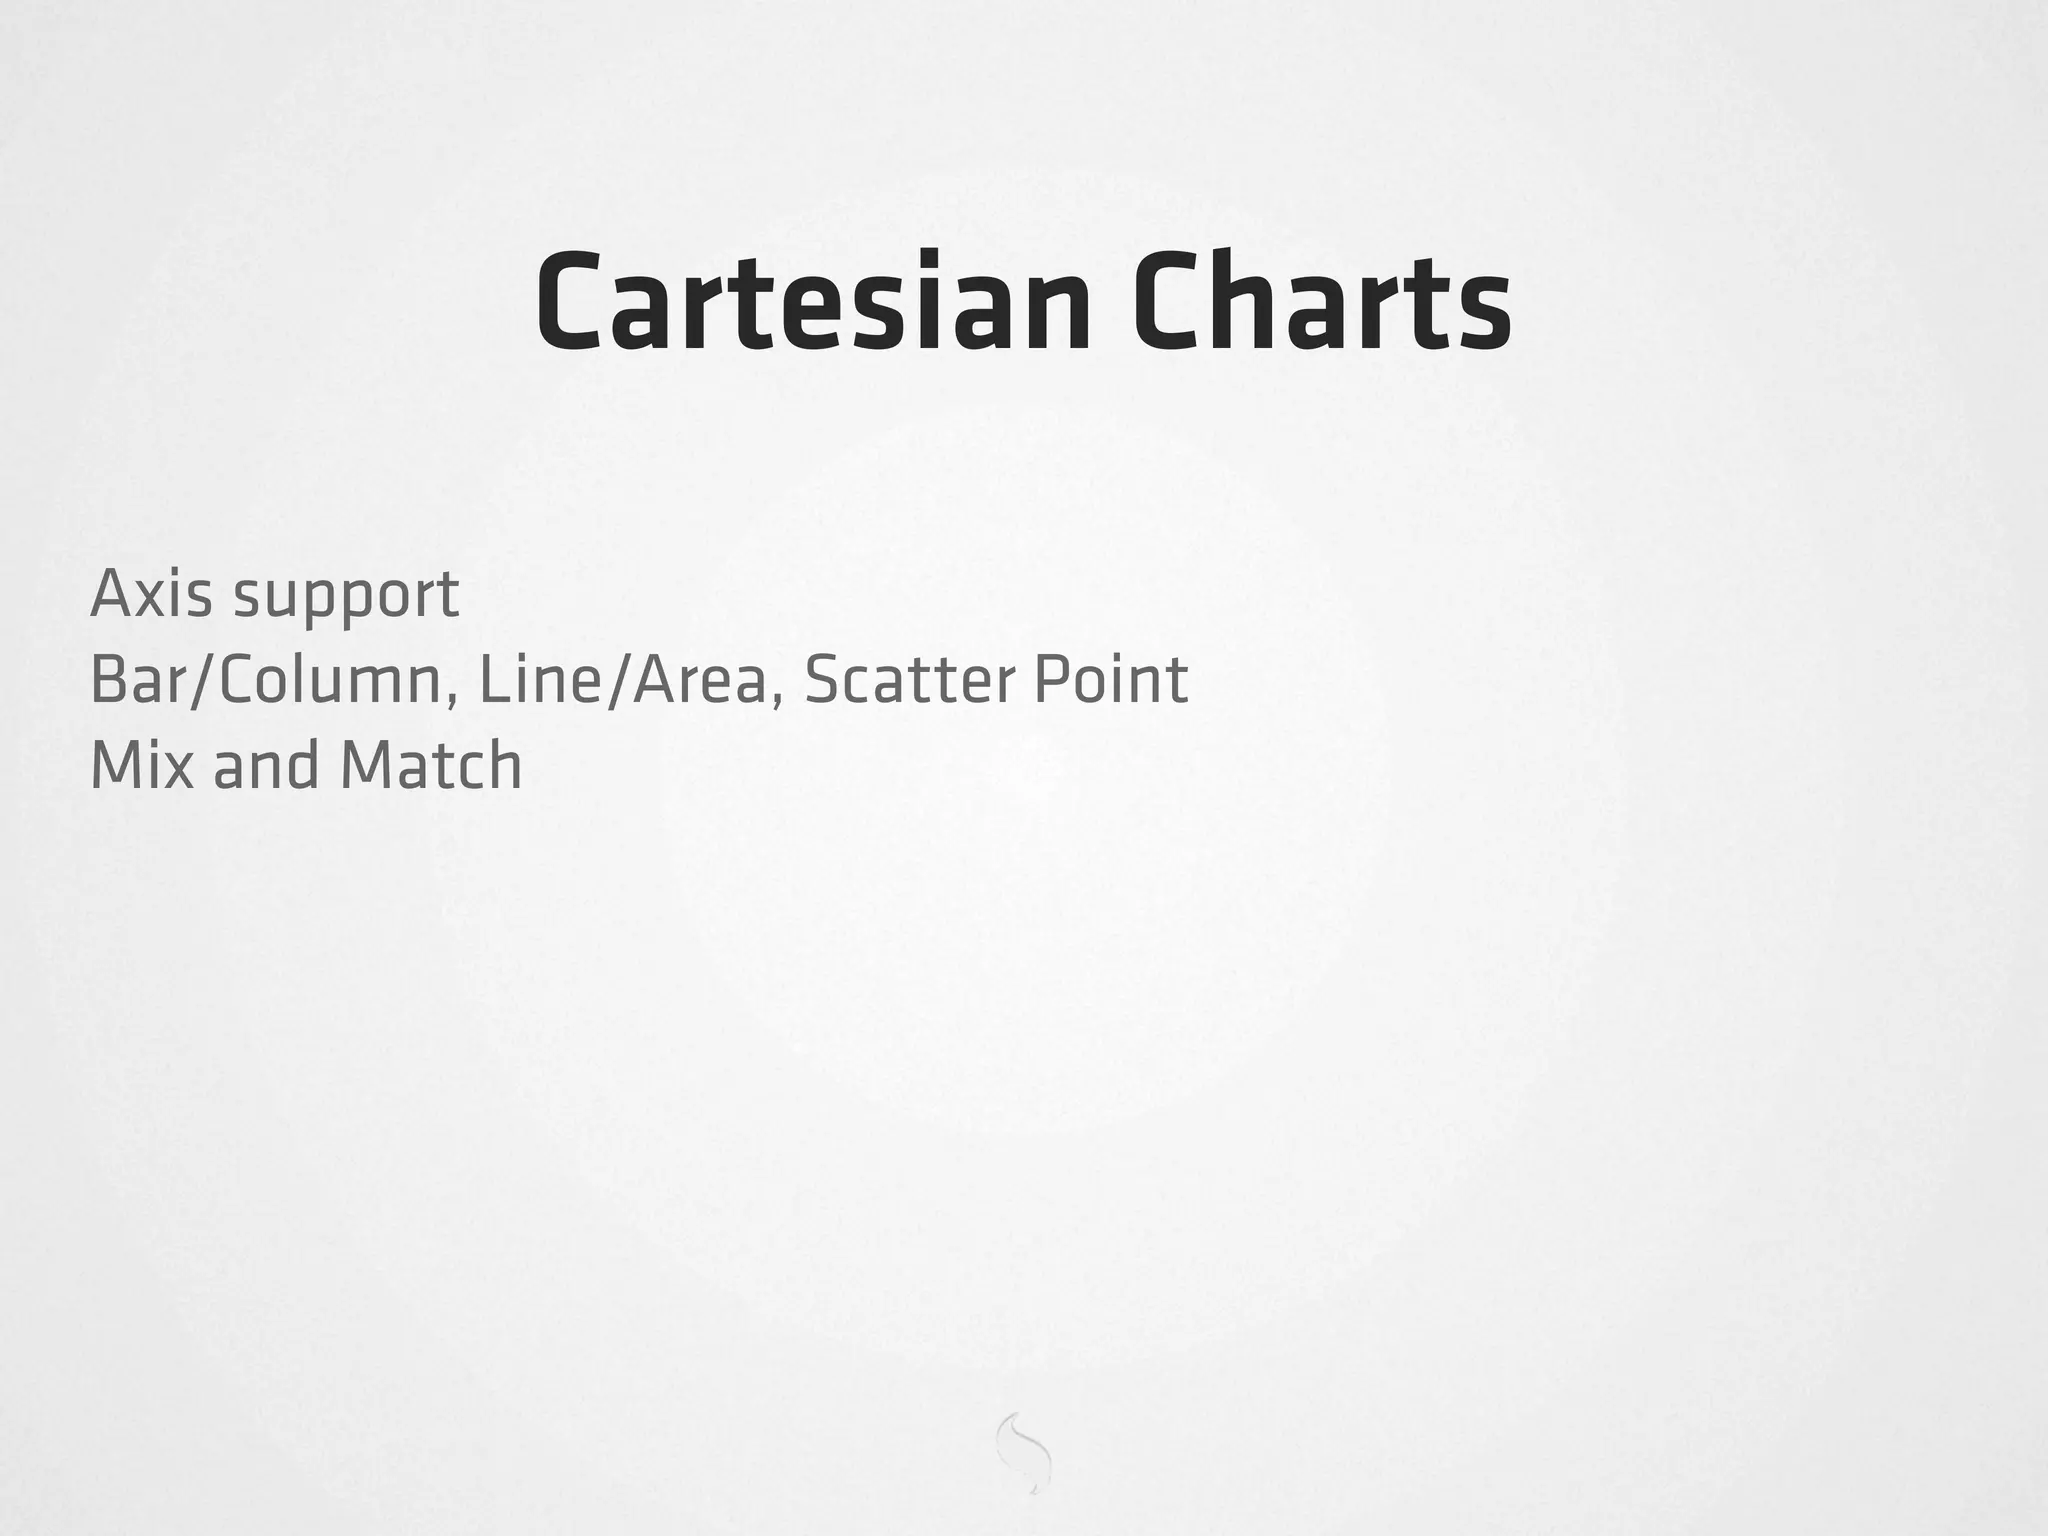
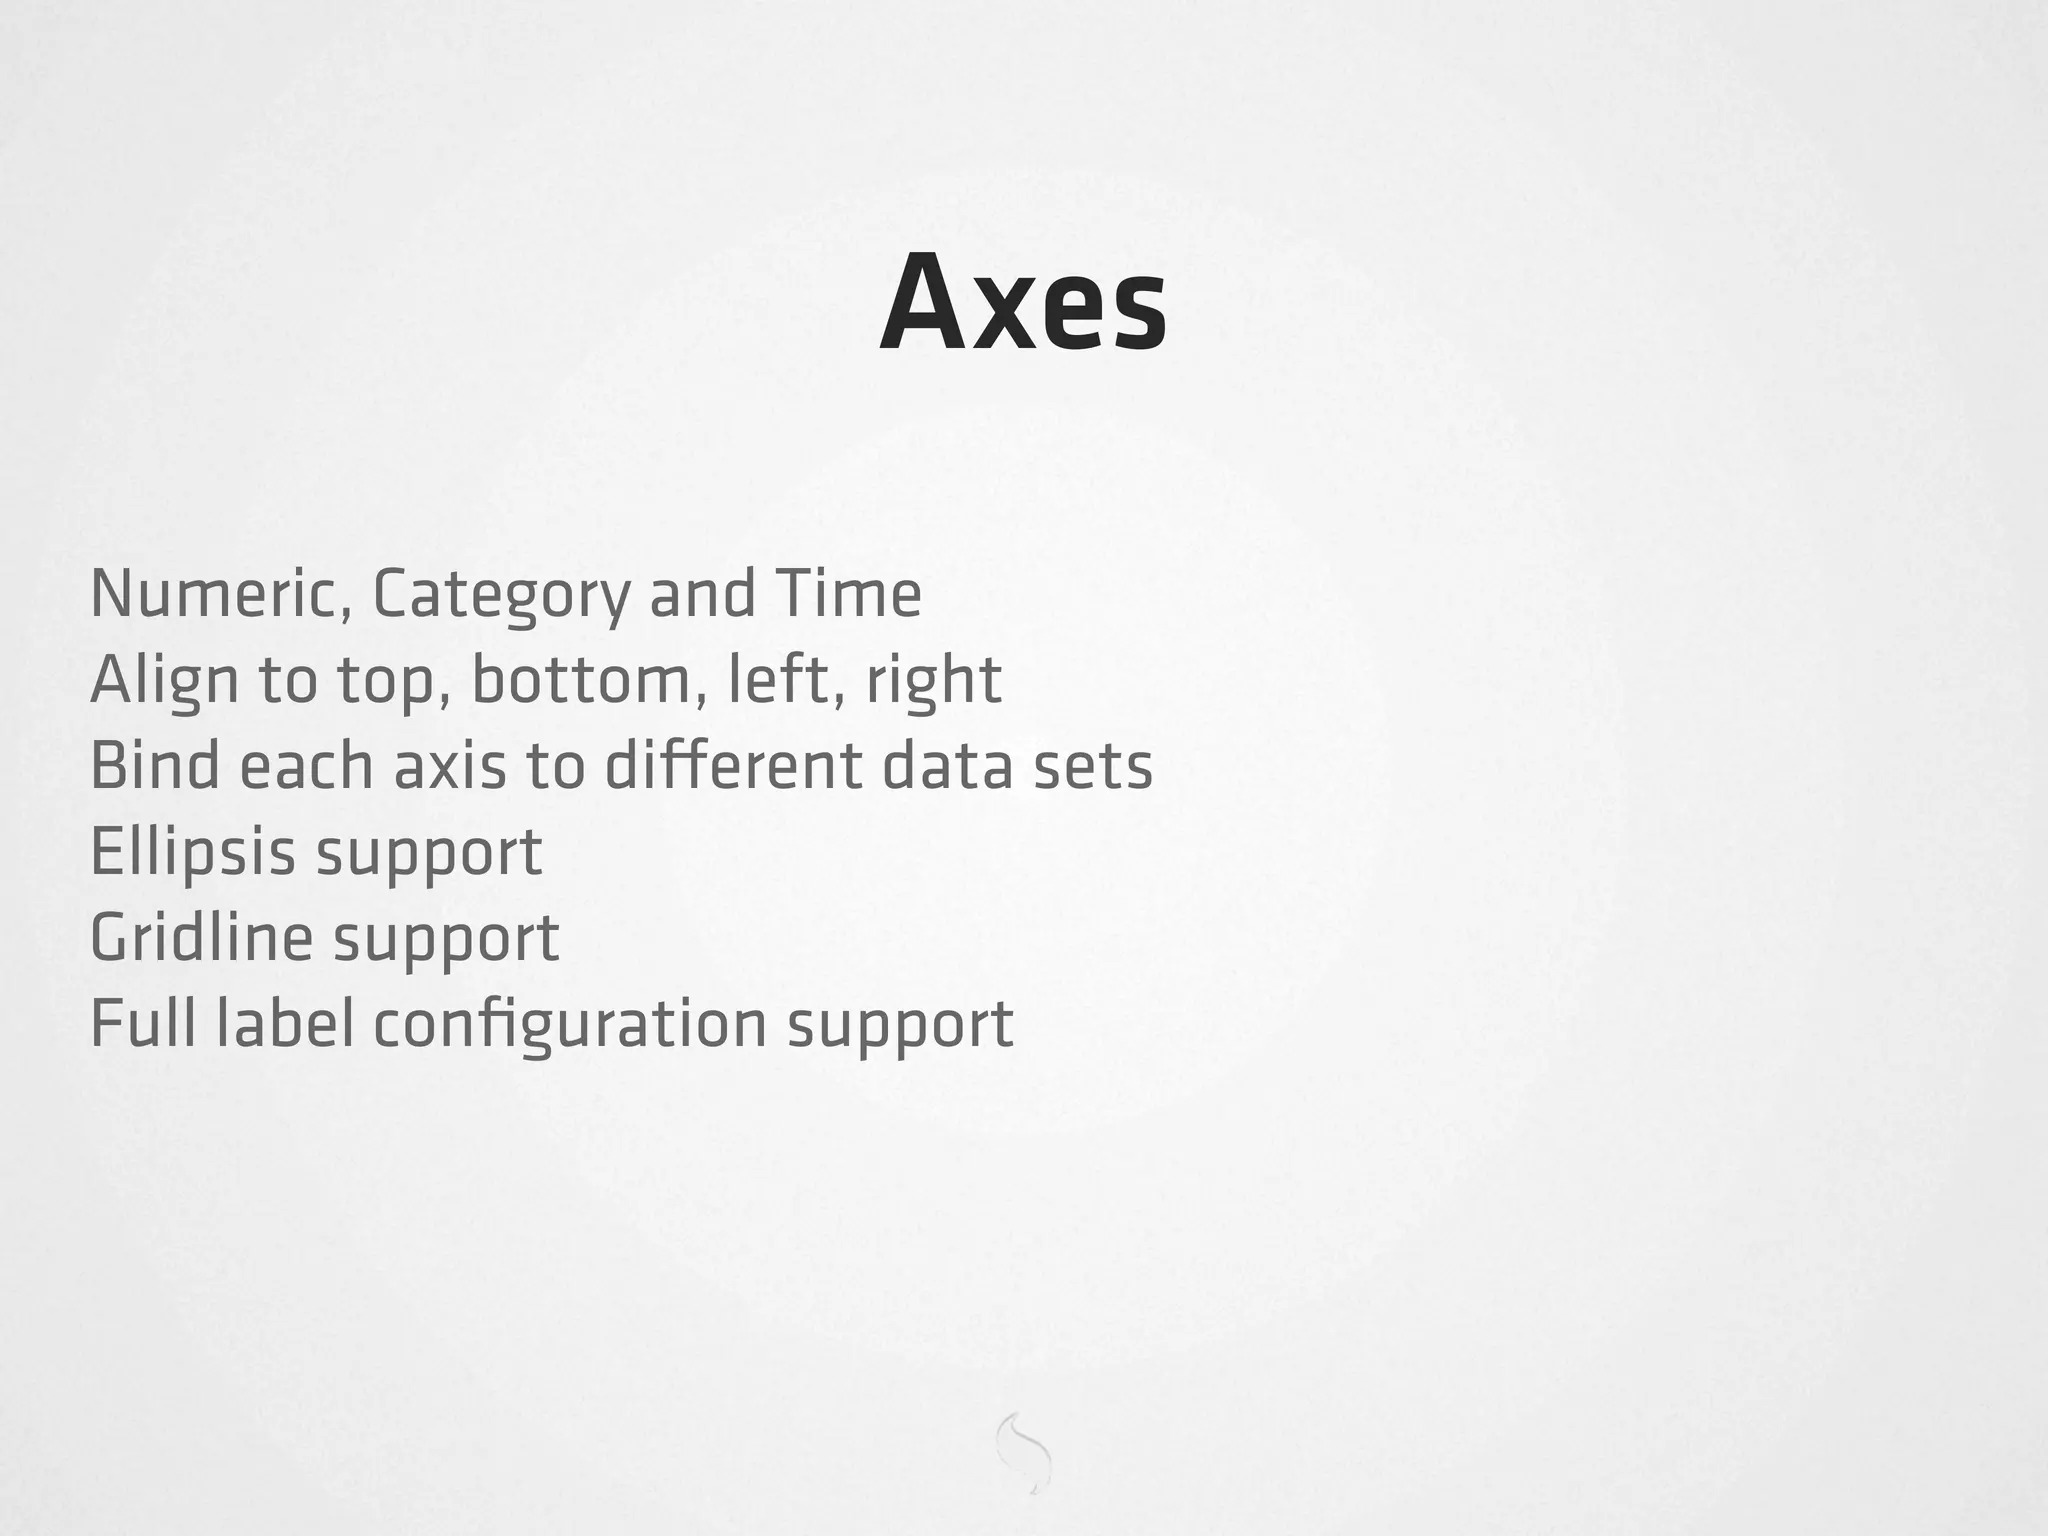
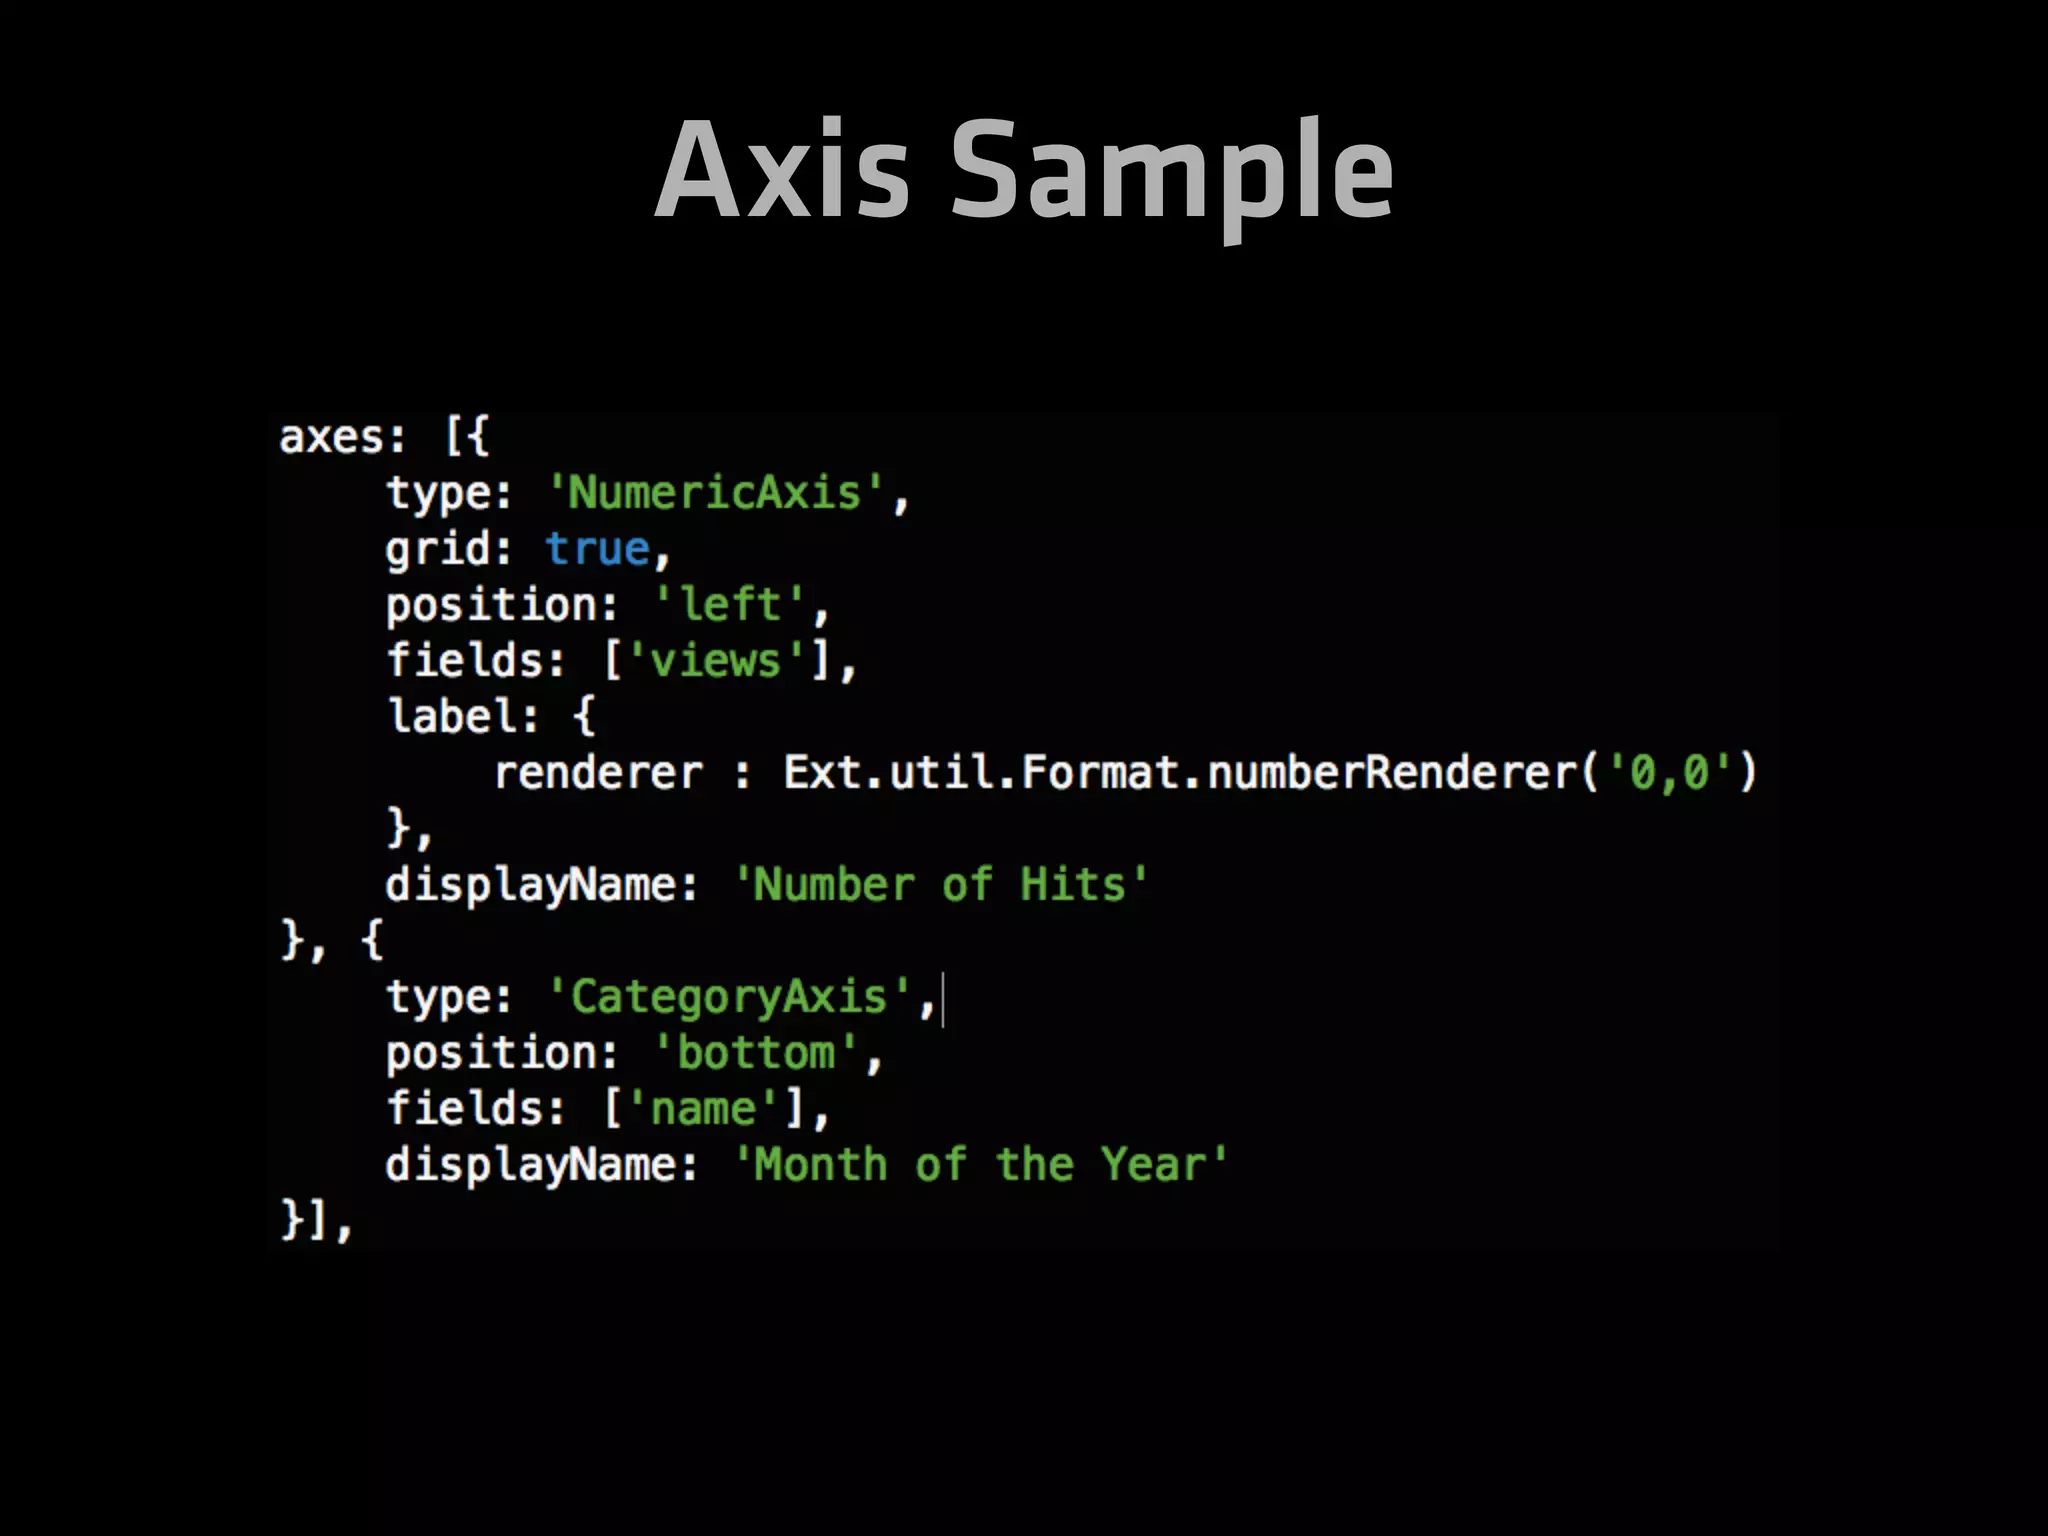
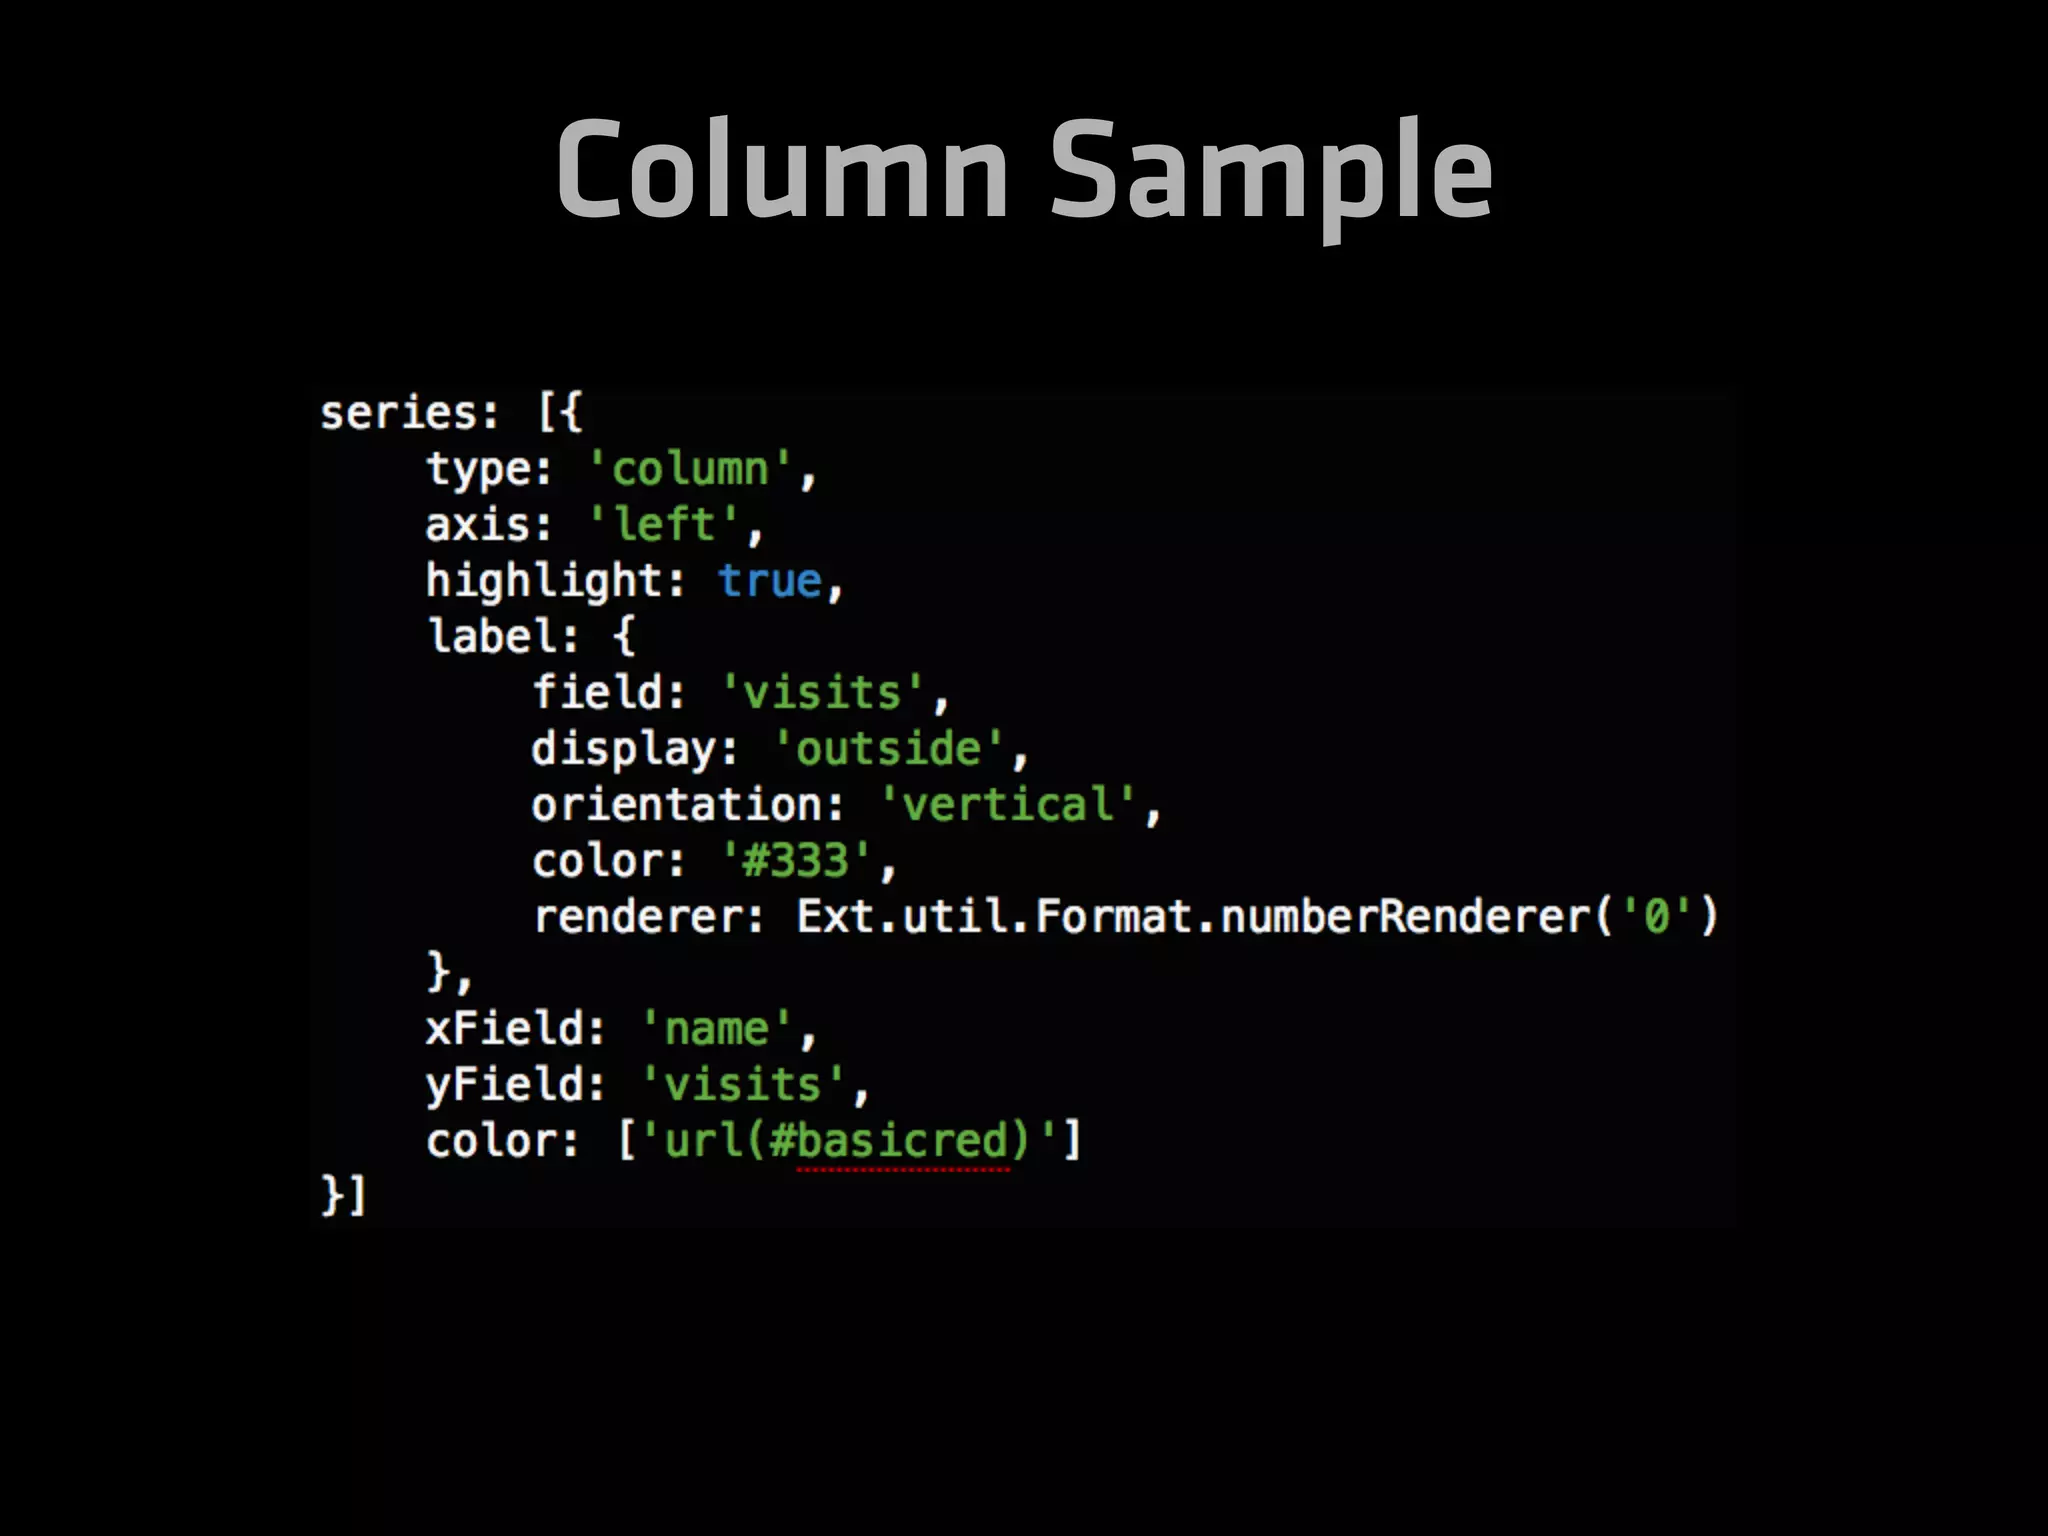
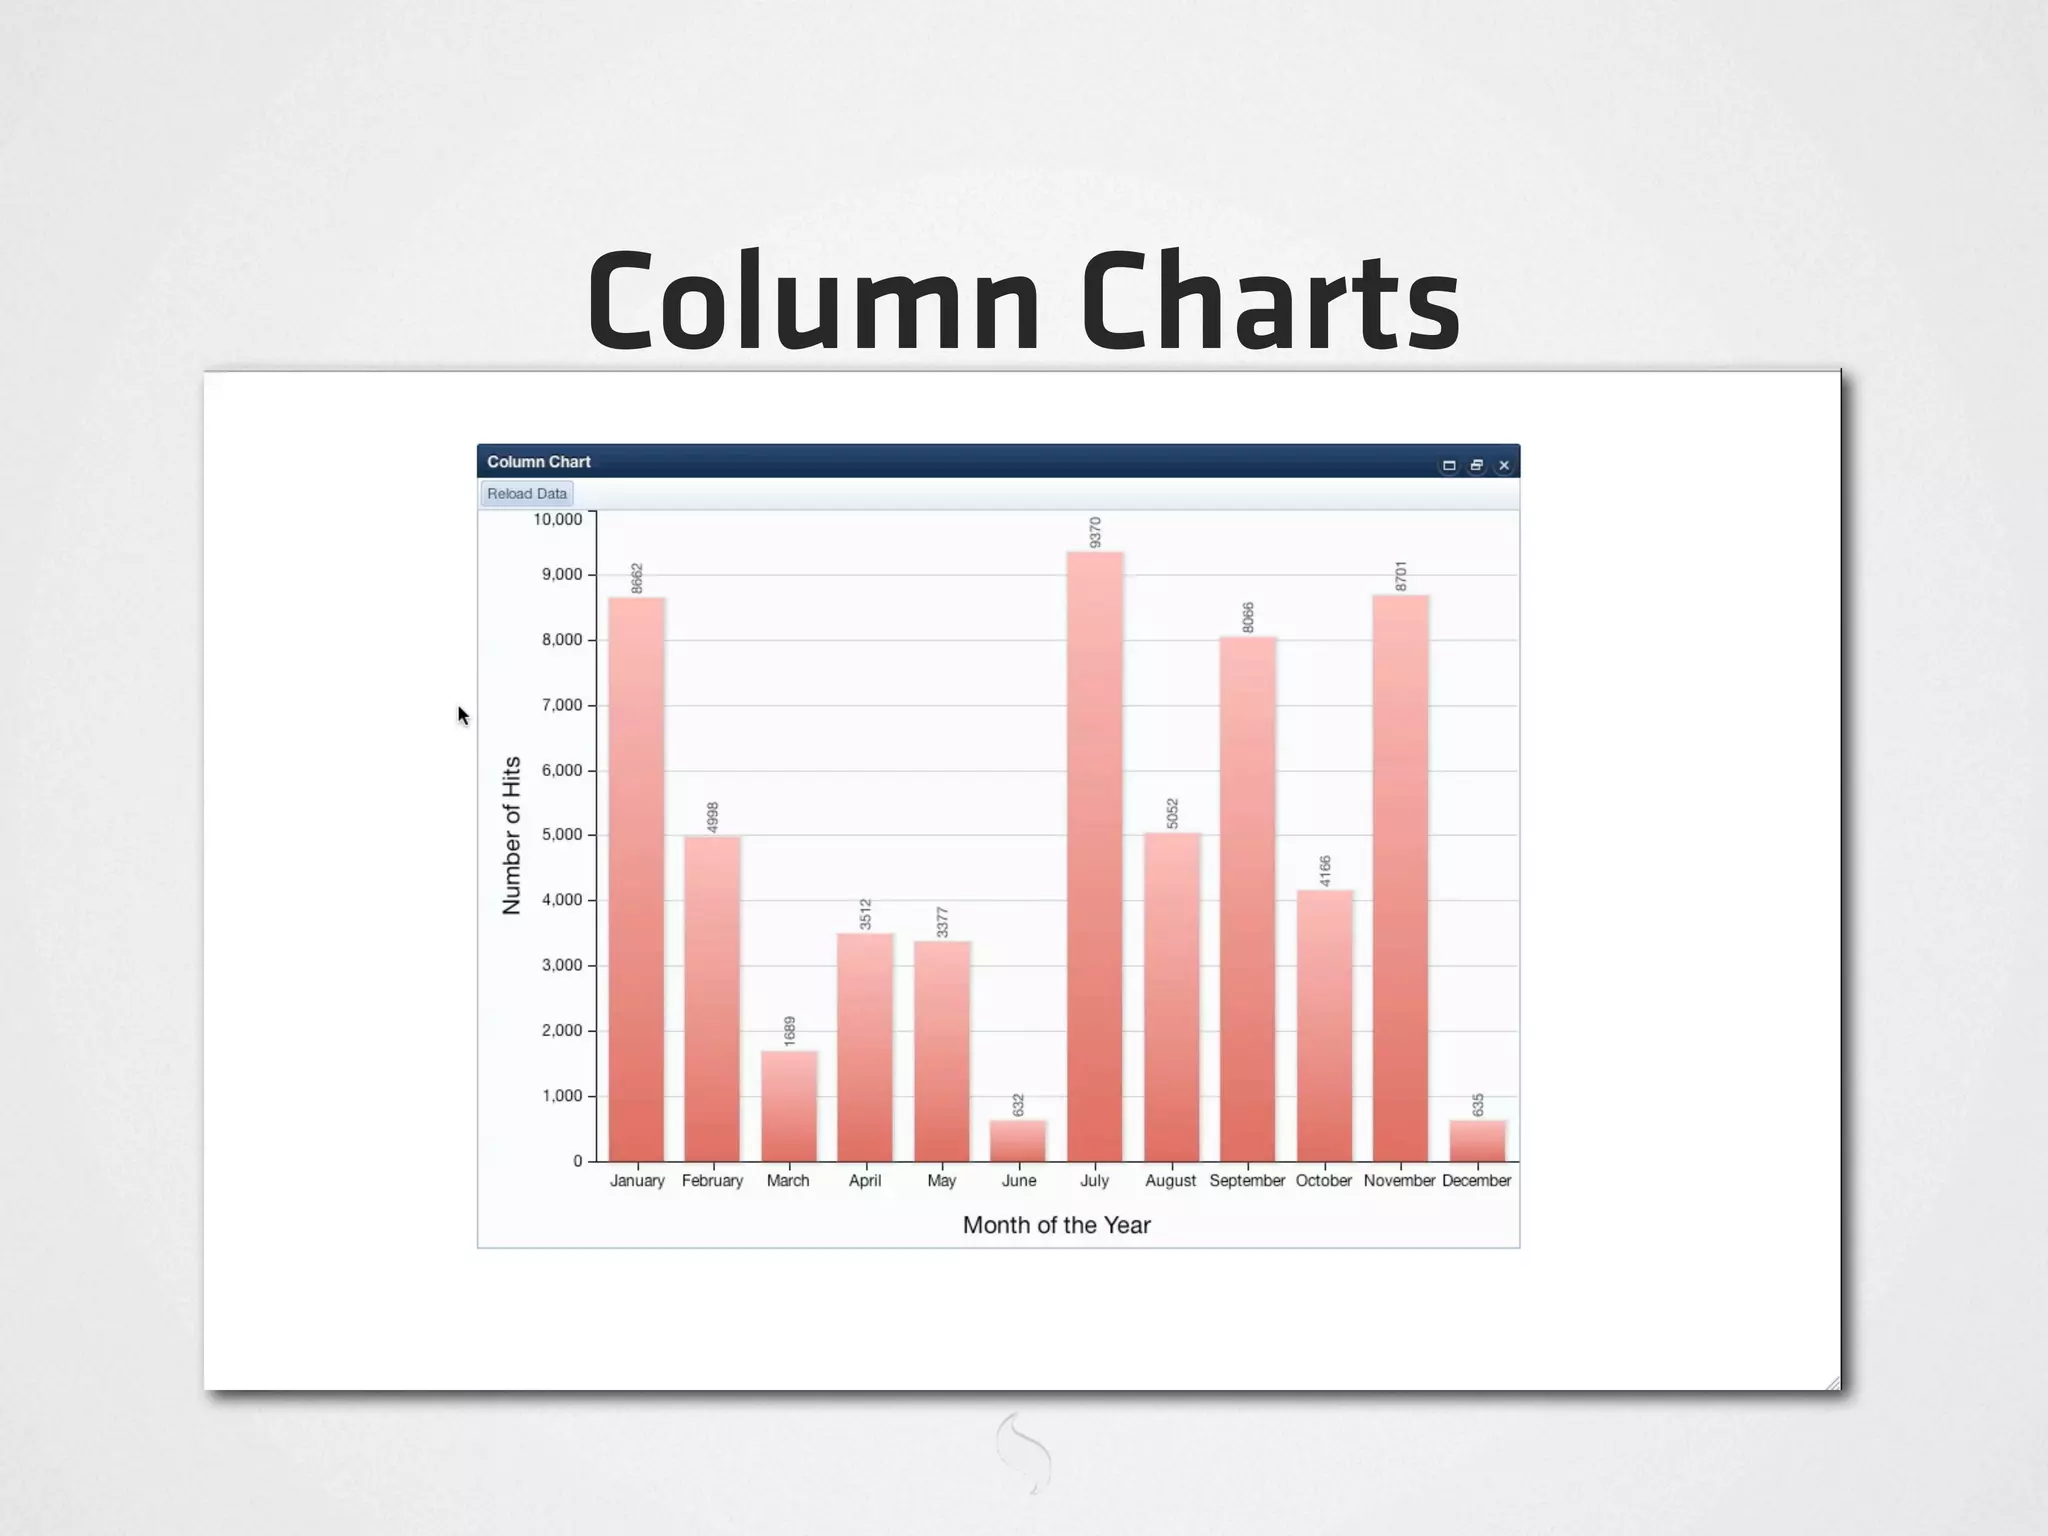
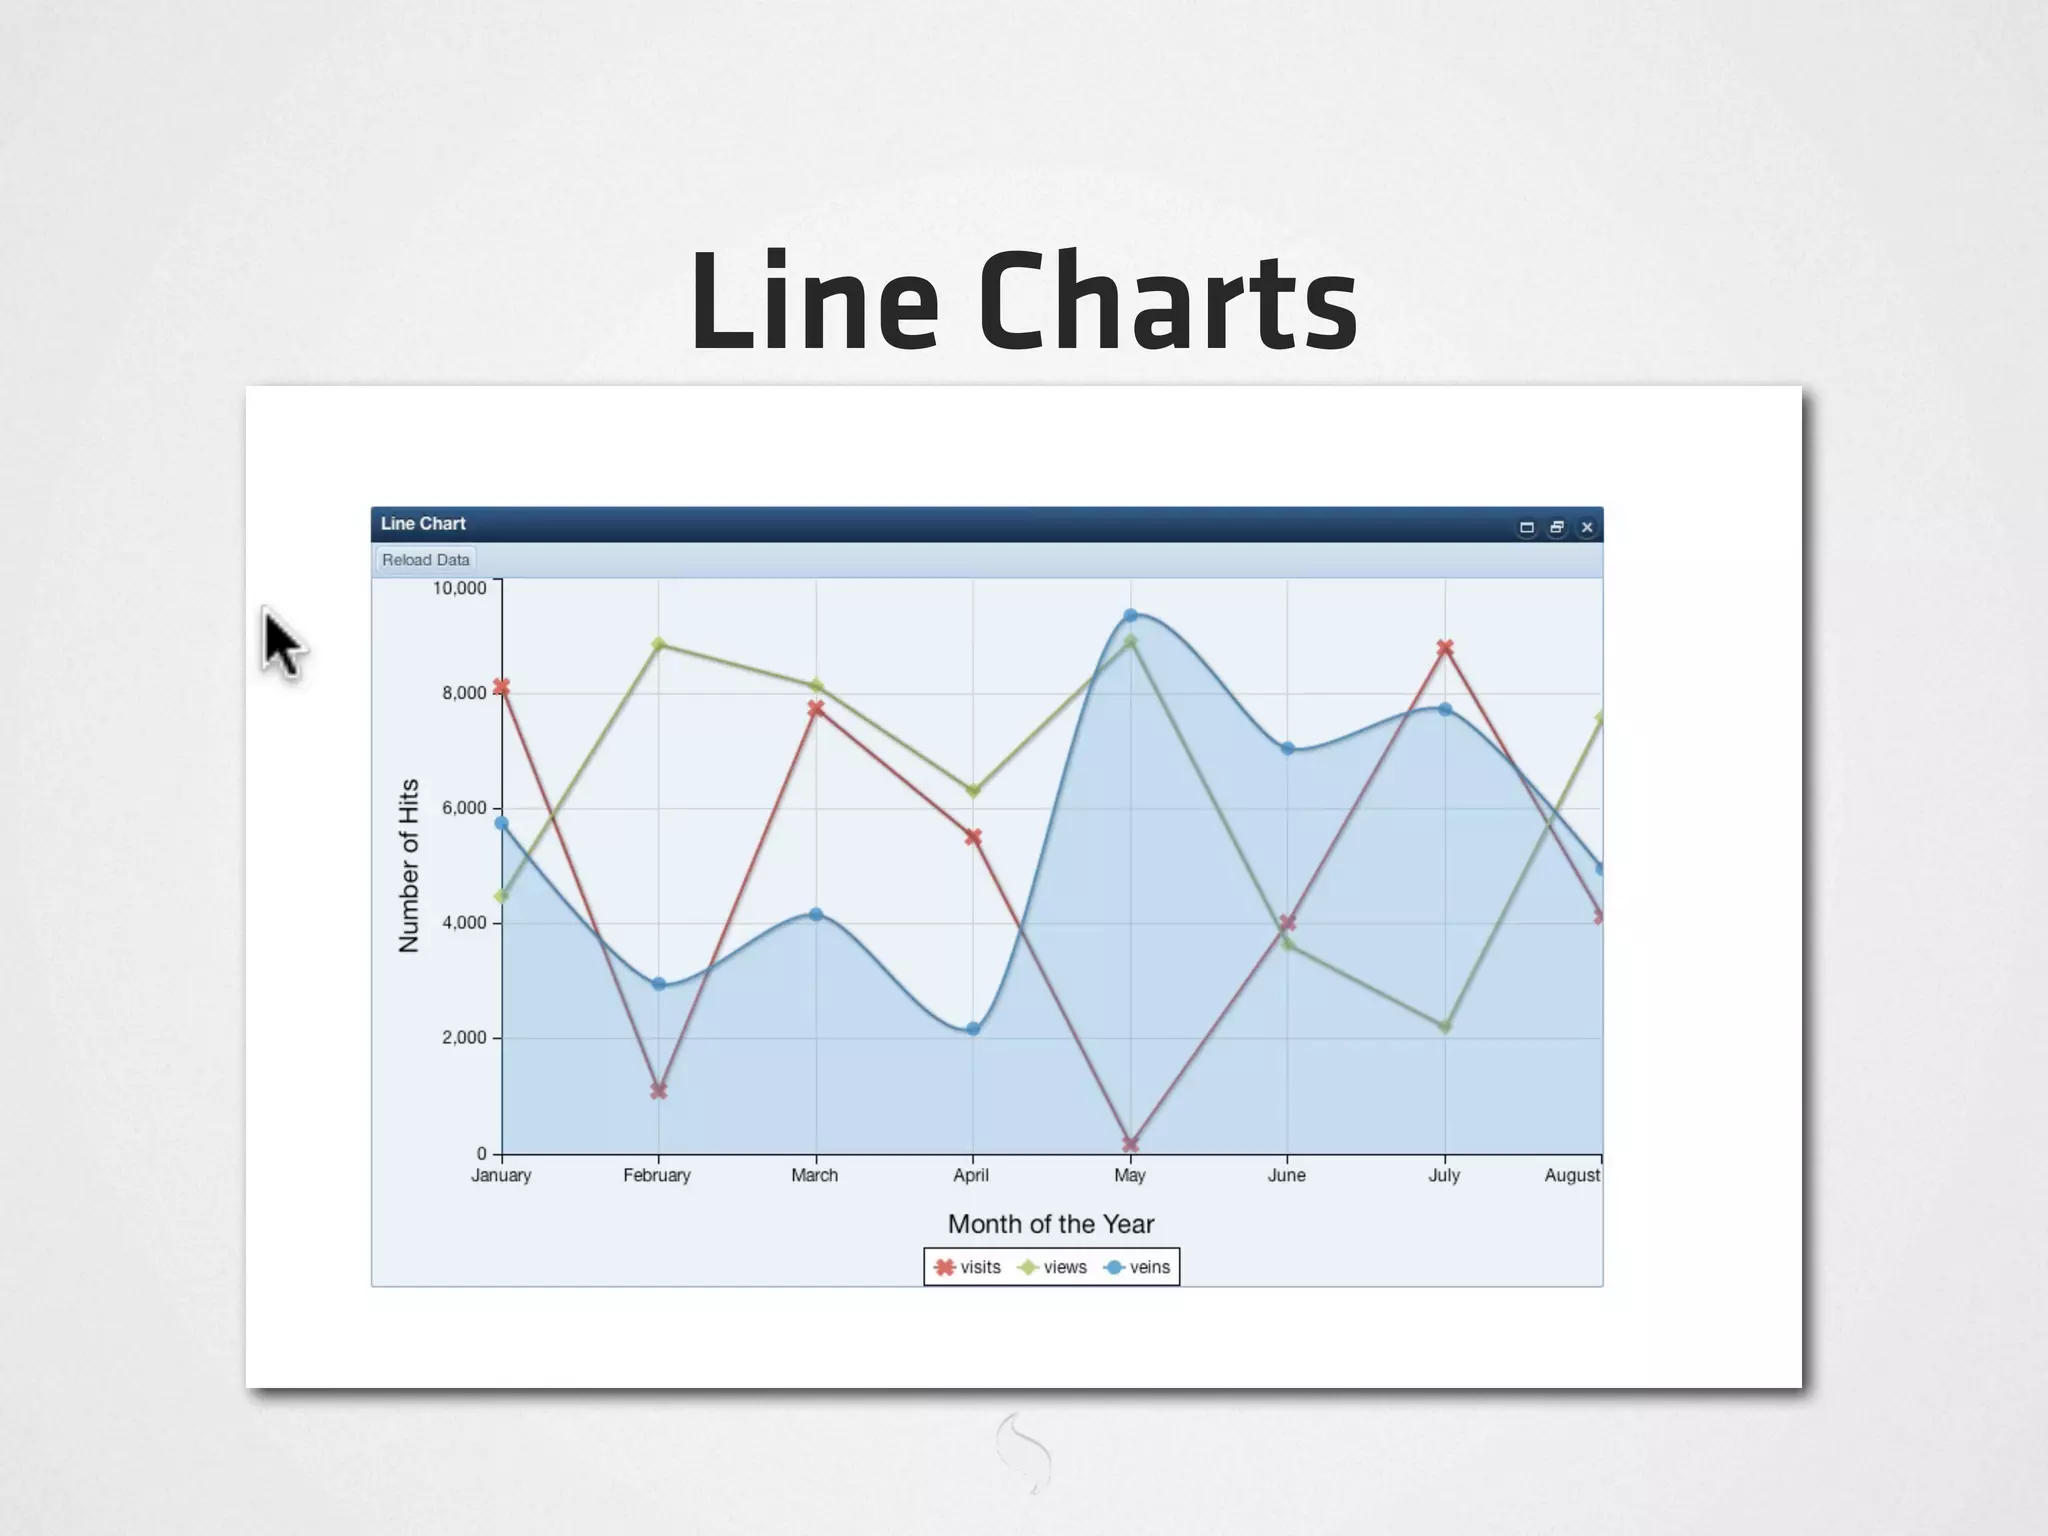
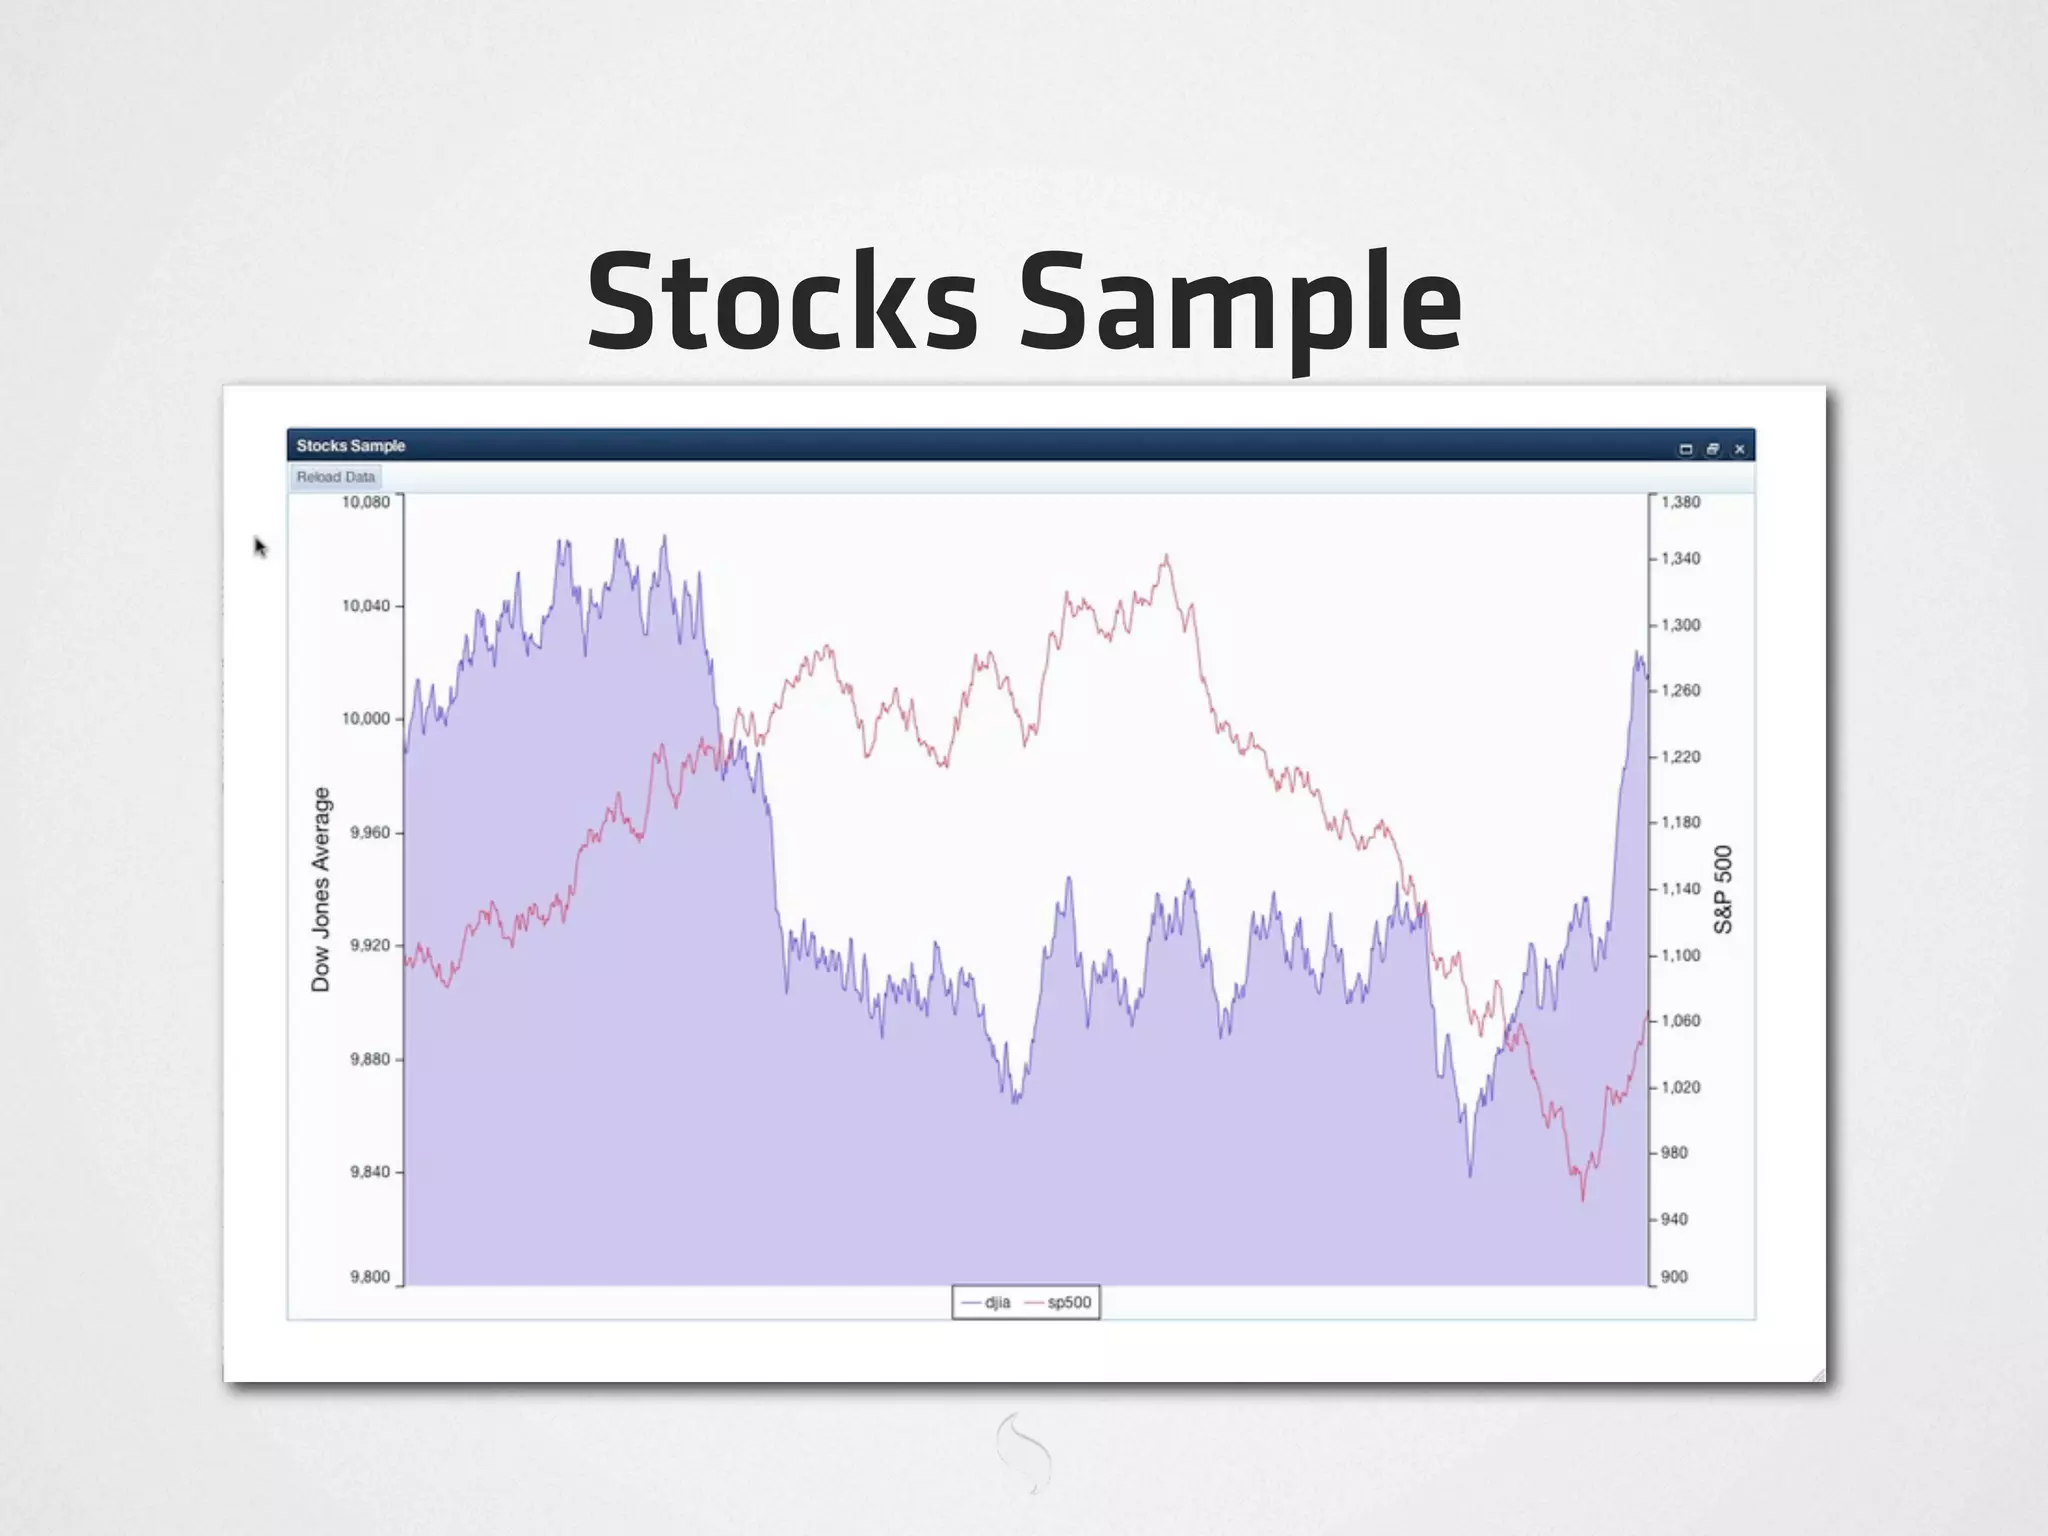
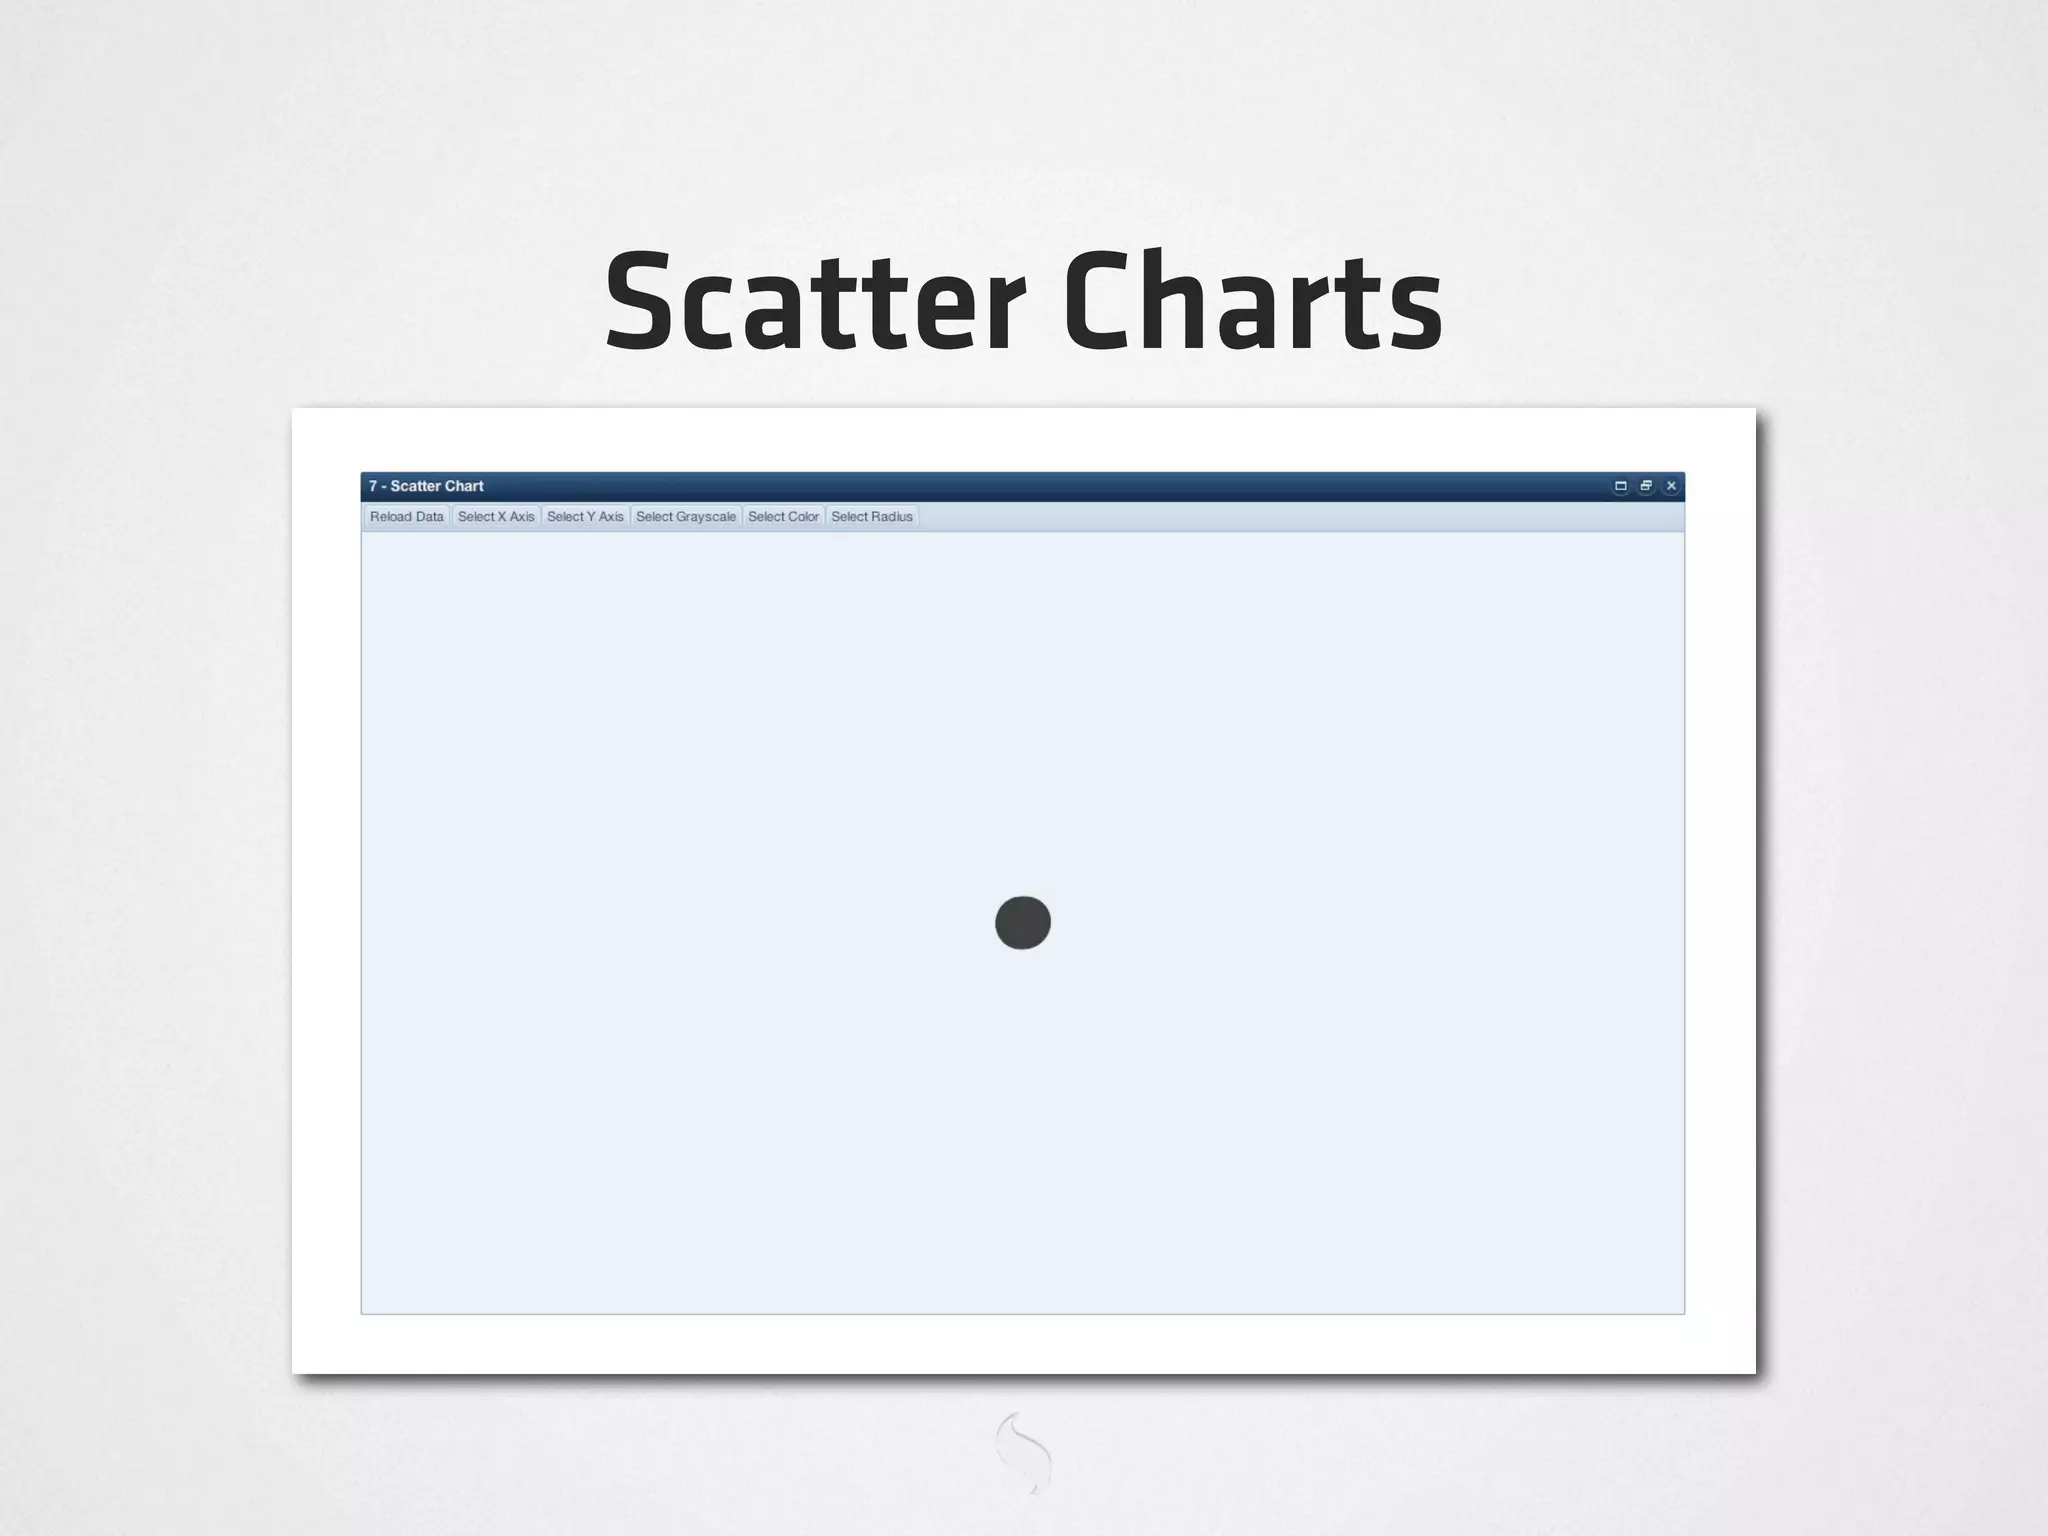
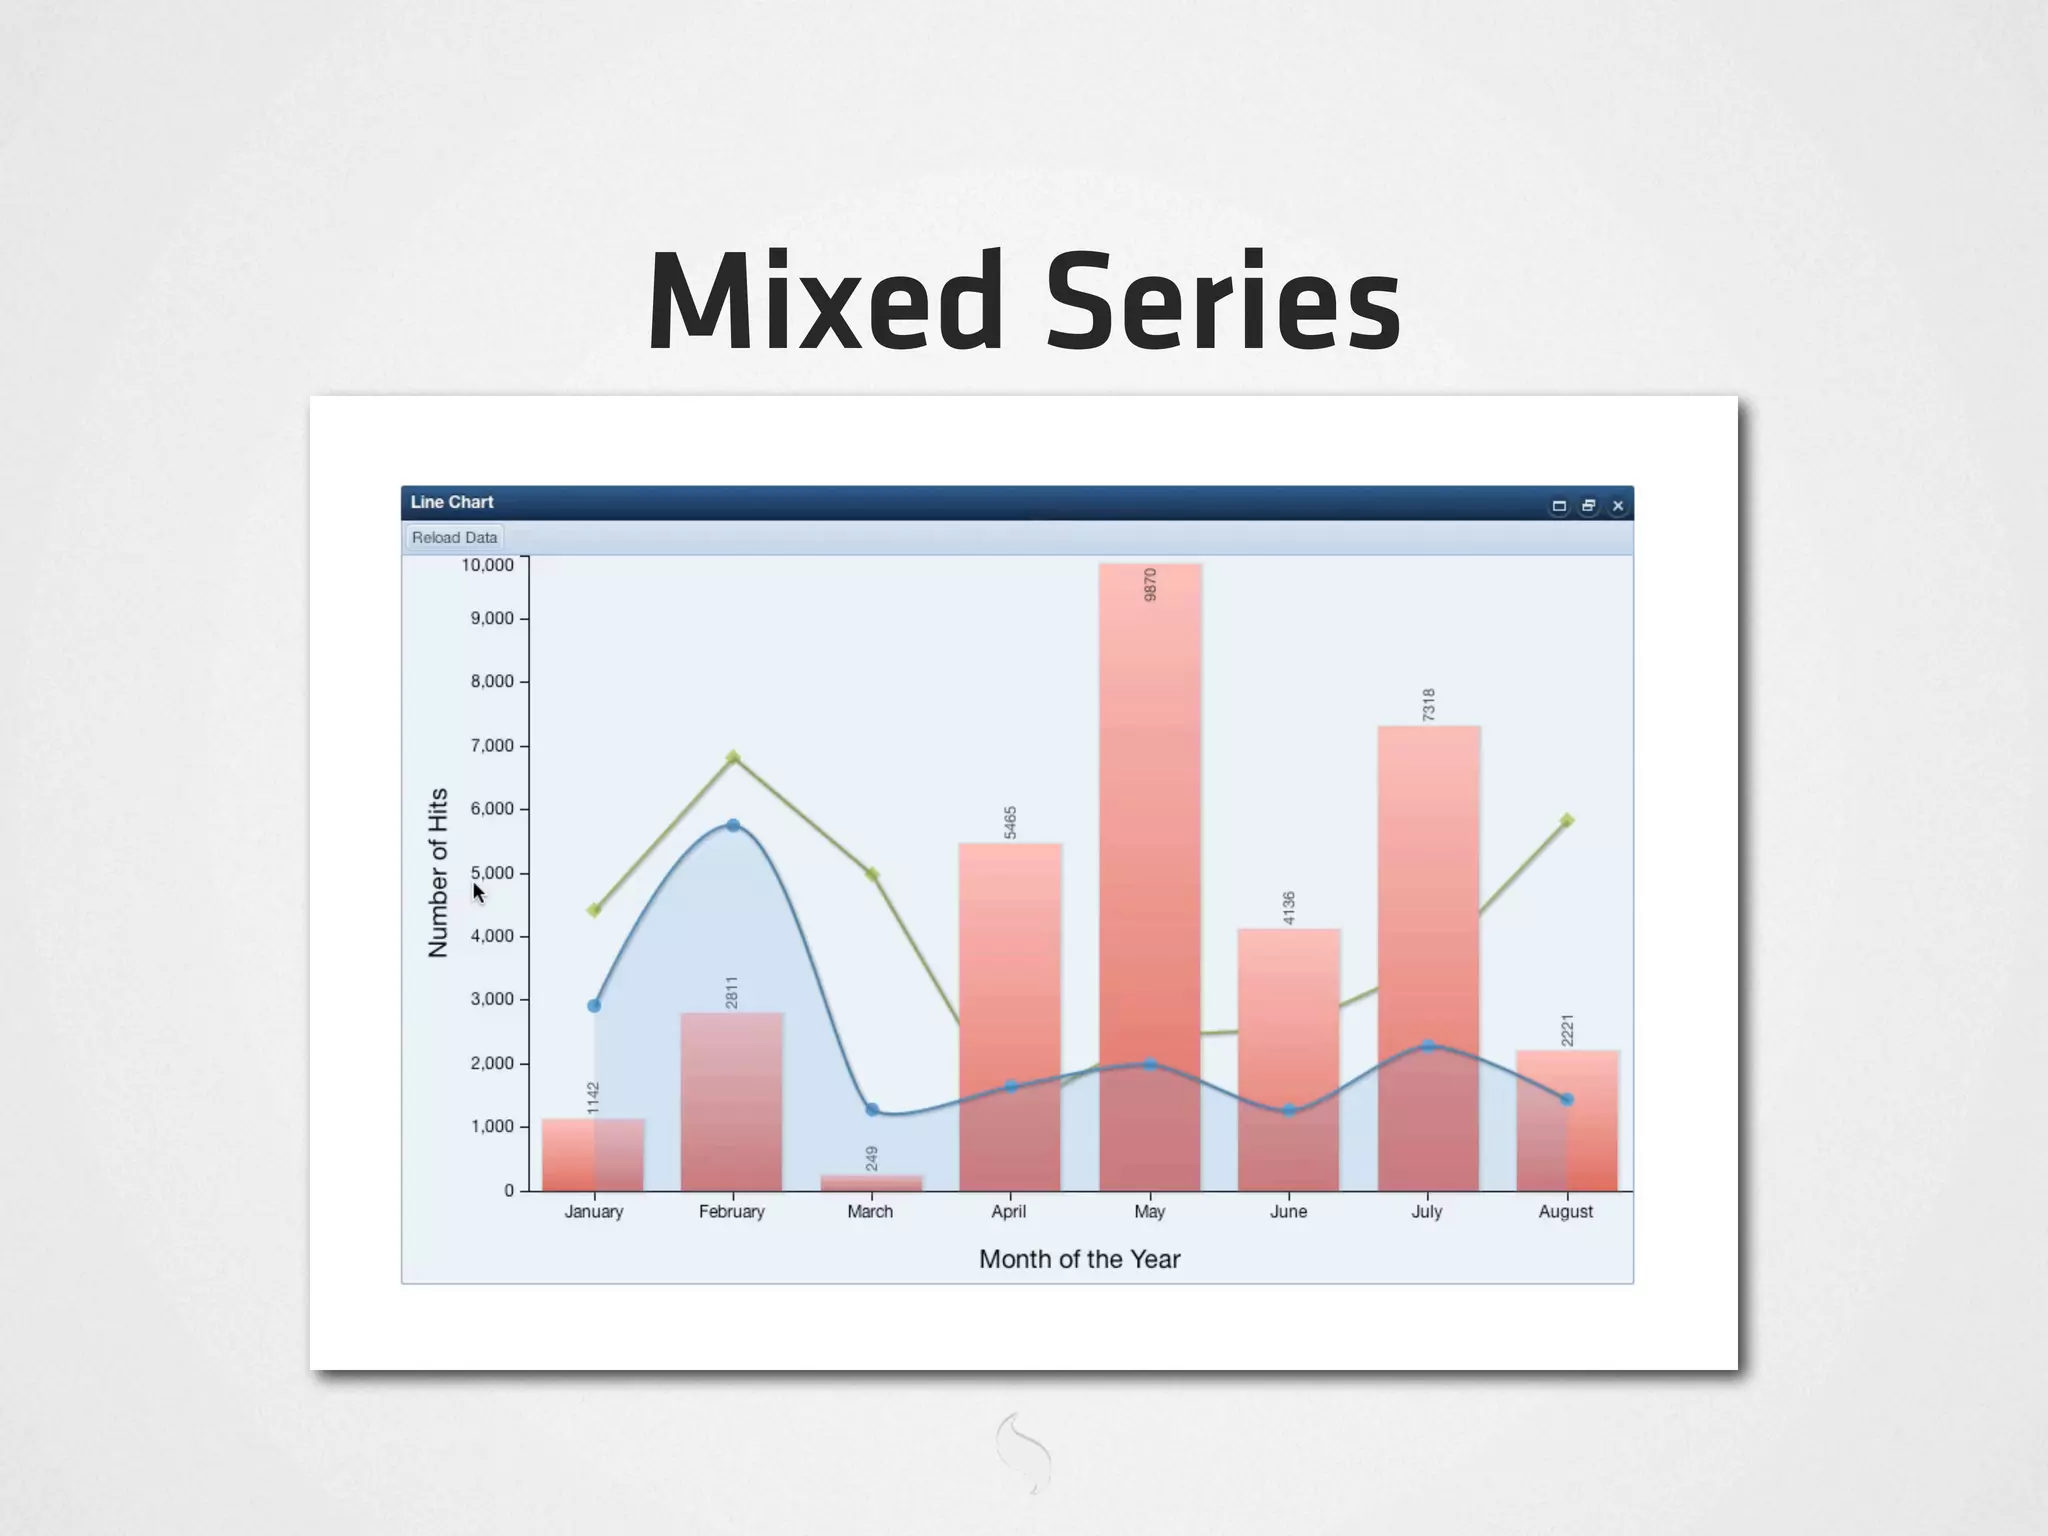

Ext JS provides libraries for charting and visualization including Raphaël, CSS3 Pie, and InfoVis. It includes engines for SVG, VML, and Canvas rendering. The Surface class renders primitives, text, images, and gradients. Sprites are drawing elements that normalize differences between engines and support attributes, events, transforms, and animation. DrawComponents extend Ext components to provide customizable engine preferences and participate in layouts. Charts include series, axes, legends, and callouts. Supported chart types include pie, bar, column, line, area, and scatter plots. Charts support gradients, labels, tooltips, highlighting, stacking, and custom renderers.