Financial Analysis - China Communications Construction Company Ltd. is a transportation infrastructure group. The Company is involved in infrastructure construction, infrastructure design, dredging, and port machinery manufacturing
•
1 like•581 views

Financial Analysis - China Communications Construction Company Ltd. is a transportation infrastructure group. The Company is involved in infrastructure construction, infrastructure design, dredging, and port machinery manufacturing

Recommended
Recommended
More Related Content
What's hot
What's hot (20)
Similar to Financial Analysis - China Communications Construction Company Ltd. is a transportation infrastructure group. The Company is involved in infrastructure construction, infrastructure design, dredging, and port machinery manufacturing
Similar to Financial Analysis - China Communications Construction Company Ltd. is a transportation infrastructure group. The Company is involved in infrastructure construction, infrastructure design, dredging, and port machinery manufacturing (20)
More from BCV
More from BCV (20)
Recently uploaded
Recently uploaded (20)
Financial Analysis - China Communications Construction Company Ltd. is a transportation infrastructure group. The Company is involved in infrastructure construction, infrastructure design, dredging, and port machinery manufacturing
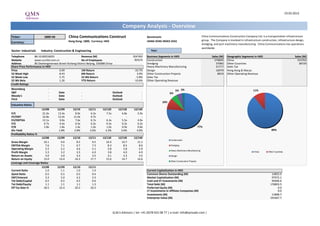
- 1. 19.03.2013 Company Analysis - Overview Ticker: 1800 HK China Communications Construct Benchmark: China Communications Construction Company Ltd. is a transportation infrastructure Hong Kong: 1800, Currency: HKD HANG SENG INDEX (HSI) group. The Company is involved in infrastructure construction, infrastructure design, Currency: dredging, and port machinery manufacturing. China Communications has operations worldwide. Sector: Industrials Industry: Construction & Engineering Year: Telephone 86-10-82016655 Revenue (M) 354'492 Business Segments in HKD Sales (M) Geographic Segments in HKD Sales (M) Website www.ccccltd.com.cn No of Employees 90'674 Construction 270695 China 315763 Address 85 Deshengmenwai Street Xicheng District Beijing, 100088 China Dredging 37083 Other Countries 38729 Share Price Performance in HKD Heavy Machinery Manufacturing 21717 Sales Tax Price 6.69 1M Return -10.7% Design 16979 Hong Kong & Macau 52 Week High 8.43 6M Return 3.9% Other Construction Projects 8019 Other Operating Revenue 52 Week Low 5.75 52 Wk Return -5.8% Sales Tax 52 Wk Beta 1.26 YTD Return -10.6% Other Operating Revenue Credit Ratings Bloomberg - 5% 2% 11% S&P - Date - Outlook - 6% Moody's - Date - Outlook - Fitch - Date - Outlook - 10% Valuation Ratios 12/08 12/09 12/10 12/11 12/12E 12/13E 12/14E P/E 21.0x 13.4x 8.9x 6.2x 7.5x 6.8x 5.9x EV/EBIT 16.8x 12.4x 11.0x 9.7x - - - EV/EBITDA 12.1x 9.0x 7.6x 6.7x 6.3x 5.5x 4.9x P/S 0.7x 0.4x 0.3x 0.2x 0.3x 0.2x 0.2x P/B 2.8x 1.8x 1.4x 1.0x 1.0x 0.9x 0.8x 77% Div Yield - 1.8% 2.8% 3.6% 3.3% 3.6% 4.0% 89% Profitability Ratios % 12/08 12/09 12/10 12/11 12/12E 12/13E 12/14E Construction Gross Margin 10.1 9.6 8.5 9.5 10.4 10.7 11.1 EBITDA Margin 7.6 7.1 6.7 7.3 8.3 8.5 8.6 Dredging Operating Margin 5.5 5.2 4.6 5.1 5.8 5.8 5.9 Heavy Machinery Manufacturing Profit Margin 3.3 3.2 3.5 4.0 3.8 4.0 4.0 China Other Countries Return on Assets 3.0 3.0 3.3 3.5 3.1 3.3 3.5 Design Return on Equity 13.0 14.4 16.3 17.7 15.0 14.7 14.6 Other Construction Projects Leverage and Coverage Ratios 12/08 12/09 12/10 12/11 Current Ratio 1.0 1.1 1.0 1.0 Current Capitalization in HKD Quick Ratio 0.5 0.5 0.5 0.4 Common Shares Outstanding (M) 14825.0 EBIT/Interest 3.3 5.0 4.2 3.3 Market Capitalization (M) 97972.1 Tot Debt/Capital 0.5 0.5 0.5 0.6 Cash and ST Investments (M) 95006.6 Tot Debt/Equity 1.1 1.1 1.1 1.3 Total Debt (M) 176803.5 Eff Tax Rate % 18.5 22.4 20.2 20.3 Preferred Equity (M) 0.0 LT Investments in Affiliate Companies (M) 0.0 Investments (M) 11898.7 Enterprise Value (M) 191667.7 Q.M.S Advisors | tel: +41 (0)78 922 08 77 | e-mail: info@qmsadv.com |
- 2. Company Analysis - Analysts Ratings China Communications Construct Target price in HKD Broker Recommendation Buy and Sell Recommendations vs Price and Target Price Price Brokers' Target Price 10 12 100% 0% 5% 0% 0% 0% 0% 0% 0% 6% 6% 6% 6% 20% 9 10 21% 23% 18% 18% 20% 27% 27% 32% 80% 25% 24% 35% 8 8 7 6 60% 6 4 5 2 40% 79% 80% 77% 4 76% 76% 75% 73% 73% 0 69% 71% 68% 65% Morgan Stanley UOB Kay Hian Daiwa Securities Co. Ltd. Barclays Citic Securities Co., Ltd China International Capital CCB International Securities Macquarie JPMorgan Credit Suisse Bank of China International HSBC DBS Vickers AMTD Financial Planning EVA Dimensions Guotai Junan SinoPac Goldman Sachs Deutsche Bank Jefferies 3 20% 2 Limited 1 Corp Ltd 0% 0 mars.12 avr.12 mai.12 juin.12 juil.12 août.12 sept.12 oct.12 nov.12 déc.12 janv.13 févr.13 Buy Hold Sell Price Target Price Date Buy Hold Sell Date Price Target Price Broker Analyst Recommendation Target Date 28-Feb-13 68% 32% 0% 19-Mar-13 6.69 8.61 UOB Kay Hian MARK PO buy 9.91 7-Mar-13 31-Jan-13 65% 35% 0% 18-Mar-13 6.69 8.61 Deutsche Bank PHYLLIS WANG buy 9.43 28-Feb-13 31-Dec-12 73% 27% 0% 15-Mar-13 6.78 8.61 Morgan Stanley KEVIN LUO Overwt/Attractive 8.90 31-Jan-13 30-Nov-12 73% 27% 0% 14-Mar-13 6.91 8.61 HSBC ANDERSON CHOW neutral 8.50 31-Jan-13 31-Oct-12 77% 23% 0% 13-Mar-13 6.84 8.61 Goldman Sachs TIAN LU neutral/neutral 8.30 20-Jan-13 28-Sep-12 80% 20% 0% 12-Mar-13 7.08 8.61 EVA Dimensions CRAIG STERLING hold 15-Jan-13 31-Aug-12 75% 20% 5% 11-Mar-13 7.28 8.61 Macquarie SAIYI HE outperform 9.10 11-Jan-13 31-Jul-12 76% 18% 6% 8-Mar-13 7.31 8.61 JPMorgan KAREN LI overweight 9.00 9-Jan-13 29-Jun-12 76% 18% 6% 7-Mar-13 7.38 8.61 Bank of China International LI PAN buy 5.30 20-Dec-12 31-May-12 71% 24% 6% 6-Mar-13 7.40 8.43 Guotai Junan GARY WONG neutral 7.25 27-Nov-12 30-Apr-12 69% 25% 6% 5-Mar-13 7.26 8.43 DBS Vickers RACHEL MIU buy 8.30 31-Oct-12 30-Mar-12 79% 21% 0% 4-Mar-13 7.25 8.43 Daiwa Securities Co. Ltd. JOSEPH HO hold 7.21 31-Oct-12 1-Mar-13 7.26 8.43 China International Capital Corp WU HUIMIN accumulate 7.50 31-Oct-12 28-Feb-13 7.34 8.43 CCB International Securities Ltd ELIZA LIU outperform 17-Oct-12 27-Feb-13 7.21 8.11 Barclays PATRICK XU overweight 9.45 12-Oct-12 26-Feb-13 7.15 8.11 AMTD Financial Planning Limited KENNY TANG SING HING buy 6.90 4-Oct-12 25-Feb-13 7.36 8.11 Jefferies JULIAN BU hold 7.10 5-Sep-12 22-Feb-13 7.36 8.11 Citic Securities Co., Ltd BAO RONGFU buy 30-Aug-12 21-Feb-13 7.42 8.11 SinoPac VIVIAN LIU buy 9.40 16-May-12 20-Feb-13 7.57 8.24 Credit Suisse INGRID WEI neutral 7.48 31-Jan-12 19-Feb-13 7.49 8.24 18-Feb-13 7.56 8.24 15-Feb-13 7.60 8.24 14-Feb-13 7.61 8.24 13-Feb-13 7.56 8.24 12-Feb-13 7.56 8.24 11-Feb-13 7.56 8.24 8-Feb-13 7.56 8.25 7-Feb-13 7.60 8.25 6-Feb-13 7.64 8.25 Q.M.S Advisors | tel: +41 (0)78 922 08 77 | e-mail: info@qmsadv.com |
- 3. 19.03.2013 China Communications Construct Company Analysis - Ownership Ownership Type Ownership Statistics Geographic Ownership Distribution Geographic Ownership 0% Shares Outstanding (M) 14825.0 United States 53.95% Float 100.0% Hong Kong 25.42% 1% 1% 5% 2% Short Interest (M) Luxembourg 8.82% 2% Short Interest as % of Float Ireland 2.37% Days to Cover Shorts Britain 2.04% 9% 48% Institutional Ownership 51.63% 52% Japan 1.18% 55% Retail Ownership 48.37% China 1.11% Insider Ownership 0.00% Others 5.12% 25% Institutional Ownership Distribution Investment Advisor 91.05% Mutual Fund Manager 8.52% Hedge Fund Manager 0.35% Institutional Ownership Retail Ownership Insider Ownership Insurance Company 0.08% United States Hong Kong Luxembourg Ireland Pricing data is in HKD Others 0.00% Britain Japan China Others Top 20 Owners: TOP 20 ALL Institutional Ownership Holder Name Position Position Change Market Value % of Ownership Report Date Source Country MERRILL LYNCH FAR EA 525'000'000 0 3'512'250'000 11.86% 30.06.2011 Co File HONG KONG 0% 0% 0% BLACKROCK 359'848'731 -331'000 2'407'388'010 8.13% 15.03.2013 ULT-AGG UNITED STATES 9% JP MORGAN 309'007'233 -20'000 2'067'258'389 6.98% 01.03.2013 ULT-AGG VANGUARD GROUP INC 232'938'376 191'800 1'558'357'735 5.26% 31.12.2012 MF-AGG UNITED STATES DIMENSIONAL FUND ADV 80'069'714 0 535'666'387 1.81% 31.07.2012 MF-AGG UNITED STATES ROBECO INVESTOR SERV 58'783'095 26'862'723 393'258'906 1.33% 31.01.2013 MF-AGG LUXEMBOURG GRANTHAM MAYO VAN OT 49'328'150 0 330'005'324 1.11% 31.05.2012 MF-AGG UNITED STATES FMR LLC 41'568'068 -36'263'488 278'090'375 0.94% 31.01.2013 ULT-AGG UNITED STATES HANG SENG INVESTMENT 37'826'652 0 253'060'302 0.85% 30.06.2012 MF-AGG HONG KONG INVESCO LTD 35'189'000 -1'421'000 235'414'410 0.79% 18.03.2013 MF-AGG UNITED STATES 91% AMERIPRISE FINANCIAL 28'495'560 -10'000 190'635'296 0.64% 31.01.2013 MF-AGG UNITED STATES HARVEST FUND MANAGEM 23'262'000 2'339'000 155'622'780 0.53% 30.06.2012 MF-AGG CHINA DWS INVESTMENT SA 21'329'800 70'000 142'696'362 0.48% 31.01.2013 MF-AGG LUXEMBOURG BANK OF NEW YORK MEL 20'180'300 -414'000 135'006'207 0.46% 15.03.2013 MF-AGG UNITED STATES Investment Advisor Mutual Fund Manager Hedge Fund Manager Insurance Company Others AMUNDI LUXEMBOURG SA 17'855'251 -2'430'000 119'451'629 0.40% 31.10.2012 MF-AGG LUXEMBOURG ALLIANZ ASSET MANAGE 17'401'000 -1'805'000 116'412'690 0.39% 28.02.2013 ULT-AGG GERMANY INSTITUTIONAL CAPITA 15'990'000 0 106'973'100 0.36% 31.01.2013 MF-AGG UNITED STATES PRINCIPAL FINANCIAL 14'275'693 -10'302'000 95'504'386 0.32% 31.01.2013 ULT-AGG UNITED STATES F&C FUND MANAGEMENT 14'142'000 746'000 94'609'980 0.32% 31.12.2012 MF-AGG BRITAIN PUTNAM INVESTMENT MA 13'925'000 9'581'000 93'158'250 0.31% 31.12.2012 MF-AGG UNITED STATES Top 5 Insiders: Holder Name Position Position Change Market Value % of Ownership Report Date Source Q.M.S Advisors | tel: +41 (0)78 922 08 77 | e-mail: info@qmsadv.com |
- 4. Company Analysis - Financials I/IV China Communications Construct Financial information is in HKD (M) Equivalent Estimates Periodicity: Fiscal Year 12/01 12/02 12/03 12/04 12/05 12/06 12/07 12/08 12/09 12/10 12/11 12/12E 12/13E 12/14E Income Statement Revenue 45'612 62'025 79'056 111'952 154'510 197'312 257'480 313'085 354'492 368'339 411'626 454'073 - Cost of Goods Sold 41'035 56'065 71'313 100'439 138'538 177'481 232'852 286'398 320'875 Gross Income 4'577 5'960 7'743 11'514 15'972 19'831 24'628 26'686 33'617 38'274 44'159 50'211 - Selling, General & Admin Expenses 3'580 4'247 5'222 6'583 7'612 8'978 13'188 13'527 17'109 (Research & Dev Costs) 39 41 54 286 1'218 1'971 1'808 2'787 Operating Income 1'429 2'221 3'269 5'857 9'436 10'853 13'283 14'505 18'037 21'448 23'971 26'774 - Interest Expense 562 648 906 1'276 1'536 2'679 2'636 2'505 3'752 - Foreign Exchange Losses (Gains) 266 168 -625 -36 19 -83 -158 -320 -558 - Net Non-Operating Losses (Gains) -328 -341 -395 -756 -1'992 -2'291 -899 -1'547 -3'262 Pretax Income 930 1'745 3'383 5'373 9'873 10'548 11'703 13'868 18'104 17'927 20'751 23'176 - Income Tax Expense 340 430 562 1'197 2'102 1'956 2'621 2'804 3'669 Income Before XO Items 590 1'315 2'821 4'177 7'771 8'592 9'082 11'064 14'435 - Extraordinary Loss Net of Tax 0 0 0 0 0 0 0 0 - Minority Interests 181 307 737 1'059 1'582 2'007 912 45 260 Diluted EPS Before XO Items 0.56 0.75 0.95 Net Income Adjusted* 409 1'008 2'084 3'117 6'189 6'809 8'170 11'322 14'175 14'115 16'439 18'364 EPS Adjusted 0.00 0.00 0.00 0.28 0.42 0.46 0.56 0.77 0.95 0.89 0.99 1.13 Dividends Per Share 0.00 0.00 0.00 0.00 0.09 0.13 0.18 0.22 0.22 0.24 0.27 Payout Ratio % 0.0 0.0 0.0 17.8 21.6 23.9 24.7 24.7 0.24 0.25 0.24 Total Shares Outstanding 14'825 14'825 14'825 14'825 14'825 14'825 Diluted Shares Outstanding 10'968 14'825 14'825 14'825 14'825 EBITDA 2'651 3'662 5'108 8'006 11'952 15'054 18'293 21'104 25'857 30'646 34'934 39'187 *Net income excludes extraordinary gains and losses and one-time charges. Q.M.S Advisors | tel: +41 (0)78 922 08 77 | e-mail: info@qmsadv.com |
- 5. Company Analysis - Financials II/IV Periodicity: 12/01 12/02 12/03 12/04 12/05 12/06 12/07 12/08 12/09 12/10 12/11 12/12E 12/13E 12/14E Balance Sheet Total Current Assets 30727.2233 40224.4415 51744.8168 88745.3873 109823.194 166896.525 186781.86 225374.28 275276.206 + Cash & Near Cash Items 6'390 9'385 10'374 30'690 23'858 30'590 37'181 45'731 54'847 + Short Term Investments 229 117 113 0 333 9'728 1'315 145 841 + Accounts & Notes Receivable 8'079 10'184 13'119 19'224 26'344 39'213 42'514 55'661 62'757 + Inventories 8'880 11'968 17'108 24'857 36'716 62'270 68'911 76'653 94'762 + Other Current Assets 7'149 8'570 11'031 13'974 22'572 25'096 36'861 47'184 62'069 Total Long-Term Assets 18'070 20'247 24'214 37'784 69'099 84'976 113'103 141'029 167'047 + Long Term Investments 2'990 2'715 3'131 9'974 26'444 13'388 37'241 44'840 52'052 Gross Fixed Assets 20'815 23'460 27'295 32'772 46'670 80'579 103'706 117'644 Accumulated Depreciation 9'405 10'035 11'220 12'322 15'558 22'237 32'517 39'658 + Net Fixed Assets 11'410 13'425 16'075 20'451 31'112 43'281 58'342 71'189 77'985 + Other Long Term Assets 3'669 4'107 5'008 7'359 11'543 28'306 17'520 25'000 37'009 Total Current Liabilities 33'815 43'038 54'978 75'713 100'029 159'364 176'807 225'429 269'956 + Accounts Payable 9'998 12'665 17'542 25'770 39'389 49'536 66'889 92'676 117'965 + Short Term Borrowings 11'237 13'775 16'785 22'024 23'331 47'987 40'933 50'437 66'930 + Other Short Term Liabilities 12'580 16'599 20'651 27'919 37'309 61'840 68'985 82'315 85'061 Total Long Term Liabilities 8'518 8'747 9'022 14'212 21'216 28'445 47'863 53'782 72'573 + Long Term Borrowings 4'156 4'563 4'785 8'562 13'503 22'704 39'401 45'494 63'808 + Other Long Term Borrowings 4'362 4'184 4'237 5'649 7'713 5'741 8'462 8'289 8'766 Total Liabilities 42'333 51'786 64'000 89'924 121'245 187'808 224'670 279'211 342'530 + Long Preferred Equity 0 0 0 0 0 0 0 0 + Minority Interest 1'519 2'542 3'368 4'886 9'424 12'579 13'191 12'894 13'240 + Share Capital & APIC 28'582 30'652 16'833 32'569 33'827 35'356 + Retained Earnings & Other Equity 4'945 6'144 8'591 3'137 17'601 34'651 29'455 40'472 51'198 Total Shareholders Equity 6'464 8'686 11'959 36'605 57'677 64'064 75'215 87'193 99'793 Total Liabilities & Equity 48'797 60'472 75'958 126'529 178'922 251'872 299'885 366'403 442'323 Book Value Per Share 2.14 3.25 3.47 4.18 5.01 5.84 6.46 7.30 8.15 Tangible Book Value Per Share 1.99 2.90 2.52 3.41 3.75 3.85 Q.M.S Advisors | tel: +41 (0)78 922 08 77 | e-mail: info@qmsadv.com |
- 6. Company Analysis - Financials III/IV Periodicity: 12/01 12/02 12/03 12/04 12/05 12/06 12/07 12/08 12/09 12/10 12/11 12/12E 12/13E 12/14E Cash Flows Net Income 409 1'008 2'084 3'117 6'189 6'585 8'170 11'019 14'175 14'130 16'401 18'271 + Depreciation & Amortization 1'222 1'441 1'839 2'149 2'517 4'201 5'011 6'598 7'820 + Other Non-Cash Adjustments 1'248 1'377 735 2'080 1'648 276 1'179 -2'477 -3'560 + Changes in Non-Cash Capital -302 -1'587 -1'690 -3'371 -8'016 -13'014 2'813 86 -20'202 Cash From Operating Activities 2'578 2'239 2'968 3'975 2'337 -1'953 17'172 15'226 -1'767 + Disposal of Fixed Assets 933 553 286 367 667 1'037 467 1'103 999 + Capital Expenditures -3'502 -4'022 -4'336 -6'947 -11'952 -19'449 -16'191 -10'865 -9'726 -20'529 -22'191 -21'616 + Increase in Investments -66 -33 -69 -54 -225 -2'625 -898 -1'915 -143 + Decrease in Investments 122 120 25 27 169 878 125 629 266 + Other Investing Activities 50 -139 -798 -1'790 -5'318 758 -3'421 -7'318 -9'725 Cash From Investing Activities -2'462 -3'520 -4'893 -8'396 -16'658 -19'402 -19'917 -18'366 -18'329 + Dividends Paid 0 0 0 0 -76 -1'649 -1'974 -2'857 + Change in Short Term Borrowings + Increase in Long Term Borrowings 10'743 13'306 17'707 28'303 29'880 61'526 88'031 63'761 89'903 + Decrease in Long Term Borrowings -9'562 -10'065 -15'005 -20'028 -25'674 -35'383 -75'142 -52'752 -59'180 + Increase in Capital Stocks 0 0 0 17'422 0 0 0 + Decrease in Capital Stocks 0 0 0 0 0 0 0 + Other Financing Activities 19 1'034 -13 -1'789 1'656 -523 -87 -145 -187 Cash From Financing Activities 1'200 4'275 2'689 23'908 5'785 25'620 11'154 8'890 27'679 Net Changes in Cash 1'315 2'993 763 19'486 -8'536 4'265 8'409 5'750 7'583 Free Cash Flow (CFO-CAPEX) -924 -1'783 -1'368 -2'972 -9'615 -21'402 981 4'361 -11'493 -9'173 -2'696 -1'809 Free Cash Flow To Firm -567 -1'295 -613 -1'981 -8'406 -19'220 3'027 6'359 -8'501 Free Cash Flow To Equity 2'011 1'620 5'670 -4'743 16'473 20'229 Free Cash Flow per Share -0.27 -0.65 -1.46 0.07 0.29 -0.78 Q.M.S Advisors | tel: +41 (0)78 922 08 77 | e-mail: info@qmsadv.com |
- 7. Company Analysis - Financials IV/IV Periodicity: 12/01 12/02 12/03 12/04 12/05 12/06 12/07 12/08 12/09 12/10 12/11 12/12E 12/13E 12/14E Ratio Analysis Valuation Ratios Price Earnings 26.6x 46.7x 21.0x 13.4x 8.9x 6.2x 7.5x 6.8x 5.9x EV to EBIT 19.8x 33.1x 16.8x 12.4x 11.0x 9.7x EV to EBITDA 14.5x 26.1x 12.1x 9.0x 7.6x 6.7x 6.3x 5.5x 4.9x Price to Sales 0.7x 1.9x 0.7x 0.4x 0.3x 0.2x 0.3x 0.2x 0.2x Price to Book 3.6x 6.3x 2.8x 1.8x 1.4x 1.0x 1.0x 0.9x 0.8x Dividend Yield 0.1% 0.5% 1.8% 2.8% 3.6% 3.3% 3.6% 4.0% Profitability Ratios Gross Margin 10.0% 9.6% 9.8% 10.3% 10.3% 10.1% 9.6% 8.5% 9.5% 10.4% 10.7% 11.1% EBITDA Margin 5.8% 5.9% 6.5% 7.2% 7.7% 7.6% 7.1% 6.7% 7.3% 8.3% 8.5% 8.6% Operating Margin 3.1% 3.6% 4.1% 5.2% 6.1% 5.5% 5.2% 4.6% 5.1% 5.8% 5.8% 5.9% Profit Margin 0.9% 1.6% 2.6% 2.8% 4.0% 3.3% 3.2% 3.5% 4.0% 3.8% 4.0% 4.0% Return on Assets 1.8% 3.1% 3.1% 4.1% 3.0% 3.0% 3.3% 3.5% 3.1% 3.3% 3.5% Return on Equity 18.1% 28.4% 15.7% 15.7% 13.0% 14.4% 16.3% 17.7% 15.0% 14.7% 14.6% Leverage & Coverage Ratios Current Ratio 0.91 0.93 0.94 1.17 1.10 1.05 1.06 1.00 1.02 Quick Ratio 0.43 0.46 0.43 0.66 0.51 0.50 0.46 0.45 0.44 Interest Coverage Ratio (EBIT/I) 2.54 3.43 3.61 4.59 6.14 3.25 5.04 4.16 3.33 Tot Debt/Capital 0.70 0.68 0.64 0.46 0.39 0.52 0.52 0.52 0.57 Tot Debt/Equity 2.38 2.11 1.80 0.84 0.64 1.10 1.07 1.10 1.31 Others Asset Turnover 1.13 1.16 1.12 1.02 0.90 0.93 0.95 0.88 Accounts Receivable Turnover 6.78 6.80 6.97 6.86 5.95 6.31 6.45 6.00 Accounts Payable Turnover 5.21 5.05 5.00 4.61 4.44 4.12 3.69 3.19 Inventory Turnover 5.36 4.92 4.82 4.55 3.55 3.55 3.97 3.76 Effective Tax Rate 36.5% 24.6% 16.6% 22.3% 21.3% 18.5% 22.4% 20.2% 20.3% Q.M.S Advisors | tel: +41 (0)78 922 08 77 | e-mail: info@qmsadv.com |
- 8. Company Analysis - Peers Comparision CHINA COM CONS- CHINA RAIL GR-H CHINA RAIL CN-H VINCI SA SKANSKA AB-B CHINA STATE -A ZHEJIANG EXPRESS SHANG CONSTR-A ZHUZHOU CSR CSR CORP LTD -A H Latest Fiscal Year: 12/2011 12/2011 12/2011 12/2012 12/2012 12/2011 12/2012 12/2011 12/2011 12/2011 52-Week High 8.43 4.98 9.54 40.68 120.00 4.18 7.00 9.65 30.25 5.24 52-Week High Date 23.01.2013 10.01.2013 15.01.2013 19.03.2012 19.03.2012 18.02.2013 11.01.2013 08.05.2012 02.01.2013 05.02.2013 52-Week Low 5.75 2.48 4.81 31.23 93.30 2.90 4.80 5.21 16.38 3.75 52-Week Low Date 05.09.2012 30.03.2012 30.03.2012 01.06.2012 01.06.2012 24.09.2012 18.05.2012 23.03.2012 26.07.2012 27.09.2012 Daily Volume 12'782'070 16'696'500 7'563'500 364'393 686'094 96'668'255 2'266'259 6'843'197 4'094'776 22'807'447 Current Price (3/dd/yy) 6.69 3.88 7.26 35.45 116.20 3.41 6.47 7.27 22.90 4.34 52-Week High % Change -20.6% -22.1% -23.9% -12.8% -3.2% -18.4% -7.6% -24.6% -24.3% -17.2% 52-Week Low % Change 16.3% 56.5% 50.9% 13.5% 24.5% 17.6% 34.8% 39.5% 39.8% 15.7% Total Common Shares (M) 14'825.0 21'299.9 12'337.5 536.2 411.8 30'000.0 4'343.1 2'312.7 1'084.3 11'840.0 Market Capitalization 97'973 77'363 80'930 20'547 51'400 102'300 28'100 16'813 24'829 60'085 Total Debt 106'045.0 130'576.0 100'663.6 20'193.8 11'103.0 133'022.5 1'462.6 9'707.0 647.9 27'040.8 Preferred Stock - - - - - - - - - - Minority Interest 10'739.0 9'330.0 970.4 735.4 166.0 29'331.8 3'420.6 987.2 121.0 5'526.3 Cash and Equivalents 45'170.0 60'314.0 80'520.6 6'516.1 5'770.0 94'380.3 6'908.5 19'677.6 2'158.8 23'104.3 Enterprise Value 154'416 183'799 75'857 34'960 56'899 210'983 19'899 12'443 19'909 78'612 Valuation Total Revenue LFY 294'281.0 442'216.0 443'319.3 39'183.2 129'350.0 463'876.8 6'700.3 80'743.4 7'079.1 79'517.0 LTM 280'093.0 418'599.0 417'448.9 38'633.6 129'350.0 463'876.8 6'700.3 87'206.6 7'079.1 81'803.7 CY+1 295'062.1 459'520.7 467'694.0 38'898.6 129'702.9 576'124.5 7'104.4 - 6'545.9 88'279.7 CY+2 329'738.3 502'956.7 508'533.0 39'687.3 132'874.7 671'681.0 7'330.8 - 8'114.9 102'099.0 EV/Total Revenue LFY 0.6x 0.4x 0.2x 0.9x 0.4x 0.3x 2.3x 0.2x 1.9x 1.0x LTM 0.6x 0.4x 0.2x 0.9x 0.4x 0.3x 2.3x 0.2x 1.9x 1.0x CY+1 0.6x 0.3x 0.2x 0.9x 0.4x - 3.0x - 2.9x 0.6x CY+2 0.5x 0.3x 0.2x 0.8x 0.4x - 2.8x - 2.3x 0.5x EBITDA LFY 21'465.0 18'977.0 21'822.9 5'507.8 4'462.0 28'914.4 3'511.9 2'352.8 1'402.0 7'310.0 LTM 22'252.0 19'609.0 22'290.2 5'453.4 4'462.0 28'914.4 3'454.4 - 1'402.0 7'352.0 CY+1 24'549.0 18'794.1 22'322.3 5'534.1 6'151.7 - 3'523.8 - 1'253.8 7'279.8 CY+2 27'984.5 20'996.6 24'268.5 5'693.7 6'526.5 - 3'591.9 - 1'604.2 8'766.7 EV/EBITDA LFY 7.7x 8.5x 3.7x 6.1x 11.0x 5.4x 4.4x 6.5x 9.7x 11.0x LTM 7.4x 8.2x 3.6x 6.2x 11.0x 5.4x 4.5x - 9.7x 11.0x CY+1 6.6x 8.2x 3.8x 6.1x 8.7x - 6.0x - 14.9x 7.6x CY+2 6.3x 7.5x 3.7x 5.7x 8.2x - 5.7x - 11.5x 6.4x EPS LFY 0.76 0.32 0.68 3.52 - 0.43 0.42 0.40 1.09 0.33 LTM 0.72 0.31 0.61 3.58 6.93 0.45 0.39 0.66 1.09 0.31 CY+1 0.71 0.33 0.67 3.51 8.35 0.52 0.42 0.69 0.89 0.29 CY+2 0.79 0.38 0.74 3.72 8.94 0.61 0.41 0.77 1.18 0.35 P/E LFY 7.4x 10.1x 9.5x 9.9x 16.8x 7.6x 13.3x 11.0x 16.8x 14.2x LTM 7.8x 9.8x - 10.0x - 7.9x 12.5x - 16.8x - CY+1 7.5x 9.4x 8.7x 10.1x 13.9x 6.6x 12.4x 10.5x 20.5x 14.8x CY+2 6.8x 8.3x 7.9x 9.5x 13.0x 5.6x 12.5x 9.4x 15.5x 12.5x Revenue Growth 1 Year 7.9% (3.1%) (2.8%) 4.1% 8.9% 30.5% (1.2%) 10.2% 21.4% 24.0% 5 Year 17.3% 23.0% - 4.3% (1.1%) 29.4% (0.8%) 37.8% 42.8% 28.5% EBITDA Growth 1 Year 16.8% 20.9% 51.3% 1.1% (8.3%) 38.9% - 26.9% 10.7% 47.9% 5 Year 21.2% 26.7% 34.4% 3.7% (6.6%) 40.4% 0.8% 36.9% 33.9% 36.6% EBITDA Margin LTM 7.9% 4.7% 5.3% 14.1% 3.4% 6.2% 51.0% - 19.8% 9.0% CY+1 8.3% 4.1% 4.8% 14.2% 4.7% - 49.6% - 19.2% 8.2% CY+2 8.5% 4.2% 4.8% 14.3% 4.9% - 49.0% - 19.8% 8.6% Leverage/Coverage Ratios Total Debt / Equity % 151.0% 181.7% 155.5% 151.4% 57.9% 149.3% 9.6% 93.2% 12.2% 119.9% FALSE FALSE FALSE FALSE FALSE Total Debt / Capital % 56.7% 61.7% 60.5% 58.9% 36.5% 52.9% 7.3% 46.0% 10.6% 49.1% FALSE FALSE FALSE FALSE FALSE Total Debt / EBITDA 5.938x 7.676x 4.627x 3.703x 2.488x 4.601x 0.304x - 0.462x 3.136x FALSE FALSE FALSE FALSE FALSE Net Debt / EBITDA 3.353x 4.897x 1.024x 2.508x 1.195x 1.336x -1.749x - -1.078x 1.478x FALSE FALSE FALSE FALSE FALSE EBITDA / Int. Expense 4.776x 2.989x 5.926x 7.578x 9.637x 5.620x 43.875x 5.859x 42.973x 6.888x FALSE FALSE FALSE FALSE FALSE Credit Ratings S&P LT Credit Rating - BBB+ - BBB+ - - - - - - FALSE FALSE FALSE FALSE FALSE S&P LT Credit Rating Date - 23.01.2013 - 29.03.2007 - - - - - - FALSE FALSE FALSE FALSE FALSE Moody's LT Credit Rating - - - Baa1 - - - - - - FALSE FALSE FALSE FALSE FALSE Moody's LT Credit Rating Date - - - 23.07.2002 - - - - - - FALSE FALSE FALSE FALSE FALSE Q.M.S Advisors | tel: +41 (0)78 922 08 77 | e-mail: info@qmsadv.com |